
Archipelago Monitor Statistics
Archipelago (Ark): CAIDA's active measurement infrastructure serving the network research community since 2007.
Statistical information for the topology traces taken by this individual Ark monitor is displayed below. See the main statistics page for the full list of monitors
AS Path Dispersion (by IP Hop)
-
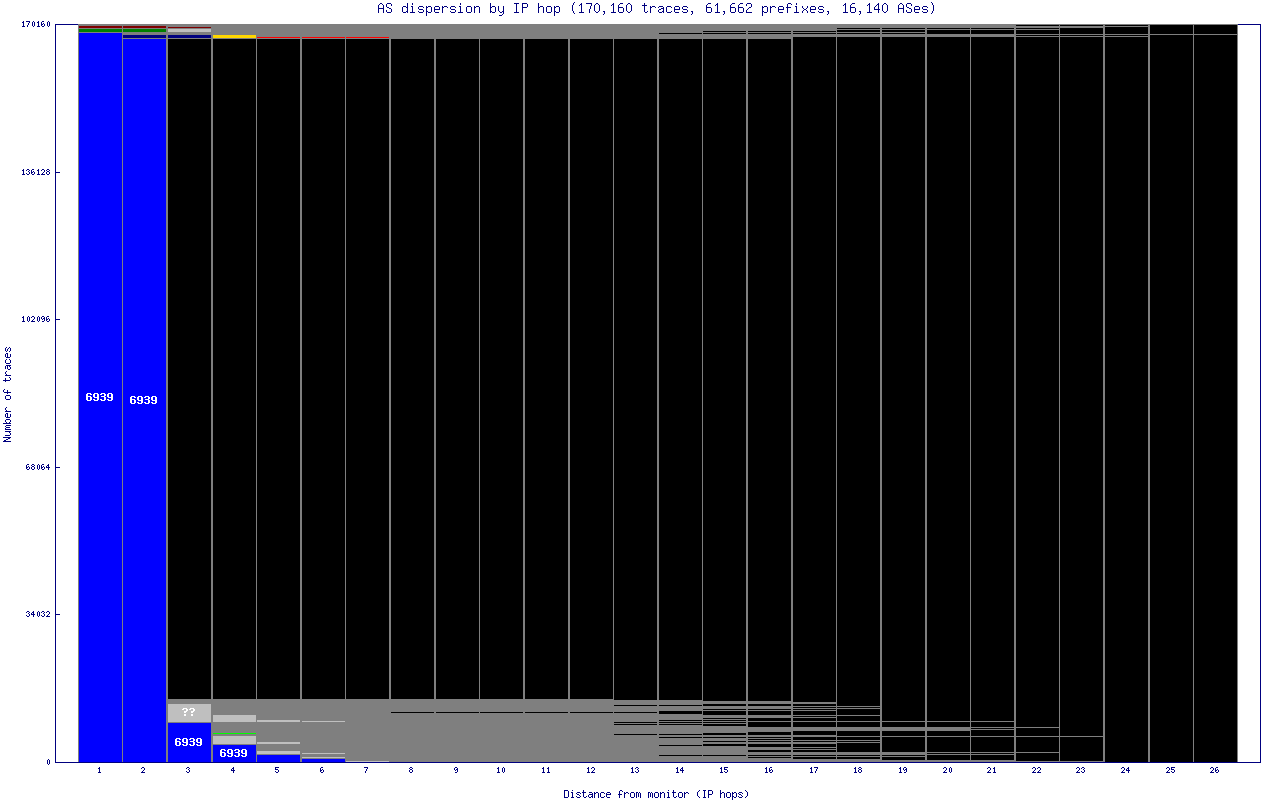
6939 HURRICANE - 1101 IP-EEND-AS - 29432 TREX-AS - 3356 LEVEL3 - 25192 CZNIC-AS - 6453 AS6453 - 2914 NTT-COMMUNICATIONS-2914 - 719 ELISA-AS - 9498 BBIL-AP - 6762 SEABONE-NET -
Uses
This graph tells you more (compared to the AS Dispersion by AS Hop graph) about where different ASes transit data to their peers. For instance, some routers within an AS will pass off their packets to many other ASes at a single IP hop, whereas others will send some packets to different ASes but continue to move data within their own AS. It is useful to compare these results with the hosting organization's information about what ASes are providing transit for your data, to see whether it matches what the Ark probes have discovered.Caveats
It is important to recognize that these graphs are meant to illuminate the routing from a monitor, and not to show the volume of traffic normally flowing on the links or their bandwidth. Because of this, an AS/IP that might only be used for a small amount of actual traffic (but routes to a large section of the address space) can seem disproportionately large on the graph.Characteristics of this graph
In this graph, we show the AS-level path dispersion, but adjacent IP hops within the same AS are not aggregated. It is characterized by AS chains that seems to break apart as one moves to the right; often a portion of paths will leave an AS at a certain IP hop distance and move on to a variety of other ASes, but the rest will remain within that AS for another hop or two (or ten) before finally exiting that AS. This lends the graph a step-like quality.Background
(See the Routed /24 Topology Dataset for more information. This summary applies to all the dispersion graphs.)Ark monitors collect data by sending scamper probes continuously to destination IP addresses. Destinations are selected randomly from each routed IPv4 /24 prefix on the Internet such that a random address in each prefix is probed approximately every 48 hours (one probing cycle). A single monitor won't probe all prefixes, but the prefixes it does probe will be randomly distributed, which gives a good sample cross section of the address space. As each probe travels from the monitor to its final destination, it passes through several IP addresses (ie, routers) which are owned by different autonomous systems (ASes).
How This Graph was Created
(This applies to all the dispersion graphs.)Data Processing
We first take the IP addresses found in each path and look up its corresponding AS, creating a set of AS paths. We use heuristics to infer any unknown values in the IP and AS paths. First, any range of unknown ASes whose previous and following hops have the same value are all assumed to be within the same AS.For example:
10 ?? ?? ?? 10becomes
10 10 10 10 10If there exists only one other known value between two neighboring values, the unknown hop is assigned that value. This can often happen when a router gives inconsistent responses, leaving an unknown hop some times and returning valid data at other times.
For example, say there are only three paths:
10 20 30 40 50
10 20 30 42 52
10 ?? 30 45 55
From this, we infer the unknown hop in the third path, and end up with:
10 20 30 40 50
10 20 30 42 52
10 20 30 45 55