Archipelago Monitor Statistics

Archipelago (Ark): CAIDA's active measurement infrastructure serving the network research community since 2007.
Statistical information for the topology traces taken by this individual Ark monitor is displayed below. See the main statistics page for the full list of monitors
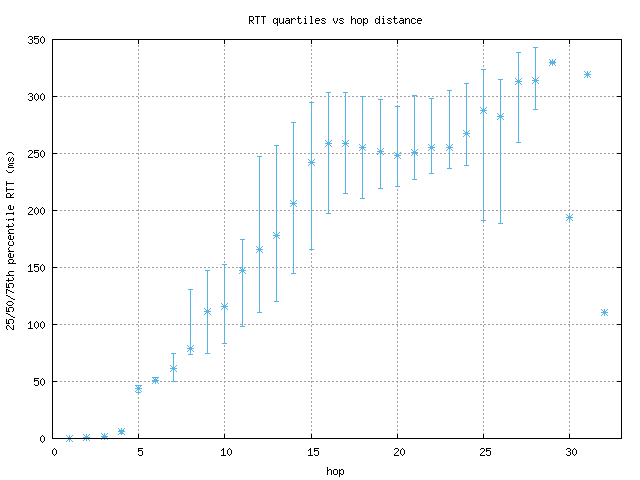
RTT quartiles vs hop distance
Use the following link to download the data used to render this graph in ASCII, comma-separated values format here: (
CSV output)
Description
This graph shows the quartiles (25th, 50th, and 75th
percentiles) of round-trip times (RTTs) found at each hop in a trace. This
includes all probes, even ones that did not reach their destination. The
y-axis cuts off values over 450ms, because of the occasional high-RTT
result which skews the graph.
Motivation
By viewing the distribution of RTTs at each hop, we can gain a better sense
of topological issues that contribute to high network latency.
Background
The round trip time for a (IP level) hop is the time (in milliseconds) that
it takes for a packet to be sent from an Ark monitor to that hop and for
that hop's response to be received by the monitor. Non-responding hops are
ignored, and hops in a routing loop are removed.
Analysis
Typically, the first few hops are within the monitor's internal network and
are very close to 0. Then there is usually a hop where the RTT values
start to increase, and with each increasing hop, the range and median RTT
values incrementally increase. The larger hops actually have decreased
ranges of RTT values, because there are far fewer paths with that many hops
in them. When a single hop has a large jump in the lower value of RTT,
which no later hops go below, that typically indicates a slow (or heavily
loaded) link common to many paths.