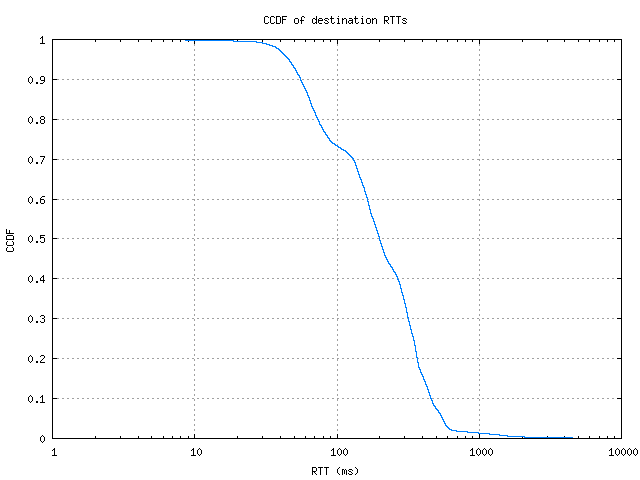
CCDF of destination RTTs
-
|
|---|
| percentile |
10th |
25th |
50th |
75th |
90th |
| RTT (ms) |
55.599 |
88.412 |
199.251 |
345.707 |
459.218 |
Use the following link to download the data used to render this graph in ASCII, comma-separated values format here: (
CSV output)
Description
This graph shows the complementary cumulative distribution function (CCDF)
of round-trip times (RTTs) to the destination host.
Motivation
By showing the distribution of RTT values to all responding destinations,
we can get a sense of how varied the speeds are for connecting to different
points in the Internet.
Background
The complementary cumulative distribution function shows the fraction of
collected data points that are greater than a given value. This is
backwards from how percentiles are given, as those show the percentage
lower than a given value. On this graph, you would find the 80th
percentile at the 0.2 Y value.
The round trip time of a probe is the time (in milliseconds) that it takes
for a packet to be sent from an Ark monitor to a destination and for that
destination's response to be received by the monitor. Therefore, no RTT
values are recorded when a probe does not reach a destination.
Analysis
When the CCDF graph has a nearly vertical dropoff point, that indicates
that RTT values fall within a narrow range. This tends to mean that
a bottleneck exists within the monitor's connectivity that dominates over
individual destination path variation. A more gradual curve, on the other
hand, indicates greater variability in the response times of destinations,
which tends to scale directly with the path length distribution.
![[CAIDA - Center for Applied Internet Data Analysis logo]](https://www.caida.org/images/caida_globe_faded.png "Go to CAIDA home page")