Archipelago Monitor Statistics

Archipelago (Ark): CAIDA's active measurement infrastructure serving the network research community since 2007.
Statistical information for the topology traces taken by this individual Ark monitor is displayed below. See the main statistics page for the full list of monitors
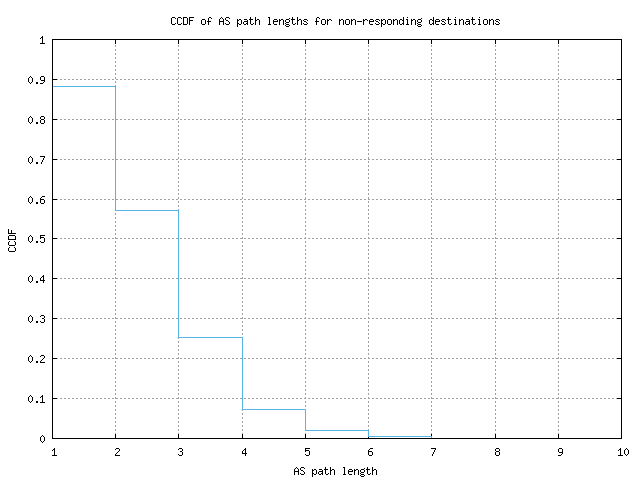
CCDF of AS path lengths for non-responding destinations
-
|
|---|
| percentile |
10th |
25th |
50th |
75th |
90th |
Max |
| AS path length |
2 |
2 |
3 |
3 |
4 |
9 |
Use the following link to download the data used to render this graph in ASCII, comma-separated values format here: (
CSV output)
Description
This graph shows the complementary cumulative distribution function (CCDF)
of AS path lengths (number of Autonomous Systems) for probes whose
destinations did not respond. The path length is instead the length to the
last responding hop's AS.
Motivation
Examining only traces which have responding destinations gives a more
accurate distribution of path lengths, but in typical usage there are
several times as many probes which do not have responses. However, the
traces without a responding destination still give us a lower bound on path
length distribution. For comparison, view the
AS path length distribution for responding
destinations.
Background
The complementary cumulative distribution function shows the fraction of
collected data points that are greater than a given value. This is
backwards from how percentiles are given, as those show the percentage
lower than a given value. On this graph, you would find the 80th
percentile at the 0.2 Y value. The AS path length is defined as the number
of ASes a probe transits to reach the destination from the Ark monitor.
These values are only used when a response has been received from the
destination. In other words, incomplete paths are ignored for the purposes
of determining AS path length.
Analysis
Because most AS path lengths fall within a relatively short range, the CCDF
graphs will tend to have a sharp drop off around the median. A lower
median value of AS path length likely indicates that a monitor is closer to
tier 1 or tier 2 providers, as it doesn't have to go through many ASes to
reach its destinations.
