Archipelago Monitor Statistics

Archipelago (Ark): CAIDA's active measurement infrastructure serving the network research community since 2007.
Statistical information for the topology traces taken by this individual Ark monitor is displayed below. See the main statistics page for the full list of monitors
cbg-uk
University of Cambridge
Cambridge, UK (8)
IPv4 data used (switch to IPv6)
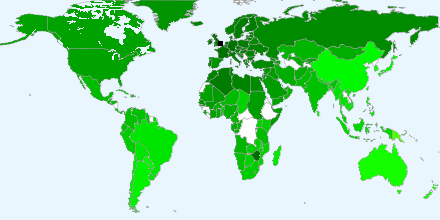
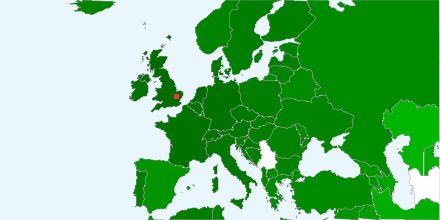
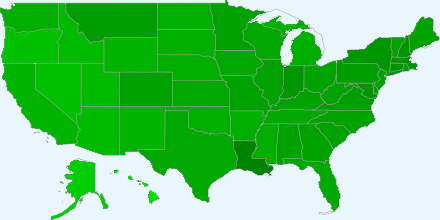
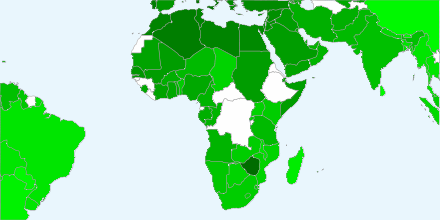
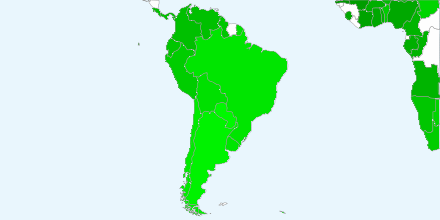
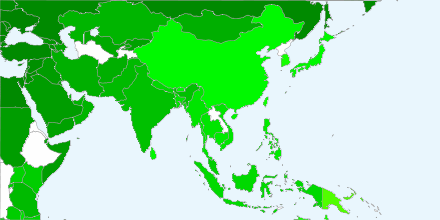
Median RTT per country and US state
Use the following link to download the data used to render this graph in ASCII, comma-separated values format here: (
CSV output)
Description
These graphs show the median round-trip times (RTTs) from the probing
monitor to various countries (and US states). The
country/state is obtained via NetAcuity for each hop's IP address.
All RTTs to that country/state are collected and the median is calculated
and assigned a color (with a maximum displayed value of 1000ms). The
location of the monitor is indicated by a black box on the maps.
Motivation
By looking at the country/state level differences in RTT, we can see how
political boundaries can contribute to changes in packet transmission
speed.
Background
The round trip time for a (IP level) hop is the time (in milliseconds) that
it takes for a packet to be sent from an Ark monitor to that hop and for
that hop's response to be received by the monitor. Non-responding hops are
ignored, and hops in a routing loop are removed.
Analysis
In general, one will expect to have the lowest median RTTs in the country
that hosts the Ark monitor, with RTTs increasing slowly with geographic
distance. However, some countries will have significantly higher median
RTTs, which indicates that the slower speed is due to infrastructural
issues. If these only occur transiently, they point towards
a misconfiguration or temporary failure instead of a systemically slower
network.