Internet and Intranet Measurement and Service Analysis
Sigmund W. Handelman and Stephen Stibler
Electronic Commerce Research
IBM T.J. Watson Research Center
30 Saw Mill River Road
Hawthorne, NY 10532
swhandel@us.ibm.com, 1-914-784-7626
stibler@us.ibm.com, 1-914-784-7191
Abstract
The Realtime Traffic Flow Measurement (RTFM) Working Group of the Internet Engineering Task Force (IETF) has proposed a standard method for collecting and reporting network traffic data. This paper discusses the working group proposal and provides some examples of its value in tracking application usage on the intranet at the authors’ workplace. Methods discussed in this paper can be used to plan for and help with the deployment of electronic commerce applications and services.
Introduction
How much traffic is flowing past a given point in the network? Where is it going? Where is it coming from? What services are being used? Can we create a better path to get the traffic to its destination? Is the network behaving as we expect? Is there an intruder trying to access resources? These are all questions to which we would like to know the answers.
These questions illustrate a marked need for the collection and analysis of data about the flow of traffic on our networks. Potential uses include network and server load measurement and capacity planning, attribution of network usage to individual users or sets of users, and problem detection and analysis. The Realtime Traffic Flow Measurement Working Group of the Internet Engineering Task Force has proposed a standard method for collecting and reporting such information[
][
]. We should use and extend these measurements to better understand and improve our networks and their operation.
Historic Background
The current work is an outgrowth of that begun by the Internet Accounting Working Group of the IETF. The main products of this working group were an "Internet Accounting: Background" document RFC 1272[
] and the foundation for an accounting architecture document. It is important to note that the intended meaning of the term "accounting", as used by the Internet Accounting Working Group, was "monitoring and reporting of network usage", and did not deal directly with charging for that usage. It was this concern over charging for Internet traffic which raised many objections to the original working group.Nevil Brownlee, of the University of Auckland in New Zealand, created an initial implementation of the traffic meter, based on the early documents. A major part of his motivation was in fairly allocating the cost of the overseas connection to the rest of the world amongst the various universities within New Zealand. His implementation, NeTraMet, was made freely available for general use starting in 1993.
Based on Brownlee’s implementation experiences, the Working Group was reformed in 1995 with the new name "Realtime Traffic Flow Measurement Working Group" to emphasize the goal of tracking and reporting information about network traffic and to deemphasize the potential economic aspects of the work. Now, after this reorganization has taken place, the economic implications of the work have received much more favorable attention and interest.
One of the main principles of the IETF is the belief in "rough consensus and running code"[
]. Before any proposal can become a standard, there must be at least two independent implementations. To meet this requirement, Stephen Stibler and Sigmund Handelman of IBM's T.J. Watson Research Center have created a second independent and interoperable implementation of the meter; which has been used for our experiments. This process of implementing the meter based upon the early proposed standards has resulted in many improvements and clarifications to the working group documents.There are now several hundred users of RTFM throughout the world. It is being used primarily as a tool to help manage local intranets, but is also receiving some wider usage, such as monitoring global traffic on Wide Area Networks.
The traffic meter has been used in many studies by Brownlee. Brownlee has also recently integrated the traffic meter as an analysis module for OCxMON; allowing the data collected by OCxMON, monitoring high speed networks, to be stored and retrieved within the RTFM framework[
].
We are looking at expanding our work to perform even higher speed measurement. Handelman is a member of the new Internet-2 Measurement Work Group. As Internet-2 develops we will look for opportunities to deploy the meter, using appropriate hardware, to measure and characterize Internet-2 traffic.
Architecture
RTFM consists of four main components: the Meter, Meter-Reader, Manager, and the Analysis Applications. The meter passively monitors the network segment(s) to which it is attached. It examines only the headers of each packet to determine whether or not that packet is to be counted in one of the flows of interest. The manager downloads rulesets to each meter, instructing the meters as to what packets are to be monitored. At periodic intervals, the meter-readers will retrieve aggregated data from the meters for later processing by the analysis applications.
The basic unit with which all of the components deal is the 'Traffic Flow'. A flow is identified by attributes, such as the source and destination adjacent, transport and peer addresses extracted from the packet headers. Through the use of masks, we may limit our inspection to any portions of these addresses. RTFM flows are, by default, considered to be bi-directional. The meter will associate packets flowing in both directions between the same endpoints with a single flow record. Data collected for these flows consists of the cumulative packet and byte counts for both the 'forward' and 'reverse' directions. The working group is planning for the collection of additional data in the form of 'extended attributes' for flows. These 'extended attributes' will provide more detailed performance data for the flows[
].There are several strengths of RTFM compared to other measurement methods. The first of these is immediate aggregation of data at the monitoring point. Rather than generating a large trace file, the meter condenses the data into compact flow records. This reduces the storage requirements at the meter and the network resources needed to transfer the data to the reader and analysis applications. A second, very important characteristic of the meter is the fact that it is programmable. The manager can download and activate new rulesets on the meter at any time. These rulesets allow the meter to collect data only on traffic of interest, at the desired level of detail. Early versions allowed only a single ruleset to be active at any time, but the architecture and implementations have been modified to allow multiple rulesets to operate simultaneously. Thus, the user will be able to collect general and/or long-term data with one ruleset, and more detailed data about specific flows with other rulesets.
Uses
The RTFM meter is being used in many places as an accounting tool, measuring the bandwidth used by various organizations. It has also been used to study the destination of traffic with the goal of better network design. This can influence the purchase and location of new links in congested networks to help bypass and relieve the congestion. On the security front, it has been suggested that profiles of "normal" network behavior could be created, and the analysis application could be alert for deviations from such patterns as an indication of potential network problems or intrusions. As more people become familiar with and use the RTFM meter even more applications will become apparent.
Experiences with the Meter at the IBM T.J. Watson Research Center
Several experiments have been performed in recent months, analyzing traffic patterns of networked groupware, to study usage patterns. We have obtained average as well as high and low data rates for traffic to and from the servers. We are examining aggregate data rates of 100’s of users to help determine the best usage of our network and to plan for the capacity needed to support future groupware deployment. At the same time, we are able to monitor the data flowing to and from firewalls, print servers, local WWW servers, etc.
The meter system described here has been tested on shared media such as Ethernet, Token Ring, Fast Ethernet, and FDDI. We have observed good performance for our meter on all of these and are looking for methods to attach to even faster media such as ATM. We have written tools to take the output of our meter and store it into databases. The meter implements an SNMP MIB (IETF Simple Network Management Protocol Management Information Base), and we have developed a program which reads the SNMP data from the meter, converts the IP addresses into host names, and produces a "Comma Separate Variable" (CSV) file, which can be imported and interpreted by Database and Spreadsheet programs. The flows can then be sorted, summed, and analyzed in many different ways.
The meter is useful for measuring the following aspects of application usage and determining the "health" of the intranet at our site:
1) Network bandwidth consumed by application sets.
2) Distribution of packet sizes used by the application sets; which when tied with bandwidth gives an indication of network efficiency.
3) Location of bottlenecks (using multiple meters). This is important for the deployment of future multimedia applications, which can consume large amounts of network resources.
4) Time analysis of networks, illustrating such occurrences as "crunch time" on Monday morning, and "slack time" on the weekends. (On some analyses we have found that nighttime usage can be very heavy, as cross-site backups take place.)
5) Analysis of the "burstyness" of a network.
6) Number of concurrent flows.
Description of Our Experiment
Measuring worldwide Internet traffic is a much harder problem today than in the recent past. One no longer knows all of the paths and interconnections which were easily comprehensible a few years ago. For these experiments, we turned to a less complex measurement sphere. We used our meter to measure service rates of intranet applications deployed at our laboratory, the IBM T.J. Watson Research Center. Extending this to Internet measurement would require positioning meters at multiple access or exchange points.
The IBM Research Division’s Watson Research Center has two main sites in Westchester County, New York; Yorktown Heights and Hawthorne. Over 2,500 research staff use the IBM groupware package, Lotus Notes, for e-mail and other distributed collaborative services. The use of Lotus Notes as one of the key applications in an intranet is discussed in [
].The Notes Service is hosted on a server farm at an IBM Data Center in Poughkeepsie, New York. The network environment of local subnets in the Watson (Yorktown plus Hawthorne) LAN connects to Poughkeepsie through a direct frame relay path between Yorktown Heights and Poughkeepsie.
Our meter is attached to the network at the consolidation point for this Watson-Poughkeepsie trunk. All the traffic flowing between Watson and the server farm in Poughkeepsie is available for monitoring by the meter at this point.
Measuring Services at the IBM T.J.Watson Research Center
A modern workstation connected to the local area network at our site requires several services which must be available 24 hours a day. Examples include: mail servers to handle inbound and outbound e-mail, print servers to deliver data to printers, domain name servers and gateways to handle addressing both on our intranet and the Internet, firewalls and gateways to control data flowing to and from the Internet, and Web servers for various information needs. In the "well connected" laboratory all of these services are part of the necessary background information processing that must be available. The meter can recognize services by identifying port numbers of applications and/or network addresses of the application servers.
Deploying the Meter in the Experiment
Prior to starting this measurement experiment at Watson we consulted with the Network Operations staff to determine the correct placement of the Meter such that it would observe the desired traffic.
Once a meter is physically installed and activated, additional work must be done to configure it to capture the data of interest. This is best done through an iterative process where the rulesets installed on the meter are gradually refined to obtain optimum results. This is a balance between recording the required level of detail while at the same time allowing aggregation to be performed at the meter. The steps can be undertaken as follows:
1) Setup the meter to record the total volume of traffic. It is important to determine the total traffic on the segment that you are measuring. You may see that the network is running free and clear and thus is not a source of problems for your application. On the other hand the network segment itself may be the source of any observed performance problems.
2) Run a rule set to record the traffic with the attribute of either the port number or server address of the application you want to measure.
3) Record the results over some measurement period.
4) Refine (2) and repeat
5) The output of the meter can now be analyzed for patterns, minima, maxima, etc.
Running the Experiment
The goal of our experiment was to collect data and analyze usage patterns and network load for a portion of our intranet. The basic approach was to place our meter at the access point for a set of servers and to study the traffic to and from these servers. We are now developing and running rulesets to analyze this traffic.
The very first ruleset installed on the system was the most basic ruleset possible. It merely records the total volume of IP traffic seen by the meter. For each IP packet observed by the meter, the packet and byte counters for the associated flow are incremented. The source and destination IP addresses are never examined at all, so what we obtain is a running count of the total number of packets and bytes observed at the metering point.
The second ruleset installed on the meter was used for initial load analysis on the servers in the pool of interest. The first part of this ruleset checks the source IP address to see if it matches that of one of the servers to be monitored. If the match succeeds, the packet is counted as a "forward" packet. (We have arbitrarily designated packets originating at the servers as being "forward" packets.) If the initial match fails, the packet matching engine swaps the source and destination addresses and attempts the match once again. If the packet matches on this second attempt, then the packet is counted as a "reverse" packet (i.e. traveling to the server, as opposed to traveling from the server). In either case, the "source" address is stored
to designate the particular flow, with the summed forward and reverse counts providing a measure of the total traffic to and from each server.The third ruleset nearly duplicates the second. The matching portion is exactly the same. The only difference is that in addition to storing the full IP address of the server, it also stores the first three bytes of the destination IP address. This provides us with a matrix of traffic between each server and each local subnet.
Once the desired rulesets were loaded and activated on the meter, the reader program was started on another system to collect the flow records from the meter at periodic intervals (in our case, every fifteen minutes). The data for each of the three rulesets were retrieved from the meter - flow addresses, forward and reverse packet and byte counts, and time stamps.
Results of the Experiment
A note on the duration of the experiment: The data presented here was gathered over a period of one week starting 12:01 AM on Sunday, September 20, 1998. The sampling was done at 15 minute intervals to yield 96 data points per flow day. The labels on the Y axes in the figures are therefore byte counts over each 15 minute period. The segment we were metering was an IBM 16 Megabit/second Token Ring. The maximal data rate of the Token Ring is approximately 2 Megabytes/second. Thus, over a 15 minute period, the maximum data that can be carried by the Token Ring is 1.8 GBytes.
Figure 1 displays the total IP traffic observed by the meter. The daily pattern is quite evident.
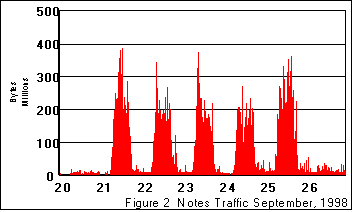
Figure 2 shows the total traffic to and from the servers of interest. It shows a similar daily pattern with a lower weekday volume of traffic and a much lower weekend traffic volume than what was seen in Figure 1. We also note that the nighttime traffic spikes are absent from this graph, as most of the traffic to and from these servers is user initiated, and there is little automatic nightly activity.
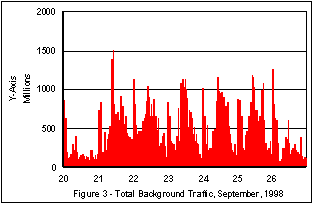
Figure 3 subtracts the Lotus Notes traffic from the total background traffic. One can see that it is much more irregular than the Lotus Notes traffic. The average non-Notes traffic was 379,000,000 bytes (over all of the 15 minute measurements); which is approximately 21% of the capacity of the monitered token-ring.
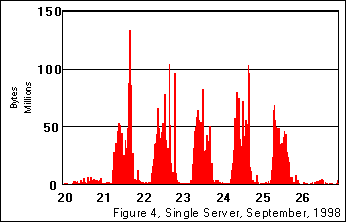
We next examine Figure 4; which presents the total traffic to just one of the servers. It exhibits a similar pattern to that seen in Figure 2..
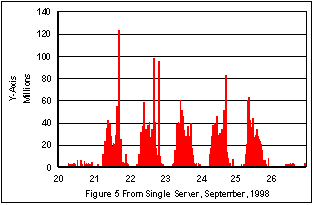
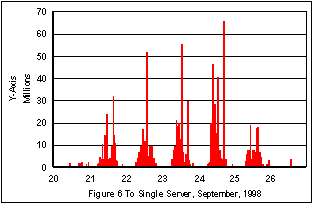
The next two figures, 5 and 6, show the traffic from and to the single server of figure 4.
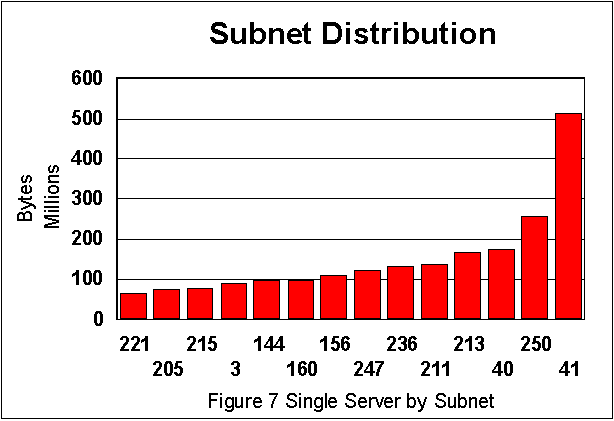
Finally, we show that we can resolve traffic to individual subnet usage by presenting a sorted list, by network utilization, of the subnets in the Watson environment. This traffic collection was done over 5 days, starting on September 28. The distribution of traffic over the experiment suggests that a small number of users account for a large fraction of the traffic.
Analysis of Data
The analysis of the data collected in this experiment is based upon discussions of network capacity in McCabe[
]. First we see that the maximum observed aggregate IP data rate on the line was equal to 1,877,171 bytes per second at 10:58 AM on Monday, September 21; which is 93% of the capacity of the token-ring being monitored. During this interval congestion and delay were evident. The minimum data rate observed was 52,630 bytes/second illustrating the presence of relative idle time on this link. The maximum Notes data rate was 426,157 bytes per second at 1:48 PM also on September 21 (but at a time that the ring was not running at maximum load). This is 21% of the capacity of the Token Ring. We took the data points of Figures 2 and 3 and ran a correlation evaluation between these two series, obtaining a coefficient of 0.644, indicating a medium correlation between the use of the Lotus Notes servers with other services.
An analysis of the sustained data rate of the total traffic over the main working hours at Watson, 8:30AM-5:00PM shows a total sustained data rate over of
550,000 bytes/second. The Notes rate was over 120,000 bytes/second over the same time period. One can see that the rates of total traffic and Notes traffic rise above the sustained level in each case. The traffic in both cases is sustained for several time periods at double the daily rate, with peaks 3 and 4 times greater.Figures 5 and Figure 6 show an interesting trend during the week of measurement. Overall, the amount of data from the server is approximately twice the amount of data sent to the server. Another trend can be implied from these two figures. Figure 5 is a measure of e-mail and documents sent by the servers, while Figure 6 shows the e-mail and documents sent by the users. The amount of e-mail sent by the servers declines on a daily basis during the week, while the amount of e-mail sent by the clients to the servers rises. Can one infer that the Researchers read more during the beginning of the week, and than switch to a a writing mode later in the week?
The data implies several additional facts. The current sustained traffic has peaks which reach the limit of the line where we did the measurement. When this limit is reached congestion and delay occur in the applications using this line, including Lotus Notes which we have been measuring. If the sustained traffic rate should grow, we predict that more "peaks" will be accompanied by even greater congestion and delay.
Conclusion
We have shown that the RTFM architecture provides a method of obtaining both general and detailed information about application network traffic flows on intranets. This information highlights usage patterns and traffic peaks and potential congestion and delay. These patterns include:
1) Finding the times when the line is fully occupied by background traffic.
2) Indentifying usage patterns on day to day traffic
3) Identify maximum usage of the Lotus Services, which points to server utilization.
The working group is advancing the architecture along the Internet standards track. We urge anyone interested in this area, either as developers or end users to participate in the efforts of the working group.
Acknowledgments
We thank the members of the Networking Support Infrastructure Group at the IBM T.J. Watson Research Center for helping us setup the experiment described in this paper. In particular we would like to thank Herb Lee and Lee Cashman for their support in starting the experiment and "hosting" the meter in the Networking Annex at the Yorktown Heights building. We also thank Herb Lee for reviewing this document.
We would also like to thank the other members of the RTFM working group, in particular Nevil Brownlee of the University of Auckland.
References
Resources on the World Wide Web
Information on RTFM can be found on the web sites
http://www.ietf.org/html.charters/OLD/rtfm-charter
http://www.auckland.ac.nz/net/Internet/rtfm
which also point to the RFC’s and Internet Drafts of the group and additional background information. At the current time the Working Group is focusing its attention on the performance attributes mentioned above and a simplification of the Rule Set specification. Information on the RTFM mailing list can also be obtained through these sites.
Information on NeTraMet can be found on the web site
http://www.auckland.ac.nz/net/Accounting/ntm.Release.note
Footnotes