Packets of the University of Auckland DNS traffic were collected starting Monday 2003-09-15 05:38 UTC for 64.5 hours (from Monday, September 15, 17:38 till Thursday, September 18, 10:08 local time). Our sample contains 111430 queries to root servers from 19 U. of Auckland hosts, and 257455 queries to gTLD servers from 18 hosts. The average query rates (per minute) are 28.8 to roots and 66.5 to gTLDs.
Figure 1 shows the cumulative distribution function of number of clients.

Fig. 1. Cumulative distribution function of number of
clients.
We define as high level users (HLU) the UA hosts that sent more than 10,000 mesages to either root servers or to gTLD servers.
HLU for roots (3 out of 19 name servers)
| measurement data | inside information | ||||
|---|---|---|---|---|---|
| # of queries (%) | ip address | host name | software | comments | |
| 38212 (34.3) | 35.35.216.130 | kronos1.cs.auckland.ac.nz | bind 9.2.1 | cs local resolver | |
| 33570 (30.1) | 135.35.216.130 | kronos2.cs.auckland.ac.nz | bind 9.2.1 | cs local resolver | |
| 22973 (20.6) | 1.1.216.130 | dns2.auckland.ac.nz | bind 9.2.2 | ua main local resolver | |
HLU for gTLDs (5 out of 18 name servers)
| # of queries | IP address | Host name |
|---|---|---|
| 128399 | 1.1.216.130 | dns2.auckland.ac.nz |
| 31177 | 4.1.216.130 | mailhost2.auckland.ac.nz |
| 29808 | 4.191.216.130 | mailhost2.auckland.ac.nz |
| 22097 | 1.191.216.130 | net.auckland.ac.nz |
| 19772 | 2.1.216.130 | dns1.auckland.ac.nz |
Figure 2 (a,b) shows the rate of queries (measured in 5 minutes intervals) vs. time. These plots are similar to Nevil's NeTraMet plots and can be directly compared witd his data.
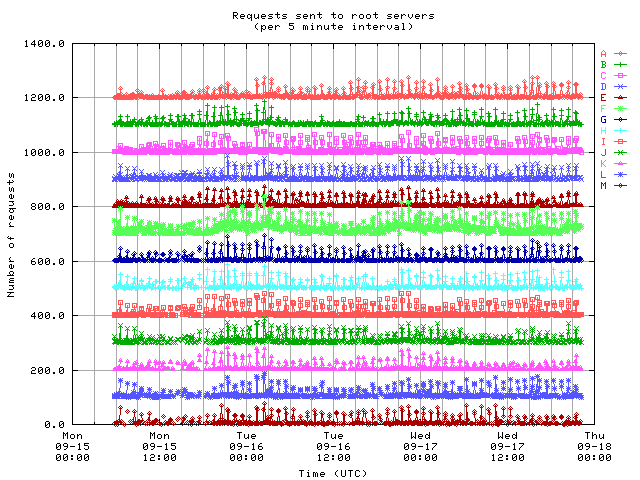
Fig. 2a. Number of queries to roots per 5 minute
intervals. Each line is shifted up by 100.
Queries to roots clearly exhibit a periodic "comb-like" structure with a
peak approximately in the middle of every hour. Closer check showed that this
pattern is entirely due to two of the three HLUs: kronos1 and kronos2.
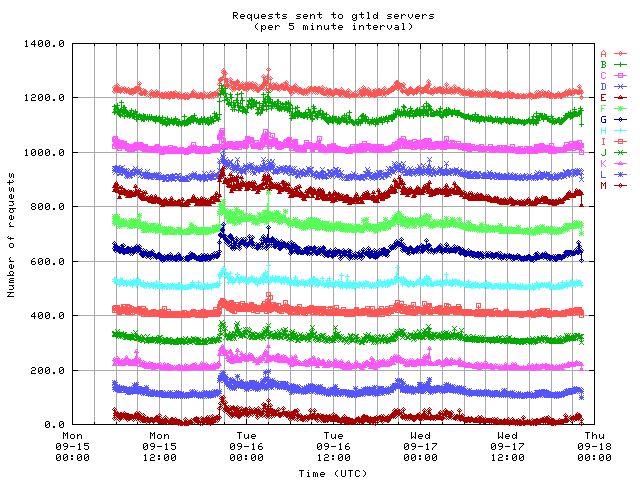
Fig. 2b. Number of queries to gTLDs per 5 minute
intervals. Each line is shifted up by 100.
There is no evidence of periodic "comb-like" structure in queries to gTLD.
Query rate to all gTLDS increases simultaneously at around 21:00
UTC on 09/15. Other simultaneous peaks are at 3:00 UTC and at 21:00 UTC on
09/16. Note that 21:00 UTC corresponds to 9:00 of local time. The peak might
be due to the beginning of a work day in New Zealand.
(Note: UA is in New Zealand and at the moment of observation there was an anycast F-root server nearby. B, L are in Southern California; E is in Northern California; A, C, D, G, H, J are on East Coast; I and K are in Europe; M is in Japan.)
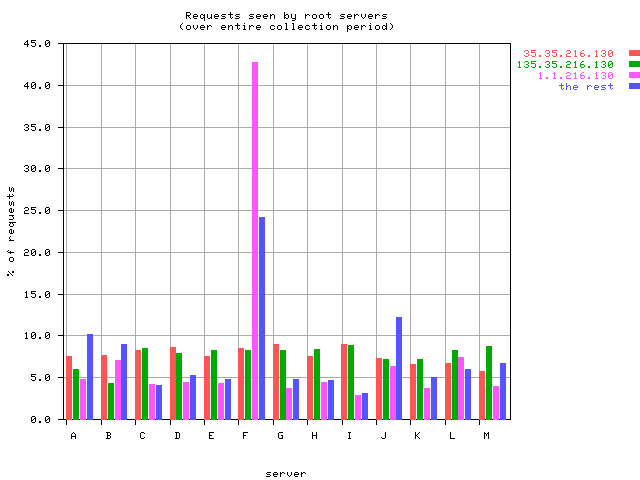
Fig. 3. Distribution of queries among root servers.
Figure 3 shows distribution of queries to root servers for three top users
(accounting for 85% of all UA queries), and for the rest of UA name servers
(15% of all queries). The two highest users (kronos1 and kronos2, local
resolvers for Computer Science Department that generate 34% and 30% of the
total UA DNS traffic, correspondingly) distribute their requests among all 13
root servers in a nearly uniform manner. The tdird highest user (dns2, main
local resolver for the whole University, generates 21% of the total trafiic)
prefers F-root (as expected), but still sends more than 50% of its queries to
other roots. The remaining 16 UA nameservers send less than 25% of their
queries to F-root. The next two popular root servers for them are A and J -
which may indicate Windows behavior (check witd Duane).
All three HLU of roots run the latest versions of BIND. In order to understand the differences in their root selecting patterns, we considered the distributions of response times from roots to each host (Figure 4).
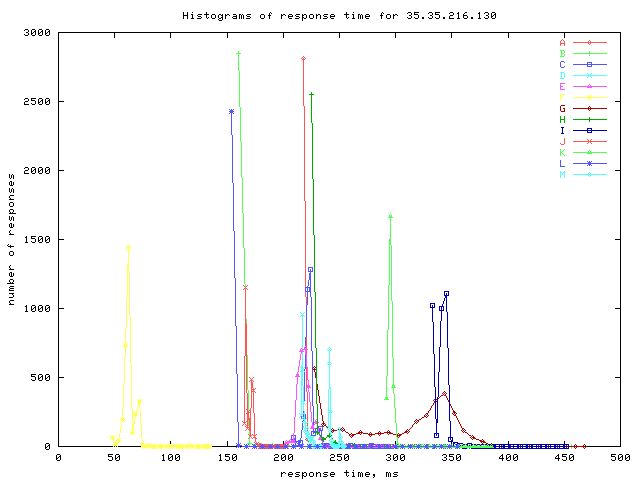 a) kronos1 |
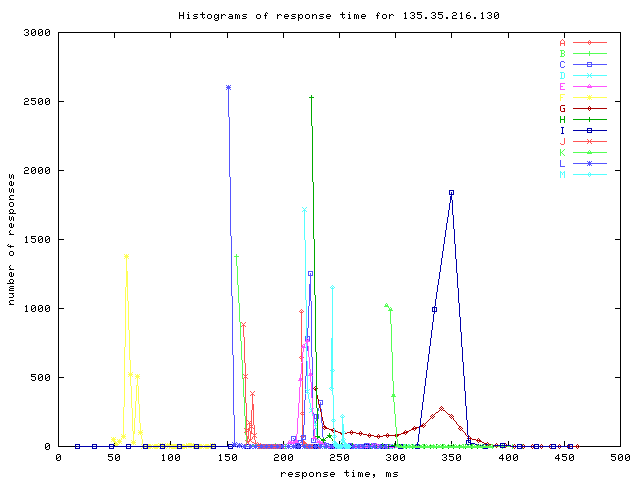 b) kronos2 |
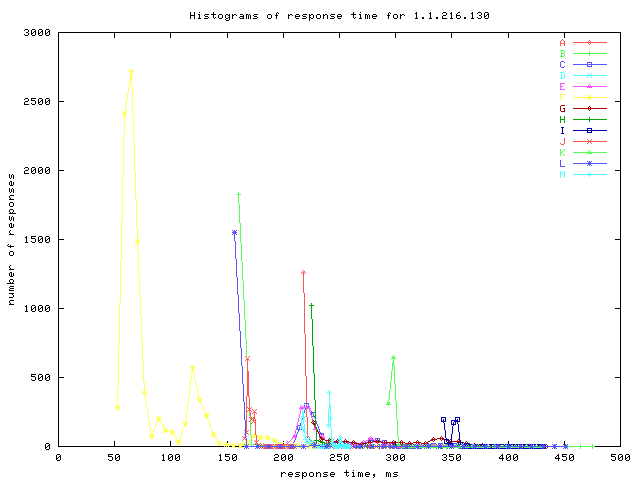 c) dns2 |
The general pattern is very similar in all three cases. Based on the response times, root servers can be grouped in five groups:
- F-root - consistently has shorter response times than any other root server (as expected);
- L, B, J;
- A, C, D, E, H, M;
- G - the latencies are spread out in a strange bimodal pattern;
- K and I - two root servers in Europe have longest response times.
The dns2 host appears to select root servers based on response time (as expected for BIND algoritdm): F is its most preferred root (43% of queries), B, L, and J follow (about 6-7% of queries to each of tdose), while the remaining nine root servers receive about 4% of queries each. However, kronos1 and kronos2 resolvers that also run BIND send their queries to all roots in a more or less uniform pattern seemingly ignoring the response times.
Assuming that the distributions of response times are similar for all UA nameservers, we see that the relatively frequent choice of A root by the remaining 16 nameservers also is not based on its performance.
We have looked at types of queries sent by the UA nameservers. The results are summarized in the Table below.
| query type | |||||||
|---|---|---|---|---|---|---|---|
| hosts | A (1) | PTR (12) | MX (15) | AAAA (28) | other | total | bad |
| kronos1 | 724 | 35884 | 409 | 1185 | 10 | 38212 | 0 |
| kronos2 | 413 | 31815 | 306 | 1026 | 10 | 33570 | 0 |
| dns2 | 17826 | 337 | 27 | 1062 | 2797 | 22049 | 924 (4%) |
| all other | 7090 | 4645 | 1374 | 1202 | 2207 | 16518 | 157 (<1%) |
The Table provides more questions than answers.
- Why are dns2 and kronos* functionally so different?
- Why does dns2 send so many A queries to roots (an A query every 12-15 seconds)? In other words, why does it forget TLDs so quickly?
- What is the cause of so many PTR queries by kronos*? Why is the bulk of
these queries sent with a 1 hour period?
Note from Nevil (insider information): I've gone through our BIND config (for dns2), it's very close to just relying on BIND's default behaviour right through. The kronos* servers are - I believe - much the same, except that they'll specify dns2 as a forwarder.
- Is it possible that the root selection is determined by functionality rather than by response time or by name resolving software?
- How can root server placement be optimized if response time plays little role in root server selection (in BIND, and even less so in Windows)?
Last minute update - 40 hours of DNS traffic collected on November 3 and 4, 2003.
- The rate of queries to root servers is about 11 queries per minute, which is three times lower than in September.
- kronos1 and kronos2 are not HLUs anymore: they sent only about 400 queries each. In this data set dns2 is the highest user with 15098 queries (52% of the total traffic).
- As before, about 4% of dns2 queries have a wrong type (0 or > 255).
- As before, DNS traffic generated bu dns2 is dominated by A queries (80%). The rate of A queries from this host also has not changed: one A query every 12 seconds.
- The selection of root servers is exactly as expected:

Acknowledgment. Many thanks to Ken Keys for his graphic scripts.