Archipelago Monitor Statistics

Archipelago (Ark): CAIDA's active measurement infrastructure serving the network research community since 2007.
Statistical information for the topology traces taken by this individual Ark monitor is displayed below. See the main statistics page for the full list of monitors


 To main statistics page
| Time range | 2026-10-16 12:18 to 15:43 UTC (3 hours) (1 day ago) |
| Total traces | 31500 |
| Traces with responding destinations | 3480 (11.048%) |
| ASes with responding destinations | 779 (16.961% out of 4593) |
| Prefixes with responding destinations | 2580 (13.794% out of 18704) |
| Protocol version | v4 (switch to v6) |
Generated for cycle 16016 on 2026-10-17 11:07 UTC
All images can be clicked on for more detailed information.
Median RTT per country and US state
Mapping RTT by political boundaries can reveal where high latency issues are located.
Path Dispersion
The paths taken by different traces show where the majority of a monitor's traffic travels.
-
AS Path Dispersion (by AS Hop)
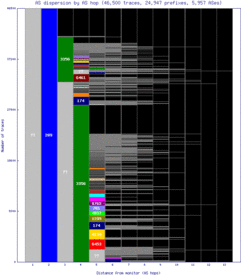 AS connectivity near monitor
-
AS Path Dispersion (by IP Hop)
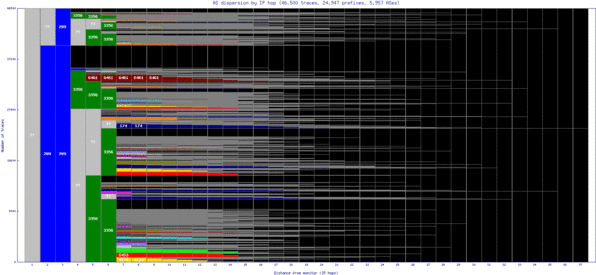 AS connectivity near monitor (with IP hop distances preserved)
-
IP Path Dispersion (by IP Hop)
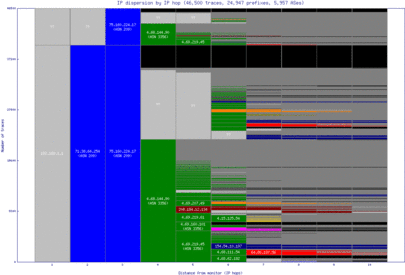 IP connectivity near monitor
Path Length Distributions
Path length distributions show, on aggregate, how well-connected a monitor is to the rest of the Internet.
-
CCDF of IP path lengths for responding destinations
percentile 10th 25th 50th 75th 90th Max IP path length 11 13 16 18 21 34 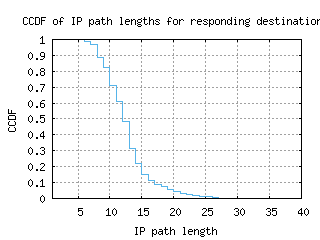
-
CCDF of AS path lengths for responding destinations
percentile 10th 25th 50th 75th 90th Max AS path length 3 5 6 7 8 11 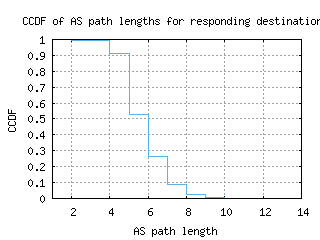
-
CCDF of IP path lengths for non-responding destinations
percentile 10th 25th 50th 75th 90th Max IP path length 7 9 12 15 18 42 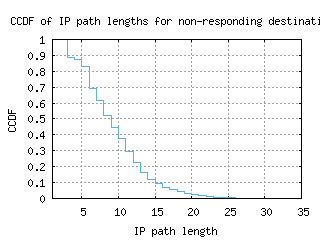
-
CCDF of AS path lengths for non-responding destinations
percentile 10th 25th 50th 75th 90th Max AS path length 3 4 5 6 7 12 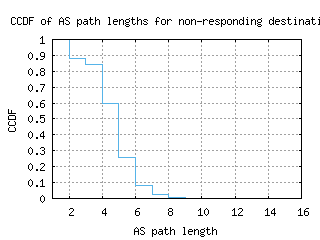
-
CCDF of destination RTTs
percentile 10th 25th 50th 75th 90th RTT (ms) 55.210 82.290 157.873 189.418 233.522 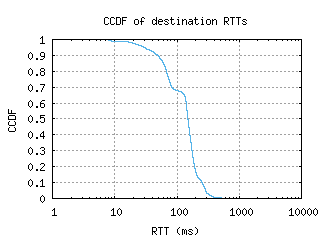
-
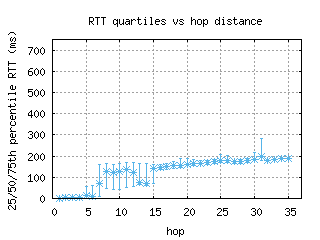
RTT quartiles vs hop distance
-
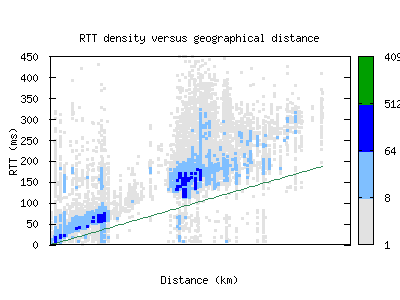
RTT density versus geographical distance
-
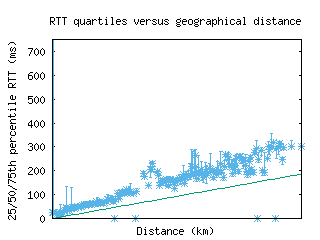
RTT quartiles versus geographical distance