Archipelago Monitor Statistics

Archipelago (Ark): CAIDA's active measurement infrastructure serving the network research community since 2007.
Statistical information for the topology traces taken by this individual Ark monitor is displayed below. See the main statistics page for the full list of monitors
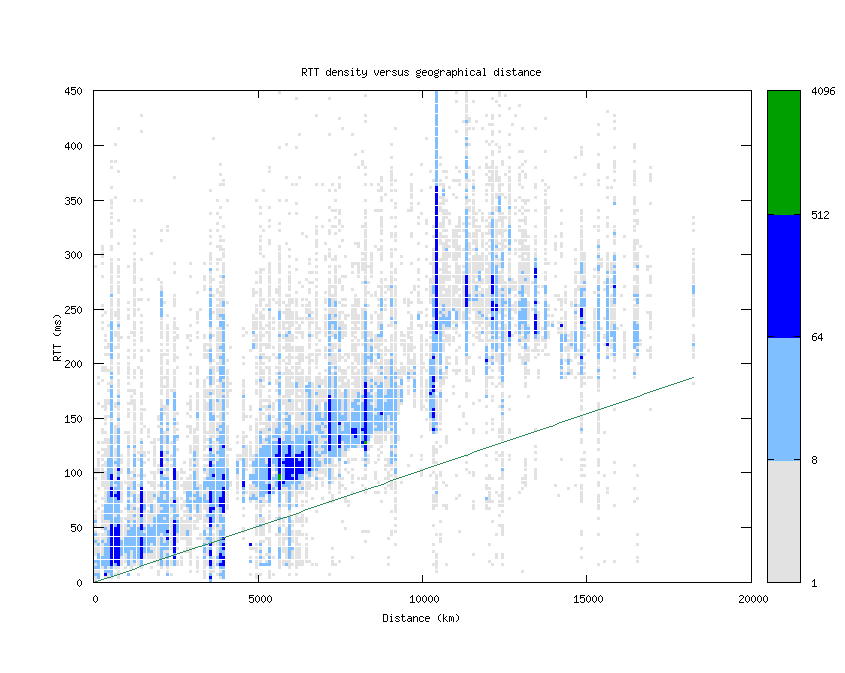
RTT density versus geographical distance
Use the following link to download the data used to render this graph in ASCII, comma-separated values format here: (
CSV output)
Description
This graph shows the density of round-trip times (RTTs) versus geographical
distance from the probe source. The distance is calculated by looking up
every hop's latitude and longitude via NetAcuity and comparing with the
location of the source. The RTTs and distances are binned (to every 3 ms
and 100 km, respectively) and counted, with the color determined by the
number of hops seen with that combination of RTT and distance. The
straight green line represents the theoretical best RTT (given the speed of
light in fiber) for a distance. The y-axis stops at 450ms, because of the
occasional high-RTT result which skews the graph.
Motivation
By comparing RTT values with distance, we can see how much that distance
dominates the speed at which packets travel. The density plot gives
a visual indication of how common different RTTs are.
Background
The round trip time for a (IP level) hop is the time (in milliseconds) that
it takes for a packet to be sent from an Ark monitor to that hop and for
that hop's response to be received by the monitor. Non-responding hops are
ignored, and hops in a routing loop are removed.
Analysis
In general, a monitor with high-speed connectivity to the rest of the
Internet will have a bottom-heavy grouping of RTTs that rise linearly with
distance. In a monitor whose connections to the Internet are slower, the
RTT values are less correlated with distance and thus don't seem to form as
obvious a line. It's natural to have high RTTs for a geographically close
hop, given the random selection of destinations, but the unusually low RTTs
for distant hops (particularly those below the speed-of-light line) are
almost certainly errors due to mistaken geolocation.