Archipelago Monitor Statistics

Archipelago (Ark): CAIDA's active measurement infrastructure serving the network research community since 2007.
Statistical information for the topology traces taken by this individual Ark monitor is displayed below. See the main statistics page for the full list of monitors
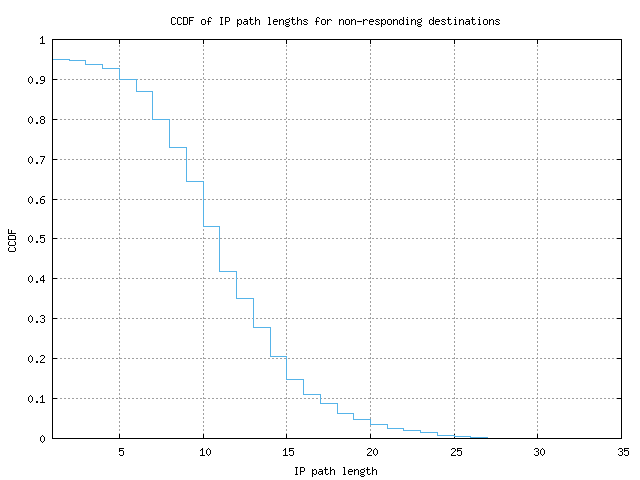
CCDF of IP path lengths for non-responding destinations
-
|
|---|
| percentile |
10th |
25th |
50th |
75th |
90th |
Max |
| IP path length |
6 |
8 |
11 |
14 |
17 |
31 |
Use the following link to download the data used to render this graph in ASCII, comma-separated values format here: (
CSV output)
Description
This graph shows the complementary cumulative distribution function (CCDF)
of path lengths (number of hops) for probes whose destinations did not
respond. The path length is instead the length to the last responding hop.
Motivation
Examining only traces which have responding destinations gives a more
accurate distribution of path lengths, but in typical usage there are
several times as many probes which do not have responses. However, the
traces without a responding destination still give us a lower bound on path
length distribution. For comparison, view the
IP path length distribution for responding
destinations.
Background
The complementary cumulative distribution function shows the fraction of
collected data points that are greater than a given value. This is
backwards from how percentiles are given, as those show the percentage
lower than a given value. On this graph, you would find the 80th
percentile at the 0.2 Y value.
The path length is defined as the number of IP hops required to reach the
destination from the Ark monitor. This includes any routing loops that
occur during the probing. These values are only used when a response has
been received from the destination. In other words, incomplete paths are
ignored for the purposes of determining path length.
Analysis
The shape of the path length CCDF typically doesn't very much from monitor
to monitor, as the distribution of path lengths to randomly selected set of
destinations is mostly determined by the 'core' of the Internet. Routing
loops or large internal networks (on the monitor's side) can shift the
path length values higher, but the range doesn't vary dramatically. If
a monitor's path length CCDF looks suddenly very different from other
monitors', it's quite possible that there's a configuration problem in the
local network.
