Cybersecurity: Leveraging the Science and Technology of Internet Mapping for Homeland Security - Proposal
An abbreviated version of the original proposal is shown below. For the full proposal, please see the Cybersecurity proposal in PDF.
Principal Investigator: kc claffy
Funding source: N66001-08-C-2029 Period of performance: March 21, 2008 - June 30, 2012.
1 Proposal
The Regents of the University of California; University of California, San Diego on the behalf of San Diego Supercomputer Center under the program Cooperative Association for Internet Data Analysis (CAIDA) offer the technical proposal that has as its main deliverable, periodic updates for router- and AS-level Internet topologies integrated into the dual-layer router+AS-level topologies, and richly annotated with AS business relationships, geographic, latency, etc., attributes. To achieve this main task, the project will also deliver a new Internet topology data acquisition infrastructure and Internet topology data processing, analysis, annotation, and generations software. We describe the details of our technical approach in Section 3.
2 Performance Goals
The proposed work directly targets the goals and deliverables outlined in the BAA, in particular in TTA5: Internet Tomography/Topology. The resulting technologies and data will increase our ability to understand the structure, dynamics, and vulnerabilities of Internet topology that includes U.S. critical infrastructure.
3 Detailed Technical Approach
Our main deliverable will be periodic updates of richly annotated dual router+AS-level topologies of Internet infrastructure. To achieve this goal we will use a tightly integrated methodology consisting of the following building blocks, described in detail in the following section.
-
Data acquisition and analysis.
- scamper data collection (IP-level) on archipelago. Use our traceroute-based scamper measurement tool on archipelago, our new active measurement platform, to continuously collect raw traceroute data.
- Alias resolution (IP®router-level). Resolve IP interface addresses observed in scamper topology measurements to common routers using state-of-the-art alias resolution techniques. Provide an evaluation of the relative accuracy of available techniques.
- AS mapping (IP®AS-level). Map IP-links (pairs of observed adjacent IP interfaces) to AS-links (pairs of BGP-peering ASes) via BGP tables using the CAIDA-developed ASFinder tool.
- AS+router-level merge. Merge the router-level topologies from step 1b and AS-level topologies from step 1c into integrated dual-layer AS+router-level topologies using our powerful dK-series framework.
- Topology characteristics. Release software that analyzes the most important and definitive topology characteristics, including those indicative of vulnerability to various forms of attacks.
- IPv6 measurements prototype. Prototype IPv6 topology data collection using scamper and archipelago
-
Topology annotations and visualizations.
- AS relationships and taxonomy. Annotate the AS-level topologies obtained at step 1c with AS business relationships and AS types.
- Geolocation. Annotate merged router+AS-level topologies with node geolocations, using the best available techniques and our dK-series method.
- Latencies (optional). Annotate merged router+AS-level topologies with link latencies, using the best available traceroute data and the dK-series method.
- Visualizations. Develop new techniques and adapt existing ones, e.g., Walrus, to visualize our richly annotated topologies.
-
Analysis.
- Topology comparisons. Using the set of important metrics defined in step 1e, compare the archipelago-, skitter-, and DIMES-extracted topologies and relate the differences to specifics of the associated datasets.
- AS-ranking++ Improve and enrich our AS-ranking suite, asrank.caida.org
- Topology generator. Release a topology generator producing annotated AS+router-level topologies for analyses and "what-if" experiments.
- Telco hotel data integration. If the telco hotel data mentioned in the BAA is made available, integrate the knowledge into the AS-level map.
We describe these building blocks in detail next, but emphasize that the greatest challenge is automation of and interfaces between these architectural components.
3.1 Archipelago (step 1a)
The design goals of our new measurement architecture are flexibility, extensibility, and fine-grained control over active measurement experiments. We achieve these goals using software design concepts that are quite different from those we used in our previous measurement infrastructure skitter. Our new architecture, Archipelago (or Ark), is framed around the fundamental activity of coordination of measurements across the infrastructure. Coordination allows the many pieces of the infrastructure to work together efficiently toward a common goal. Archipelago provides a coordination facility inspired by Gelernter's tuple-space based Linda coordination language. Archipelago extends Gelernter's model to support a globally distributed infrastructure that hosts heterogeneous measurements by a community of vetted users. Another distinct feature of our new topology measurement architecture is that by default we will not use predefined probe destination lists, which are prohibitively costly to keep current, and as they fall out of date introduce significant error in the results. Instead, we split all routable IPv4 address space into /24 prefixes and for each probe we select an IP address, uniformly at random, from a random /24 portion. We have recently verified using preliminary topology measurements in June 2006 that this simpler approach delivers significantly more topology coverage than skitter. Ark can also support other destination selection algorithms, including predefined lists of addresses to probe (the skitter approach) which is useful for specific infrastructure assessments. The Archipelago architecture uses a star topology in which the central coordination server (located on our machine room floor in San Diego) communicates with remote monitors located throughout the global Internet. The remote monitors download lists of probe destination IP addresses from the central server. In addition to destination list distribution, the ark coordination facilities provide scheduling, process control, dependency and order checking, and data preparation and cleanup. The tuple space model explicitly supports concurrency, putting the burden of locking shared space on the system rather than the end user, and providing automatic mutual exclusion to guarantee atomic transactions across multiple monitor processes. The tuple space model also supports decoupling of coordination in time (reader/writer processes may have overlapping lifetimes) and space (reader/writer processes need not know the identity, location, or even existence of each other). This design allows dynamically changing, open-ended sets of participants and monitors over the course of each experiment. In addition to destination lists, the tuple space can also handle arbitrary lists, queues, trees, graphs, and other data structures existing independently of the control and measurement processes that can concurrently manipulate these data structures. These properties provide a strong foundation for problem solving using distributed measurements. While the central coordination server maintains a global tuple space, each remote monitor has a local implementation of the tuple space. While processes from all nodes can access regions of the global tuple space for inter-node communications, only local processes on the monitors can access their local tuple regions. These facilities provide the mechanism for numerous communication models such as one-to-one, many-to-many, and all-to-all. Ark monitors can be tuned to target an optimal rate of probing, which changes with resource availability. As each monitor completes a single assignment of probes, the monitor transfers the resulting data back to the central server, coordinated via the tuple space coordination facility.All communication between the central coordinating server and the remote monitors is encrypted. Ark's security model includes requirements for a fine-grained authorization mechanism for reading and writing files, transferring data, access control, initiating communication channels, and installing and controlling measurement software. The model also recognizes the importance of scalability, and supports the ability to delegate authority for subsets of monitoring nodes as well as allow the monitoring sites to set and administer site-specific configurations and security policies.
3.2 Alias resolution (step 1b)
The topology data produced at step 1a is a collection of traced paths, i.e., sequences of IP addresses observed by the probing. To reconstruct the router-level topology from this data we need to group multiple IP addresses belonging to the same router. There exist several IP alias resolution techniques, i.e., heuristics to perform such grouping of IP interface addresses into the routers to which they belong. We will evaluate, compare, cross-validate (cf. Sections 3.7 and 3.8), and identify improvements to the available IP alias resolution techniques to assess their accuracy and performance. We will consider the following tools:- iffinder. The CAIDA's iffinder tool implements one of the first IP alias resolutions techniques introduced in the Mercator project . The tool sends UDP probe packets to all or a subset of IP addresses seen in the traces with destination UDP ports set to presumably unused values. If router R receives such a packet from prober P destined to one of R's IP interfaces, X, while R's route back to P goes via some other of R's IP interfaces, Y, then R is supposed to reply to P with an ICMP Port Unreachable message with its source address set to Y. Prober P can thus conclude that X and Y belong to the same router.
-
ally.
The ally tool is a part of the Rocketfuel tool. It uses a combination of techniques, all providing some level of confidence that two IP addresses are configured on the same router. Ally resolution techniques include:
- checking source addresses of responses to probe packets as described above;
- checking if IP identifier fields in pairs of response packets are approximately consecutive;
- utilizing the ICMP rate limiting function, i.e., the feature that the router responds only to the first probe of a burst of probe packets.
- checking for differences in TTL values: significantly different TTL values indicate that a pair of IP addresses are not aliases.
- AAR and APAR. More recent are the the Analytical and Probe-based Alias Resolvers (AAR and APAR). The idea behind both techniques is to recognize the structure of the set of IP addresses observed in traces against common IP address assignment schemes. For example, IP addresses configured on point-to-point interfaces often belong to either /30 or /31 subnets. Given this observation, we can check for the boundary IP addresses in such /30 and /31 subnets in the original and reverse traces, thus inferring which IP addresses are likely to be configured on the same router. For example, if the direct trace is two IP addresses X,Y, while the reverse trace is Y¢,X¢, and both pairs (X,X¢) and (Y,Y¢) belong to the same /30 or /31 subnets, then we can conclude that X and Y¢ are configured on the same router. The authors claim that this approach is more accurate, efficient, and simpler than all other existing techniques.
Other, less efficient IP alias resolution methods are reviewed in M. Gunes and K. Sarac, "Analytical IP alias resolution," in ICC, 2006. .
3.3 AS mapping (step 1c)
Mapping traceroute data to AS-level topologies is conceptually the simplest step. Traceroute-like techniques such as implemented in scamper capture the sequence of IP interface hops along the forward path from the source to a given destination by sending either UDP or ICMP probe packets to the destination. Using the core BGP tables provided by RouteViews, we map the IP addresses in the gathered IP paths to the AS numbers that advertise the longest IP prefixes that match the corresponding IP addresses. If two consecutive IP hops in a trace resolve to two different ASes, we create a link between these two ASs. The set of these links constitute an AS-level topology graph.Mapping traceroute-observed IP addresses to AS numbers using BGP routing tables involves potential distortion, e.g., due to AS-sets, private ASes, multi-origin ASes (the same prefixes advertised by multiple ASes), and unresolved links. Both multi-origin ASes and AS-sets create ambiguous mappings between IP addresses and ASes, hence we filter them out. In addition, we filter private ASes as they create false links. Unresolved IP hops in the traceroute data give rise to indirect links, i.e., links that connect two resolved IP hops with one or more unresolved hops in between them. We discard indirect links as well. The total discarded and filtered links usually constitute approximately 5% of all links in the initial traceroute-generated AS graphs.
3.4 Dual AS+router-level topology construction (step 1d)
Although the router topologies at step 1b and the AS topologies at step 1c are obtained from the same raw traceroute data, they are intrinsically distinct. This distinction stems from the completely different techniques used to create these topologies: heuristics to resolve IP addresses that are assigned to the same router for the former, and mapping IP addresses to AS numbers using RouteViews for the latter. Therefore, we must devise special heuristics to construct topologies that simultaneously and accurately represent the Internet at both the router and AS granularities. To see that the simplistic approach to integrating a derived router and derived AS graph may lead to extremely inaccurate results, consider the following example. Suppose that we construct a router-level topology after executing IP alias resolution techniques at step 1b. We now wish annotate all routers in this topology with the AS who owns the router. Unfortunately, traceroute data contains no information that would identify the owning AS. All information available to us is represented in two maps: These two maps do allow us to determine the set of ASes advertising the set of IP addresses assigned to the same router ID, but no more connectivity information than that. So we create a third map:- map3: router ID ® a set of AS numbers announcing IP addresses that are part of this router ID.
- use the dK-series extended for dual graph (see Section 3.8 for more details);
- filter out all AS links not present in the AS-level graph;
- filter out AS links violating routing polices imposed by inferred AS relationships;
- assign routers to ASes maximizing the number of valid paths according to inferred AS relationships;
- assign routers to ASes based on AS sizes estimated by AS degree or by the total number of observed IP addresses advertised by this AS;
- assign routers to ASes based on the number of IP addresses attached to the same router and advertised by the same AS;
- combinations of the above.
We will evaluate these and other techniques and use those that work best. The main outcome of this step is router-level topologies with links (and possibly nodes) annotated by AS numbers. We call these graphs dual AS+router-level topologies.
3.5 Topology analysis software (step 1e)
Vulnerability of a network to attacks depends drastically on calculable characteristics of the network topology. Consider the following three examples:- Spectrum. The smaller the number of alternative paths between a pair of communicating nodes in the network, the easier it is for an attacker to sever all these paths to disrupt the communication. The average path diversity can be estimated as the minimum number of links one needs to cut to decompose the network into isolated pieces of approximately equal size. The spectrum of the topology graph representing a network, i.e., a collection of the eigenvalues of its adjacency matrix, provides tight estimates for this min-cut number.
- Betweenness. The number of shortest paths passing through a particular node or link, called betweenness, is a measure of its communication importance. The higher the betweenness of a node or link, the more communication paths will be disrupted and/or re-routed if an attacker interrupts the normal operation of this node or link.
- Assortativity. All other things equal, networks with more links connecting high-degree nodes, i.e., nodes directly connected to many other nodes, to low-degree nodes are more vulnerable than networks with links interconnecting nodes of similar degrees. The former are called disassortative, while the latter are assortative. The reason that that the min-cut of disassortative network is smaller is that disassortative networks have fewer links in the network core than assortative networks do. Because links in the core interconnect high-degree network communication hubs, severance of such links decomposes a network into disconnected islands. The smaller the number of such links, the easier it is for an attacker to disrupt communications of the global network.
We will release the software (per UC policy) to compute all these topology metrics. This software will be generic in nature, applicable to both router- and AS-level topologies.
3.6 Annotations and AS relationships (step 2a)
Inaccuracies associated with representing Internet topologies as simple undirected unweighted graphs result not only from potential sampling biases in topology measurements, but also from neglecting link and node annotations. By annotations we mean various types of links and nodes that abstract their intrinsic structural and functional differences. For the Internet topology at the Autonomous System (AS) level, link annotations represent different business relationship between ASes, e.g., customer-to-provider, peer-to-peer, etc., while node annotations represent different types of ASes, e.g., large or small Internet Service Providers (ISPs), exchange points, universities, customer enterprises, etc.. In router-level Internet topologies, link annotations can be different transmission speeds, latencies, packet loss rates, etc. Simply reproducing the topology of the Internet without any knowledge of the semantics of the links and nodes is insufficient; we must also understand and reproduce annotations. We propose network annotations as a general framework to describe the functionality of individual links and nodes. Since links and nodes are constituents of a global network, increasing accuracy of description at this microscopic level will also increased accuracy of a variety of important macroscopic graph properties. In the AS topology case, for example, instead of considering only shortest paths, we will be able to study the structure of paths that respect constraints imposed by routing policies and AS business relationships; the same applies to path diversity and other properties important for accurate estimation of network resilience to accidents or intentional attacks. AS relationships are annotations of links of the Internet AS-level topology. They represent business agreements between pairs of AS neighbors. There are three major types of AS relationships:- customer-to-provider (c2p), connecting customer and provider ASes;
- peer-to-peer (p2p), connecting two peer ASes; and
- sibling-to-sibling (s2s), connecting two sibling ASes.
- exporting routes to a provider or a peer, an AS advertises its local routes and routes received from its customer ASes only;
- exporting routes to a customer or a sibling, an AS advertises all its routes, i.e., its local routes and routes received from all its AS neighbors.
- uphill zero or more c2p links, followed by
- top zero or one p2p links, followed by
- downhill zero or more p2c links,
- shortest paths between nodes are shorter than in reality;
- path diversity is larger than in reality;
- traffic load on nodes and links is lower than in reality.
To infer AS relationships, we will utilize our award-winning unique techniques based on state-of-the-art multiobjective optimization. These techniques were found to provide unprecedented levels of accuracy both in our own validation and in an independent study. The main idea behind these inference heuristics is to optimize the trade-off between AS relationship information that can be extracted from AS degrees and maximization of the number of valid paths in the resulting annotated AS topology.
3.7 Geographic locations and latencies (step 2b and 2c
We will evaluate available geolocation inference tools and use those that most accurately annotate router nodes in our dual AS+router topologies with geographic and performance attributes. Geolocation inference techniques map individual IP addresses to their geographic positions. Among other evaluation methods, we will use cross-validation of geographic inferences with IP alias resolution results at step 1b: if a set of IP address resolves to the same router, then all these addresses should also map to (approximately) the same geographic location. To optionally infer router-link latencies we will rely on traceroute data. Each IP hop in the data obtained at step 1a comes with the recorded round trip time (RTT). Unfortunately, relying solely on the RTT data may be misleading since processing of the ICMP Time Exceeded messages happens not in the data but in the control plane of the router. Processing time may in fact be significantly longer than the actual RTT between a router and the monitor. Worse, this processing time varies unpredictably from router to router. We will therefore cross-validate our latency inference results with our geolocation and, consequently, IP alias resolution results.The outcome of this step is a dual AS+router-level topology with routers annotated with geolocations and, optionally, router-links annotated with latencies.
3.8 dK-series
Throughout the proposed work we will use the powerful dK-series framework that we introduced in P. Mahadevan, D. Krioukov, K. Fall, and A. Vahdat, Systematic topology analysis and generation using degree correlations, in SIGCOMM, 2006. The dK-series formalism provides a calculus for analysis of correlations within a network topology. In its simplest form, dK-series are simply correlations among node degrees. More formally, the dK-series for a given network topology is a collection of dK-distributions defined as correlations of degrees of nodes within subnetworks of size d of the given network. Our most recent work with dK-series extends the formalism to apply to correlations among any kind of node or link annotations, with node degrees being the simplest case of node annotations. The dK-series formalism is elegantly simple and generic in nature. It provides a rigorous analytical framework and unprecedented power to create, analyze, and compare annotated dual AS+router-level topologies. Specifically, we consider the following three concrete examples of how we will use dK-series at different stages of the project:- Topology analysis (step 1e). As discussed in Section 3.5 and in our previous work, structural topology characteristics such as spectrum, betweenness, distance distribution, assortativity, clustering, are related to the robustness of the topology, defined in terms of minimal number of links or nodes that must be removed in order to fragment a network. Our dK-series approach introduces a basis that unifies all these metrics-as well as any new metrics-into a single series of metrics. The dK-series method allows for evaluation of the robustness of a given topology without having to compute all these metrics - good news since computation of some of them can be prohibitively hard. Instead, we can limit computations to appropriate dK-distributions and as soon as they match the dK-distribution of some point-of-reference topology whose robustness properties are already known, we can rely on the dK-randomness theory to conclude that robustness properties of the given topology are approximately the same.
-
AS+router-level quasi-duality (step 1d).
The input to step 1d is scamper (traceroute) data processed at steps 1b and 1c to derive router- and AS-level topologies. We thus have information on:
- number n(k) of routers of degree k;
- number n(k,k¢) of router-links connecting routers of degrees k and k¢;
- number N(K) of ASes of degree K;
- number N(K,K¢) of AS-links connecting ASes of degrees K and K¢;
- number N(K,K¢;k) of AS-links connecting ASes of degrees K and K¢, and going through a router of degree k;
- number n(k,k¢;K) of router-links connecting routers of degrees k and k¢, and addressed from IP address space advertised by an AS of degree K;
- Geolocations and latencies (step 2b and 2c). One type of correlation in topologies annotated with geolocations and latencies is between geographic distance and inferred latencies of links. Drastic anti-correlation between two statistics indicates problems with either geolocation mappings, or latency inferences, or both. We can use this type of correlation as a cross-validation tool to verify our inferences (cf. Section 3.7).
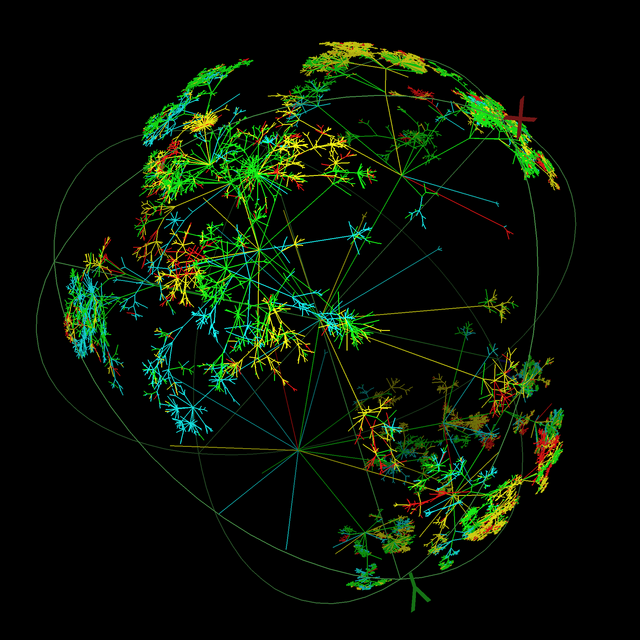
3.9 Visualizations, step 2d
For visualization of our topology data, we will initially experiment with Walrus, a CAIDA tool for interactively visualizing large directed graphs in three-dimensional space. Walrus can display graphs containing over a million nodes, but visual clutter, occlusion, and other factors diminish its effectiveness as the number and degree of nodes increases. In practice Walrus is best suited to visualizing moderately sized (up to a few hundred thousand nodes) graphs that are nearly trees. We will modify walrus to meet the needs of this project or investigate other tools for network visualization of large small-world graphs. Van Ham, now at IBM, has expressed interest in collaborating with CAIDA on large network visualization.