CAIDA Posters
In order to promote a better understanding of the Internet, CAIDA develops new visualization techniques to display Internet data and presents them as poster-sized prints for the research community. These posters are made available for download below.
AS Core Posters
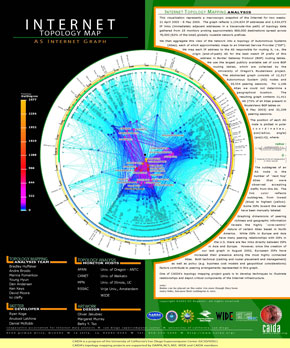
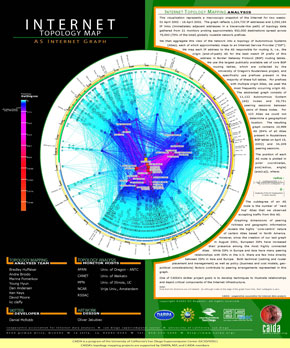
Visualization
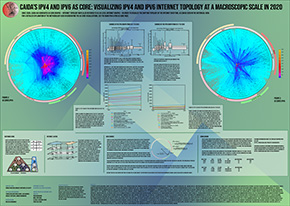
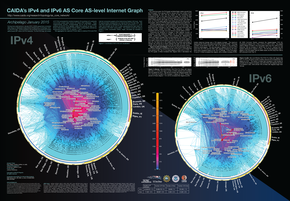
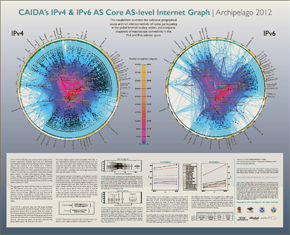
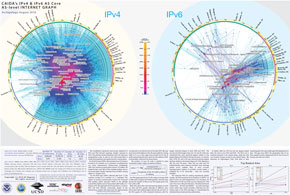
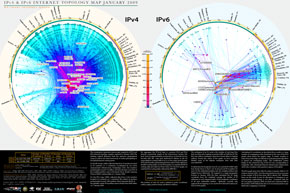
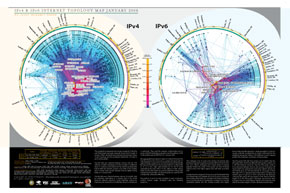
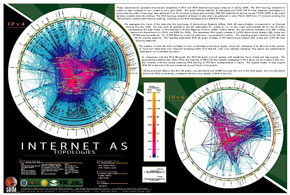
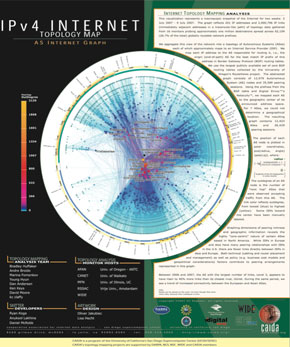
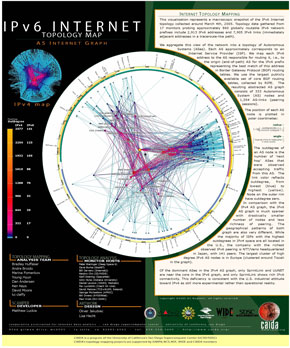
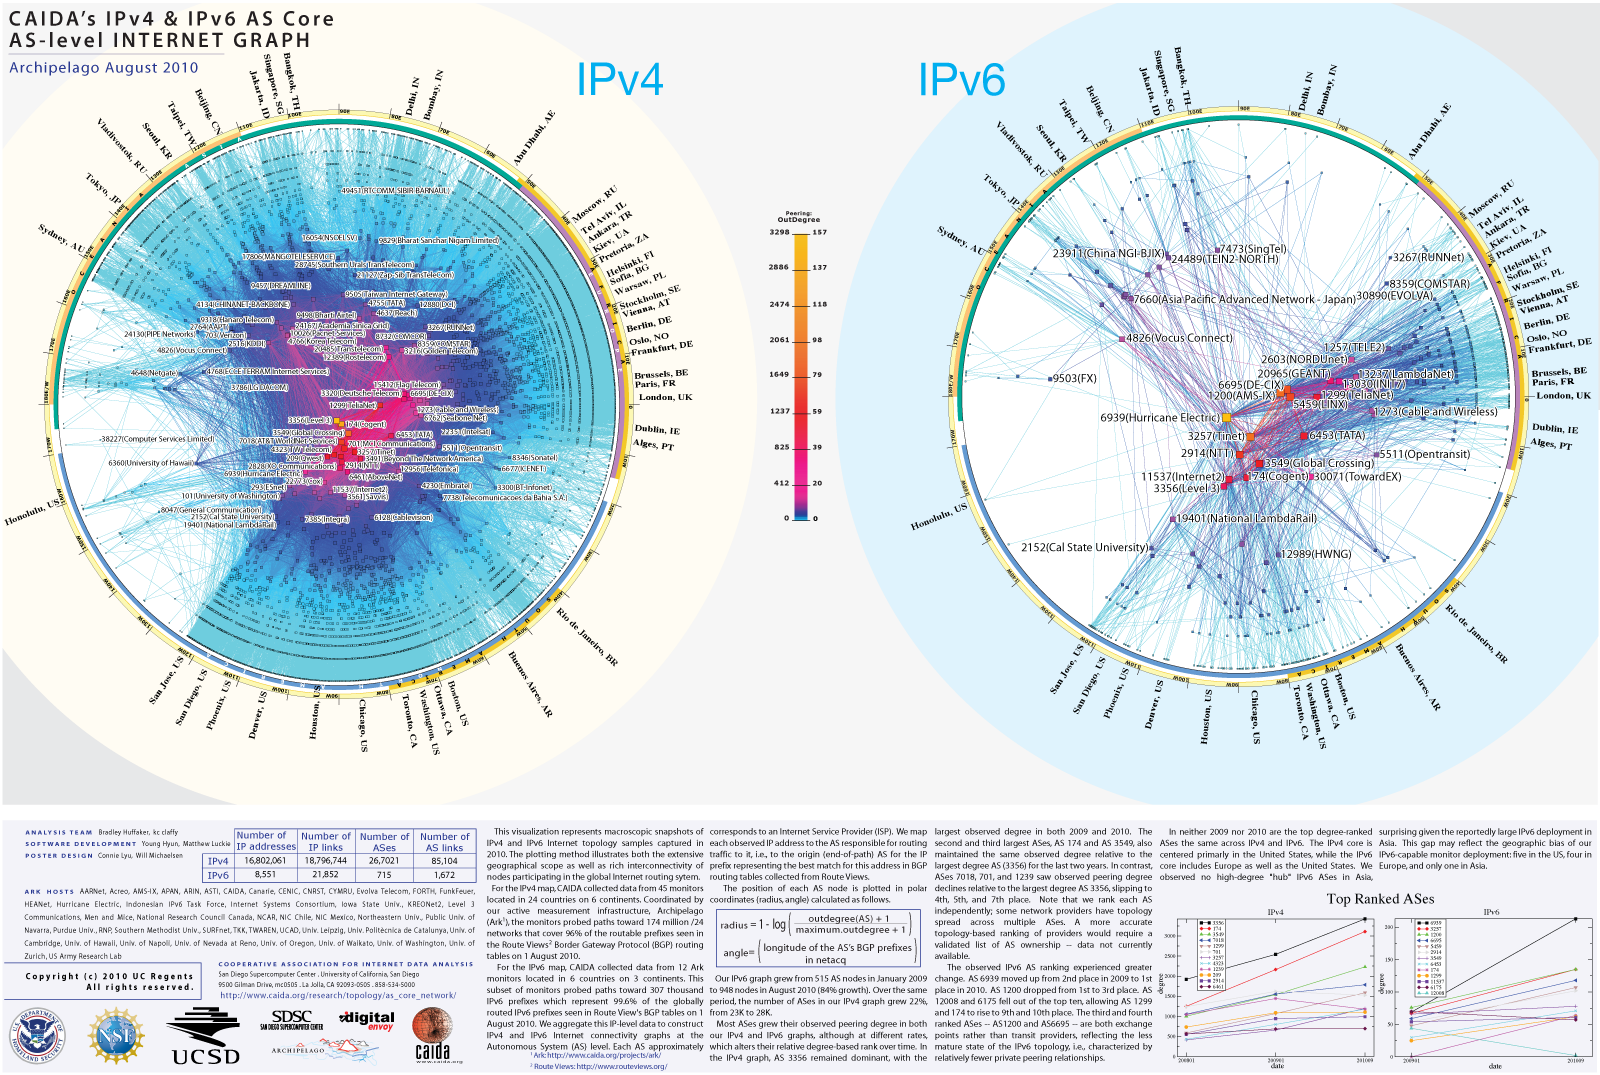
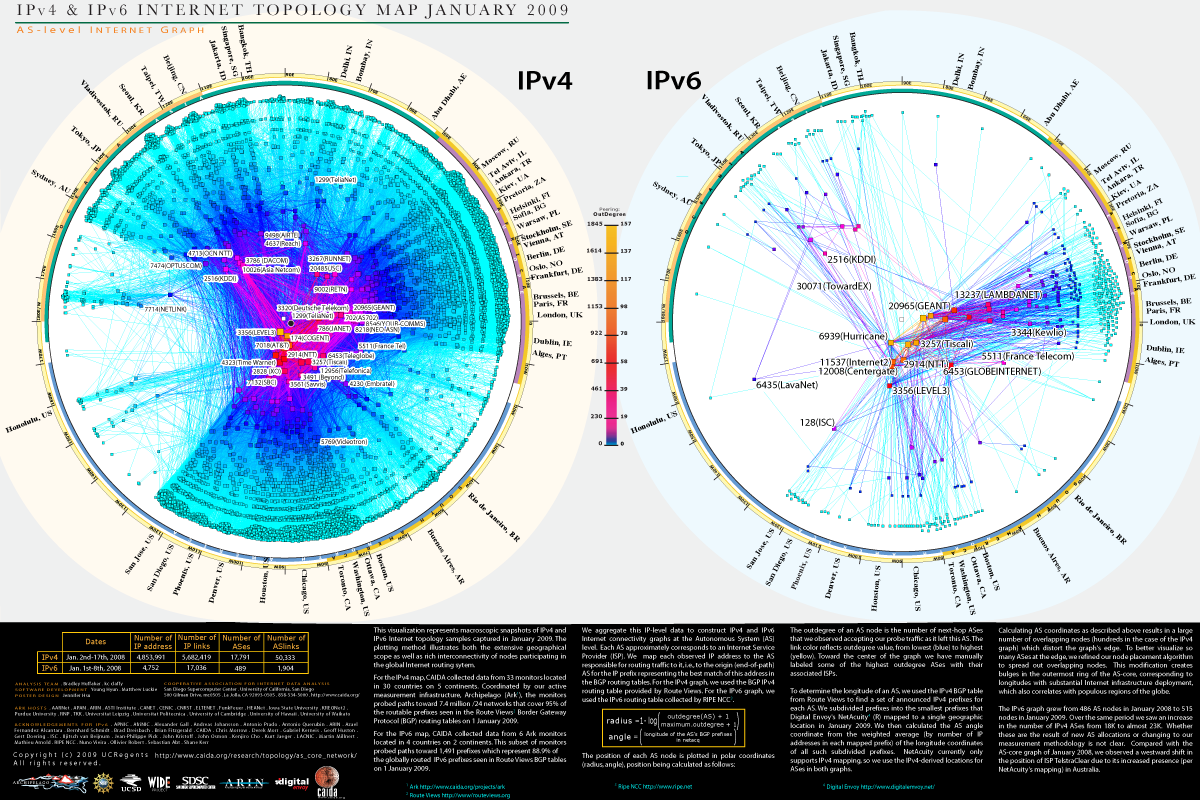
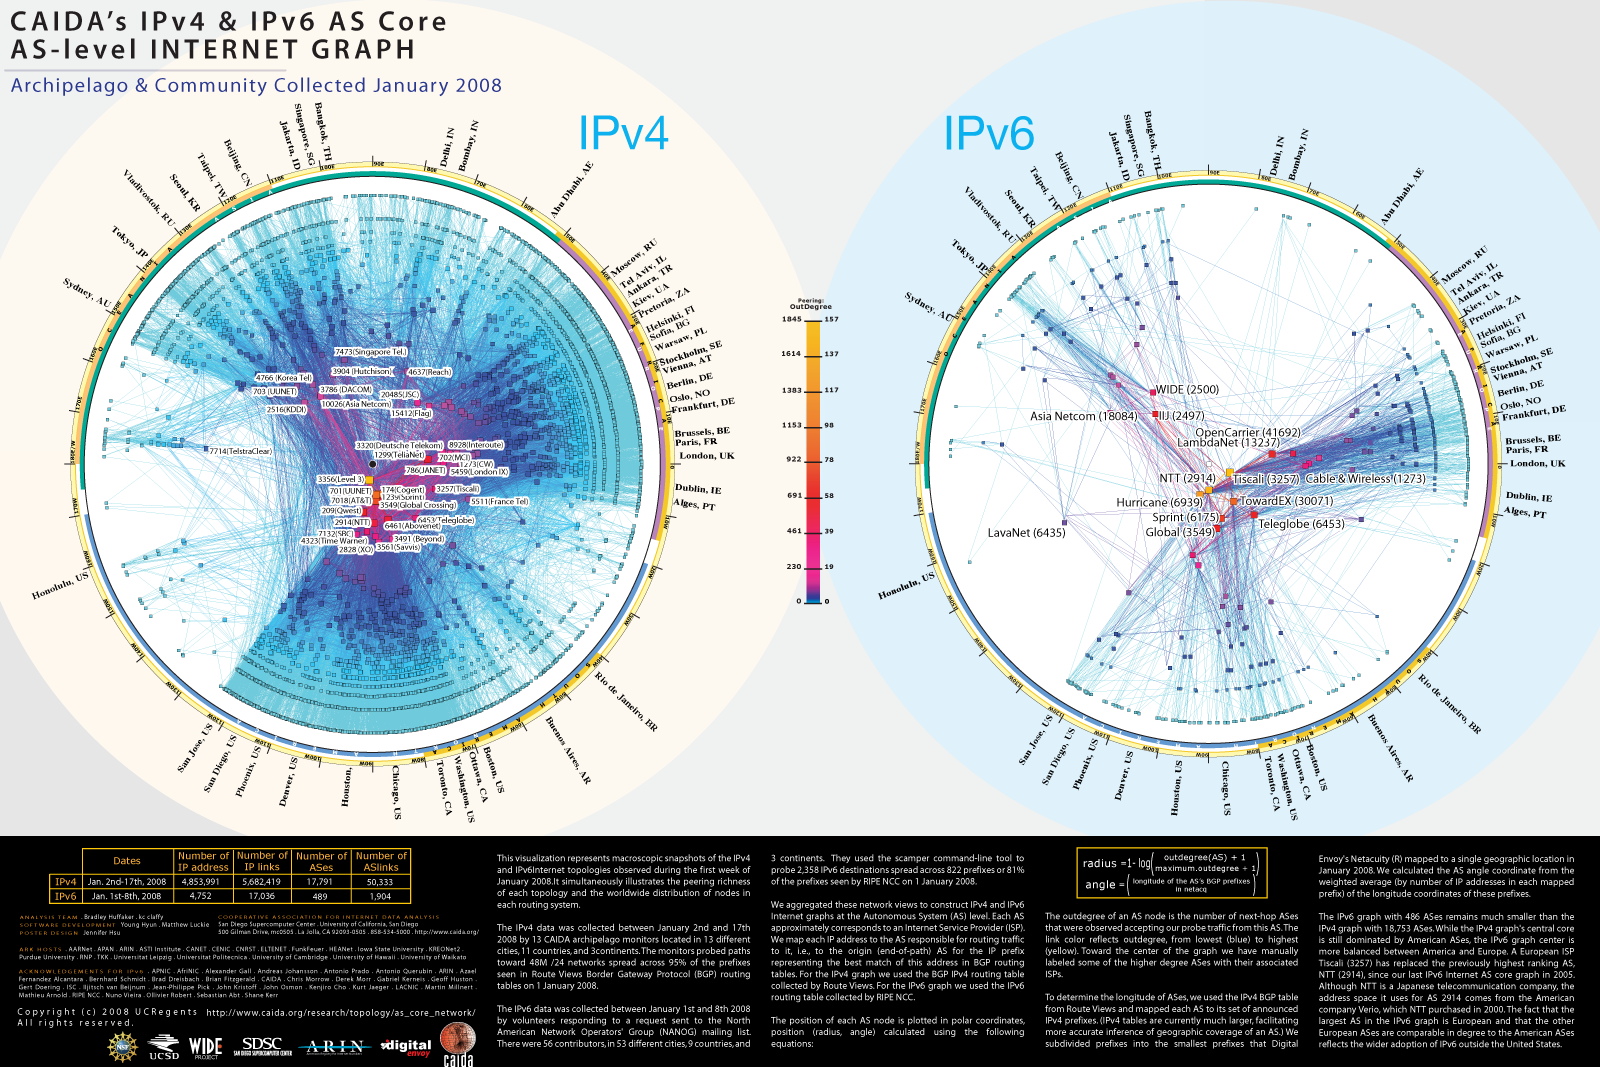
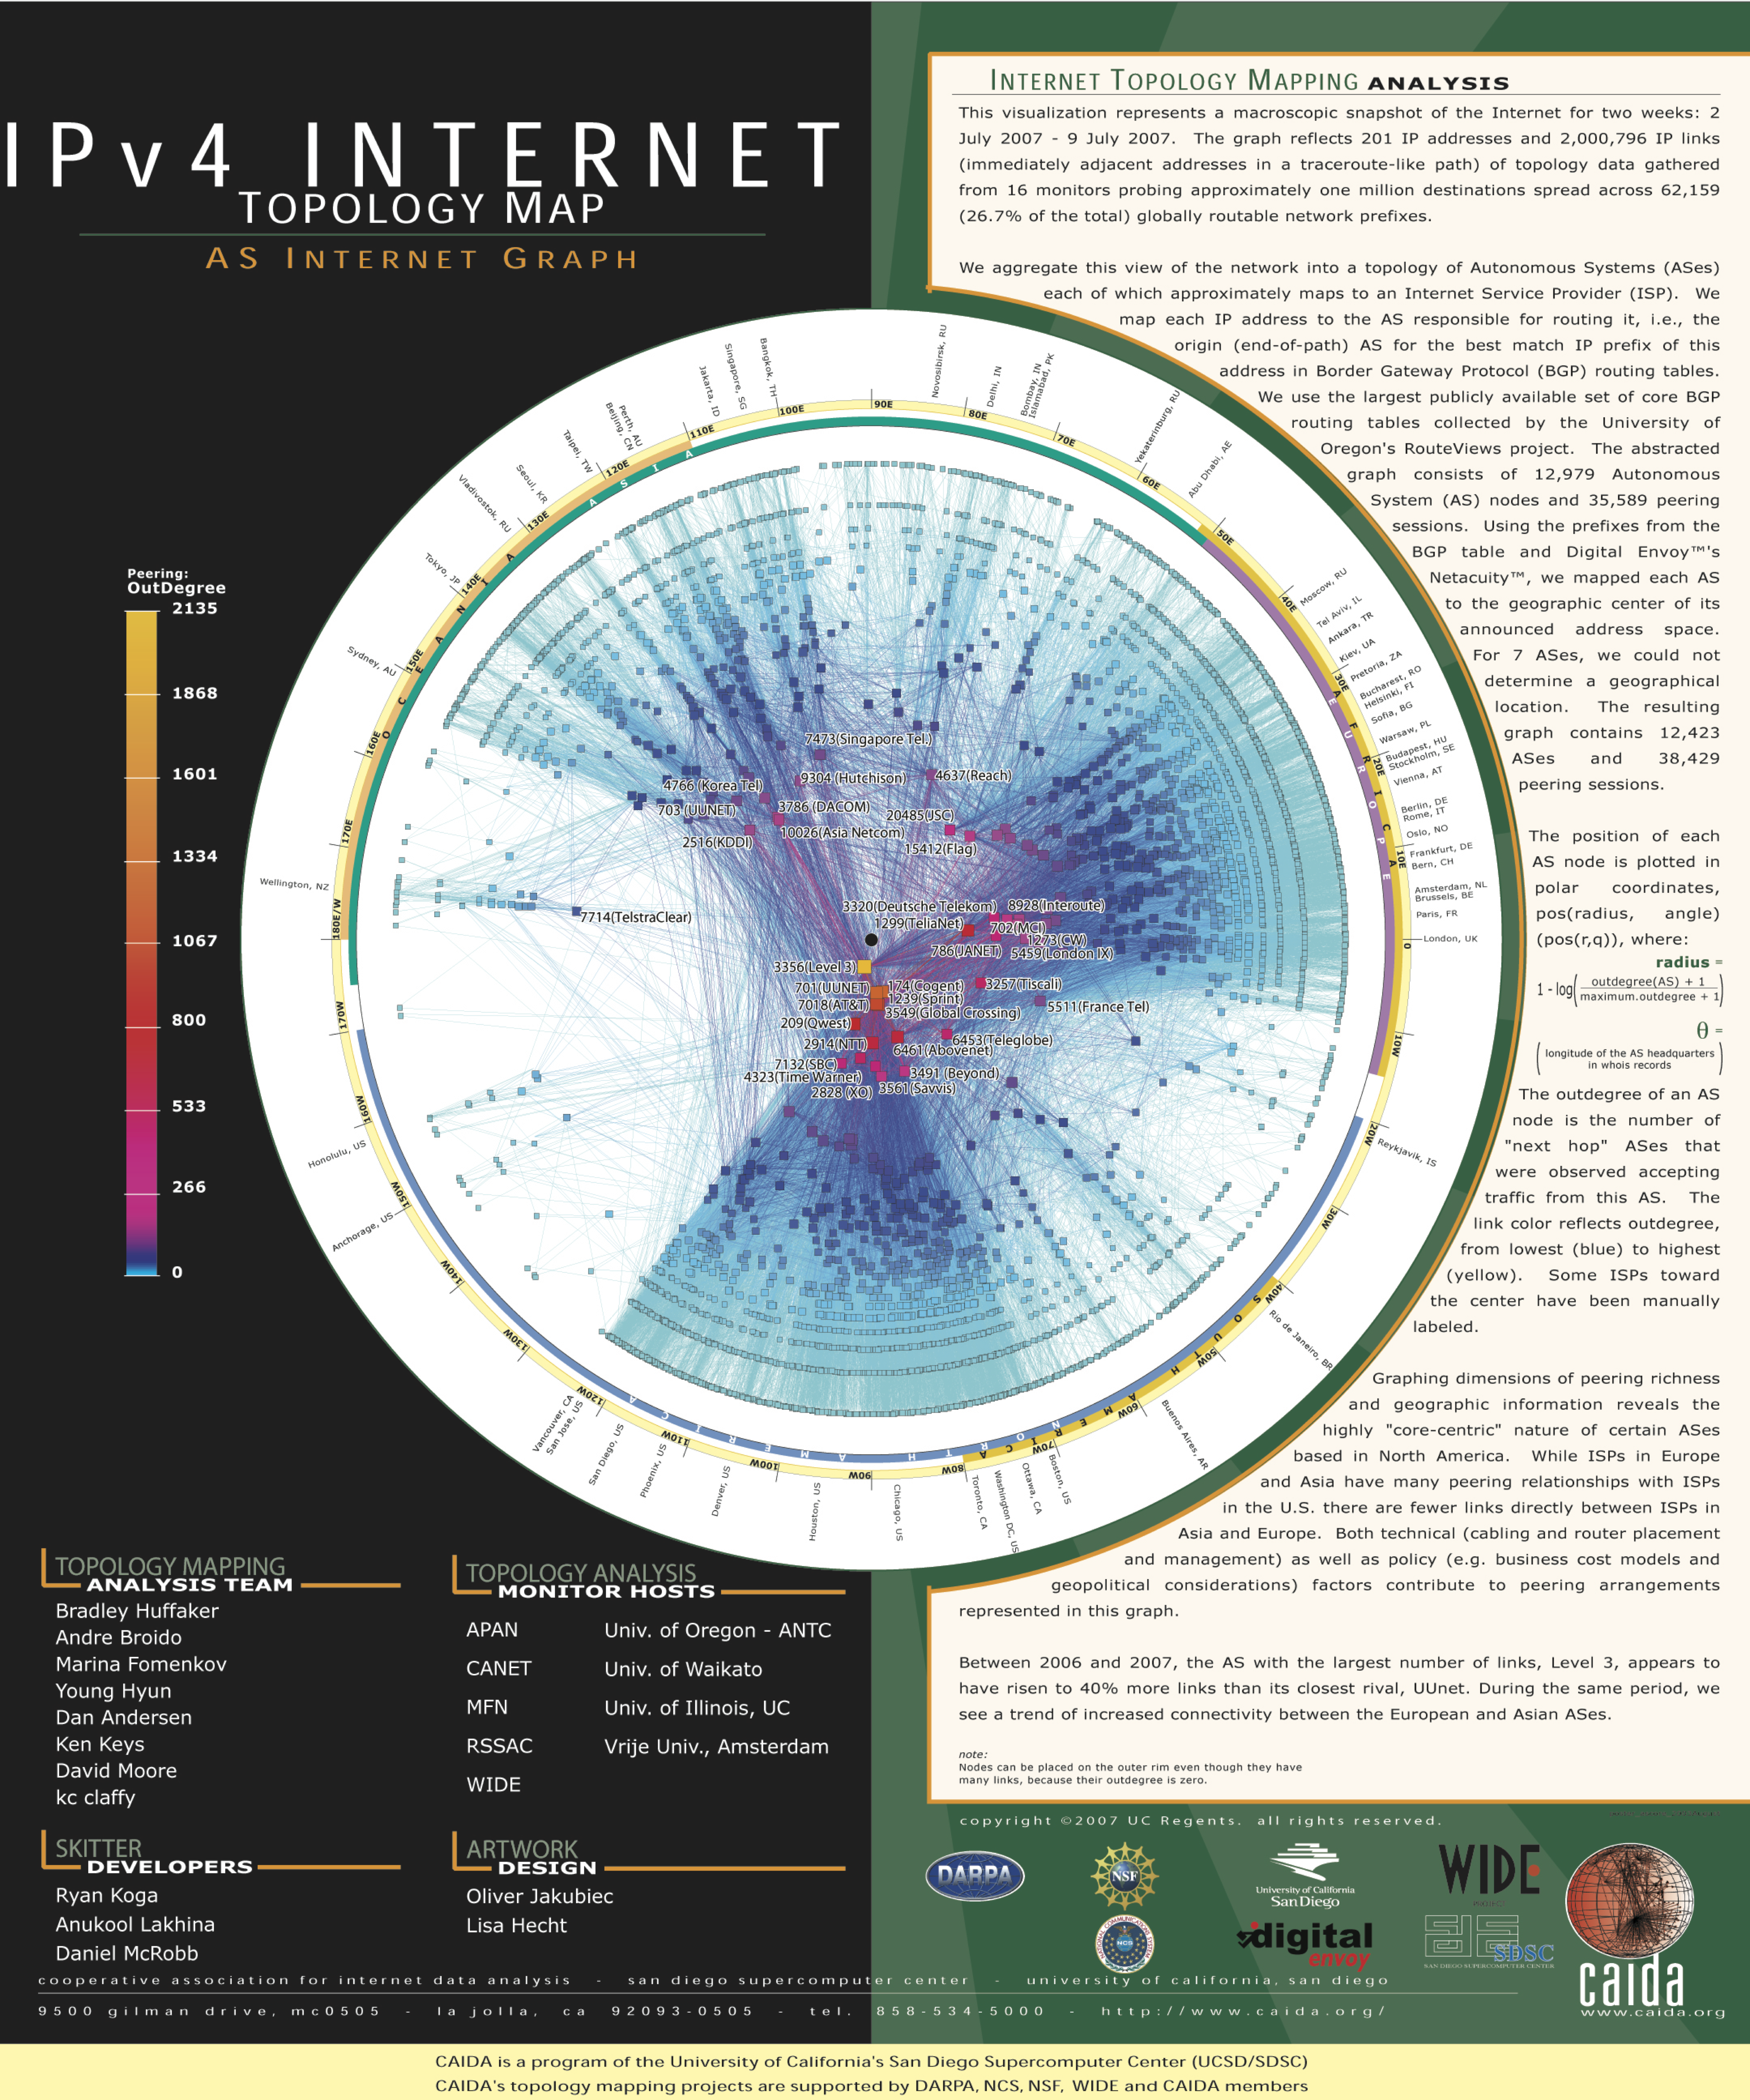
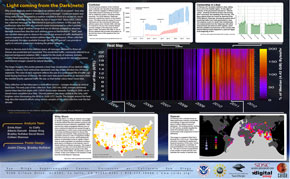
represents a macroscopic snapshot of the Internet for a two week
interval. The graph reflects IP addresses and IP links (immediately
adjacent addresses in a traceroute-like path) of topology data
gathered from 22 monitors probing destinations spread across
globally routable network prefixes. For more information, see
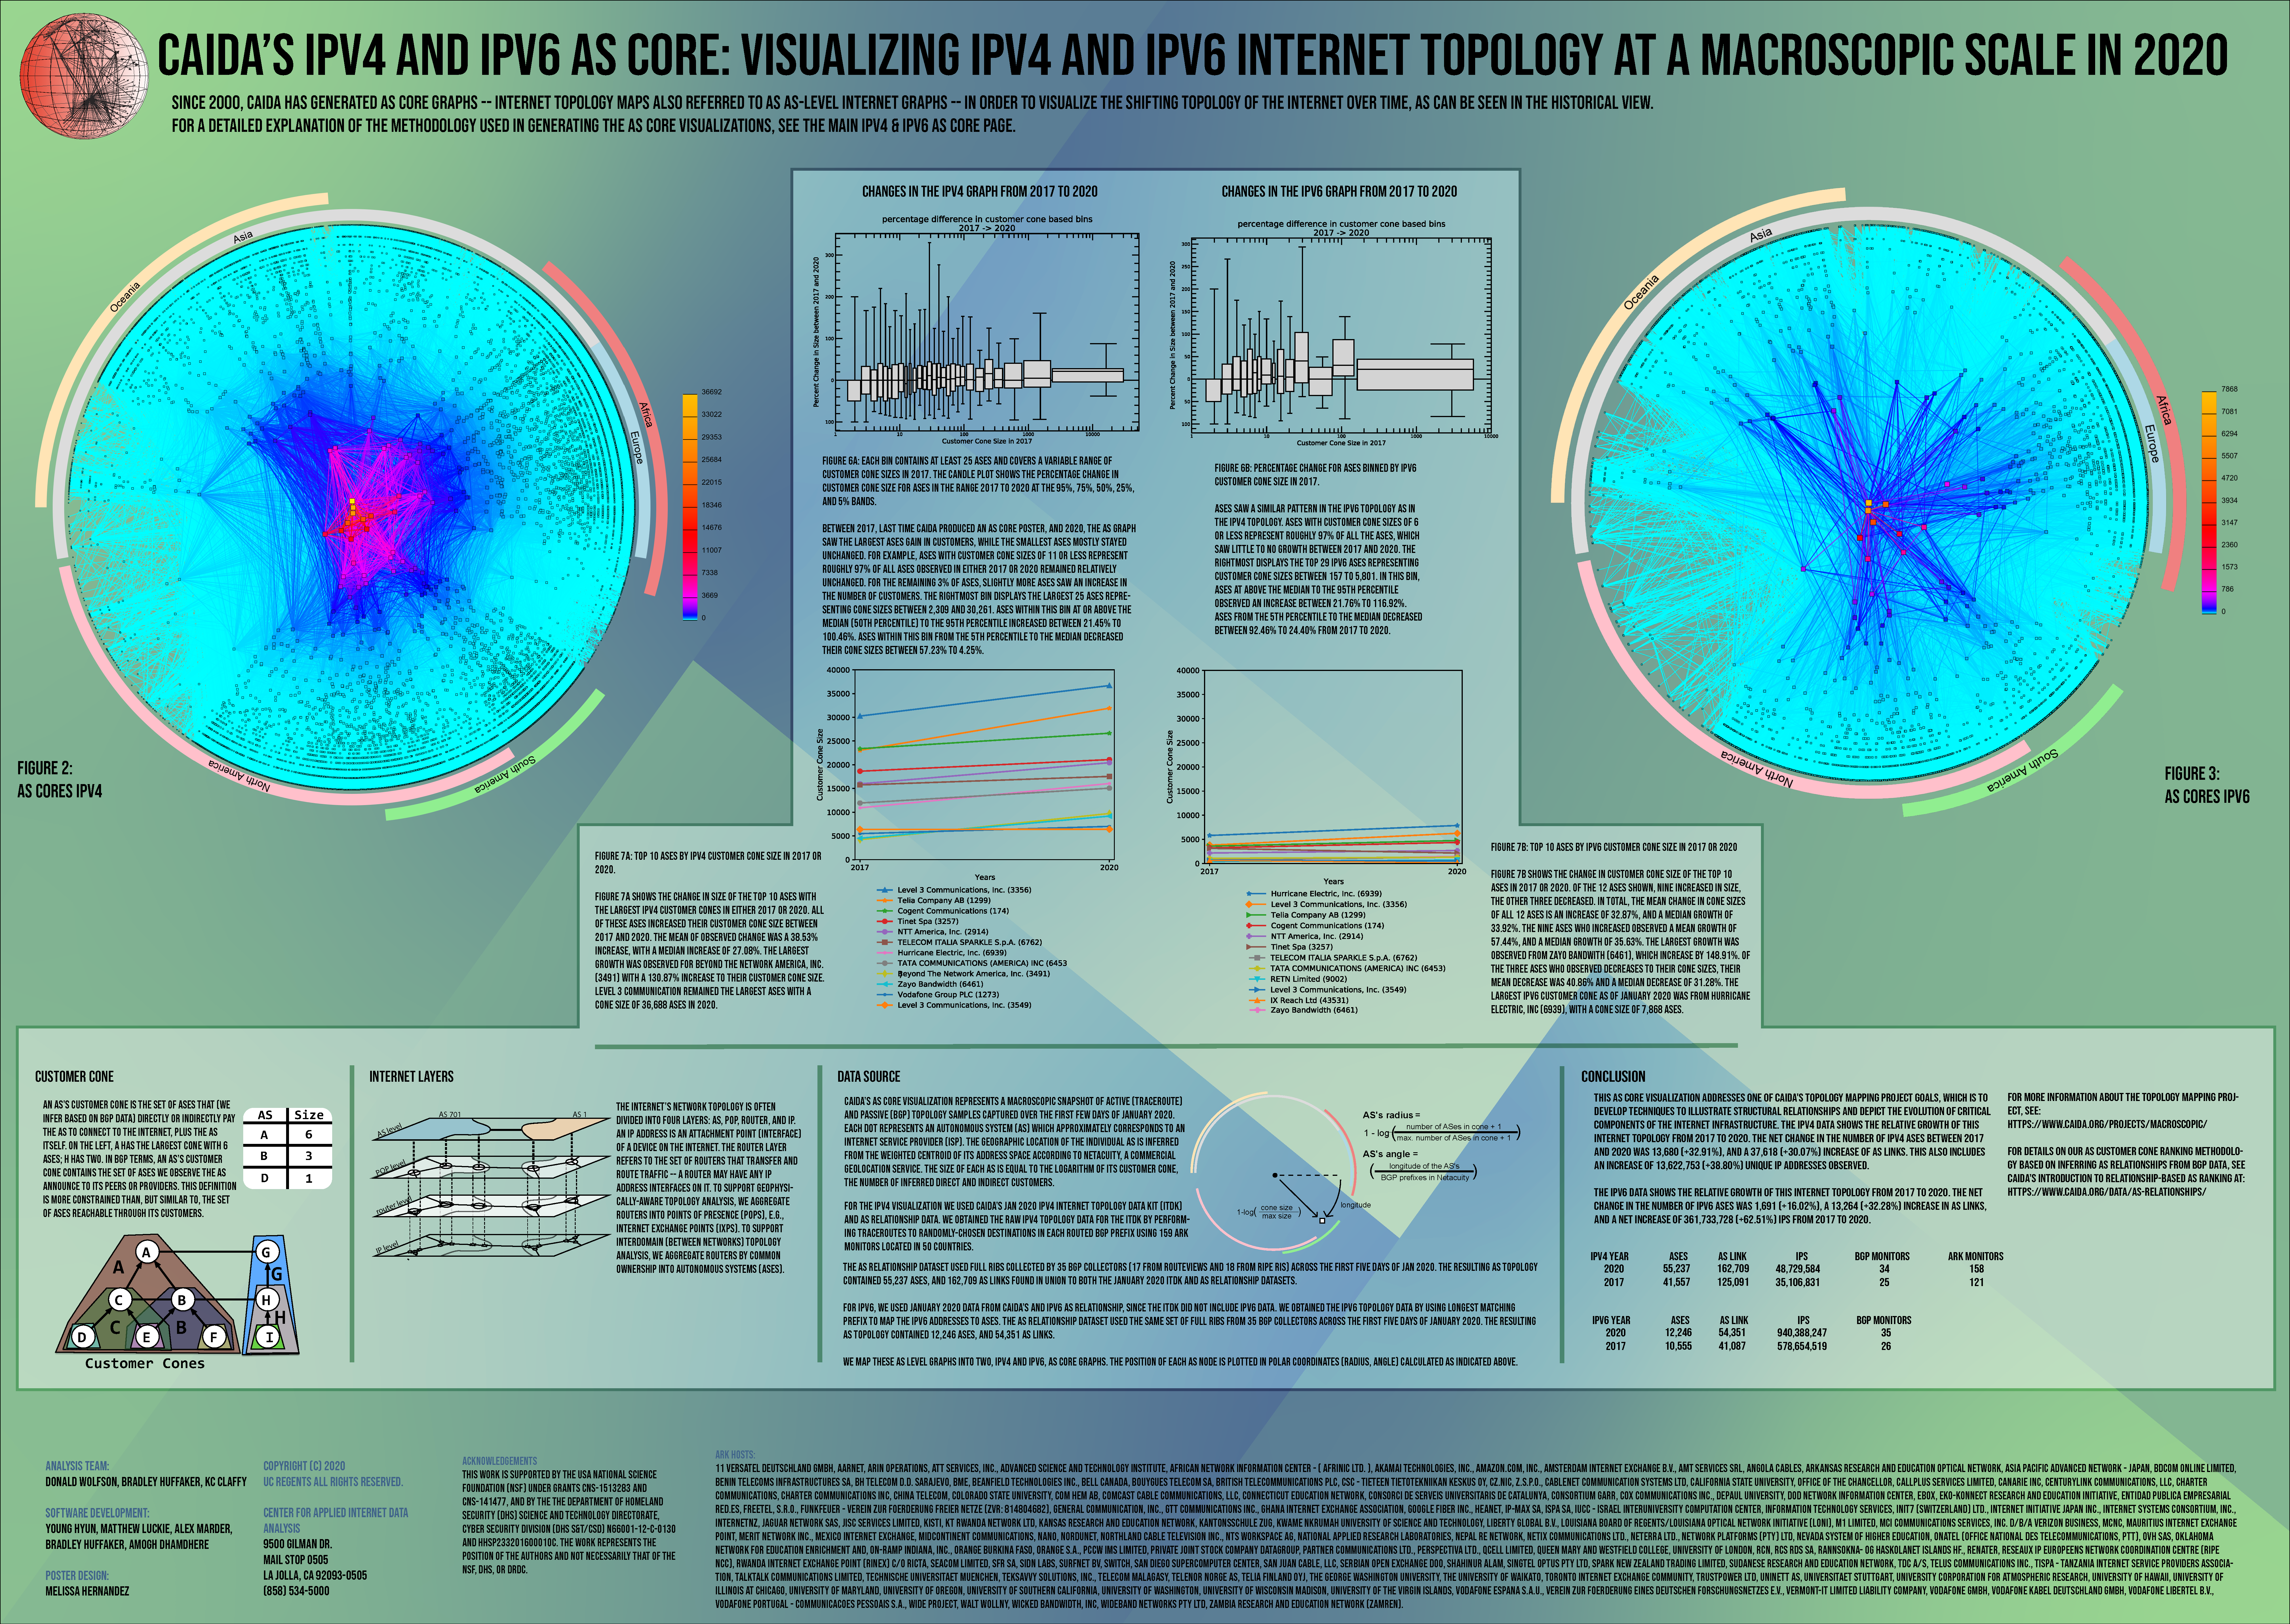
Visualizing IPv4 and
IPv6 Internet Topology at a Macroscopic Scale
-
2020 IPv4 & IPv6
-
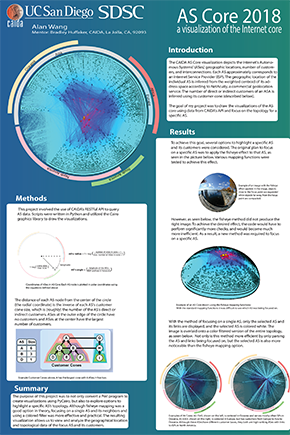
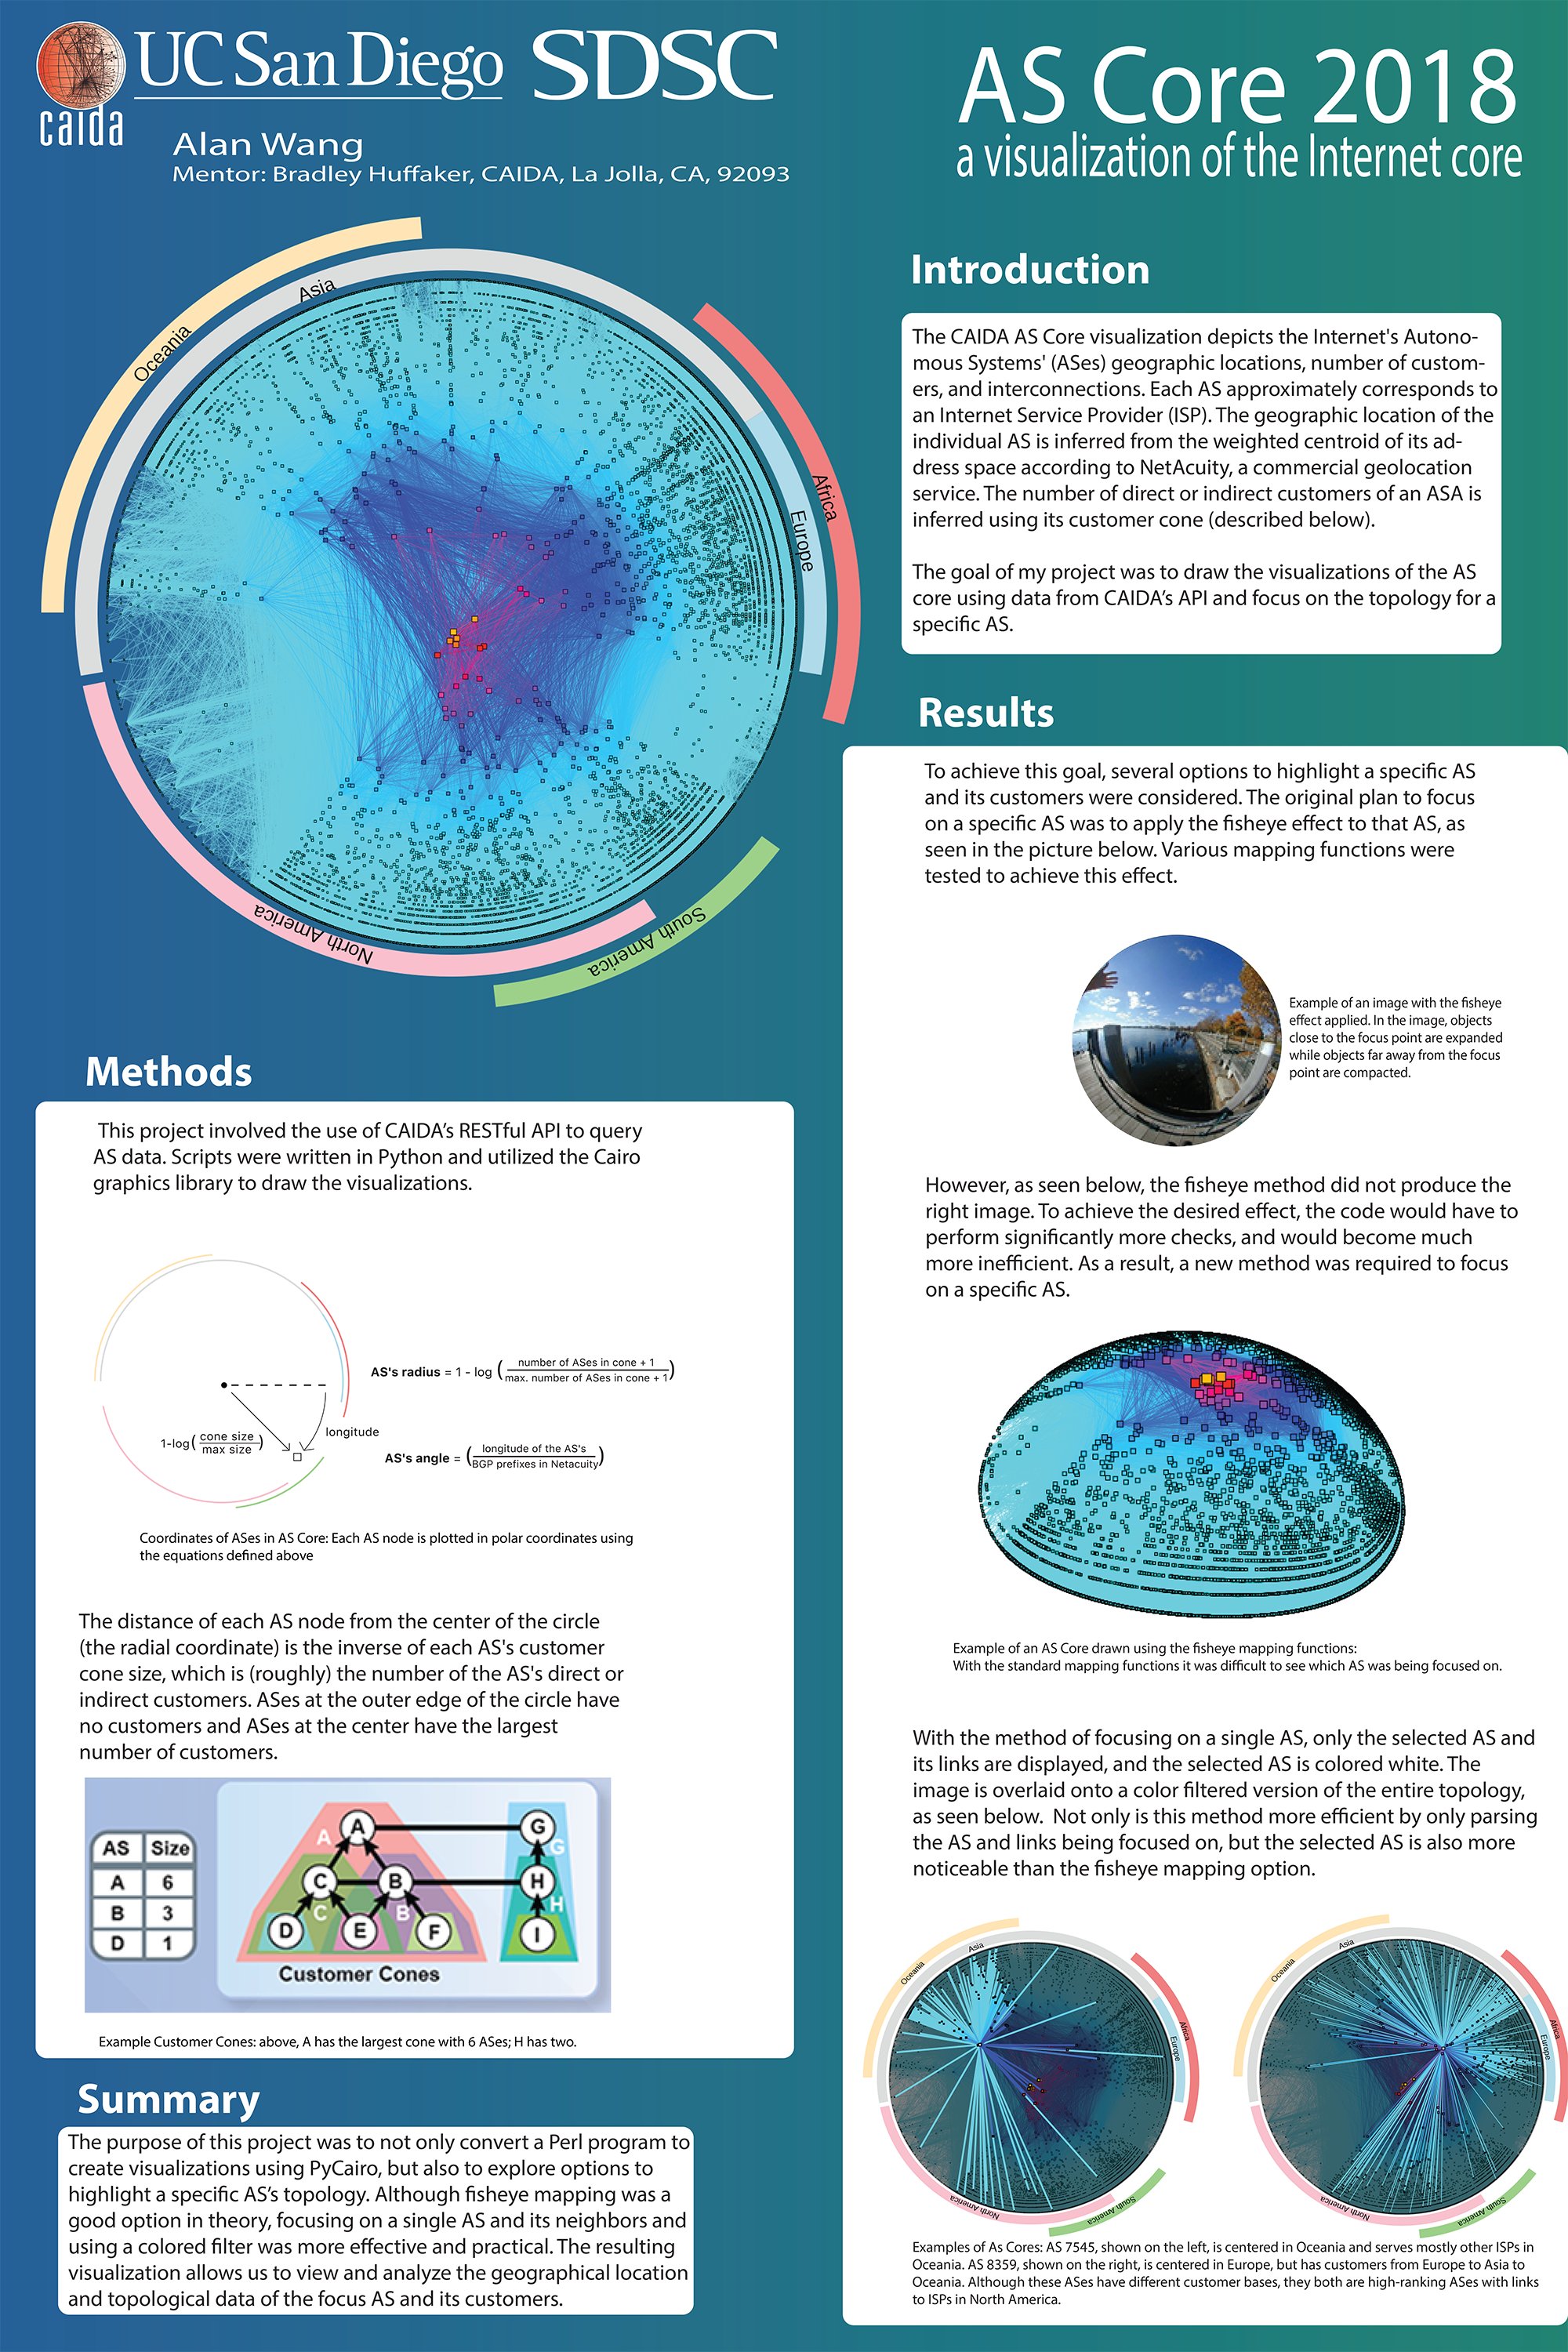
2018 Visualizing Filtered ASes
-
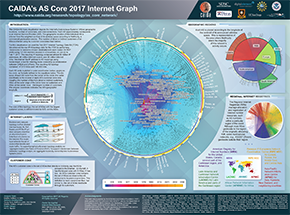
February 2017 IPv4
-
January 2015 IPv4 & IPv6
-
January 2014 IPv4 & IPv6

-
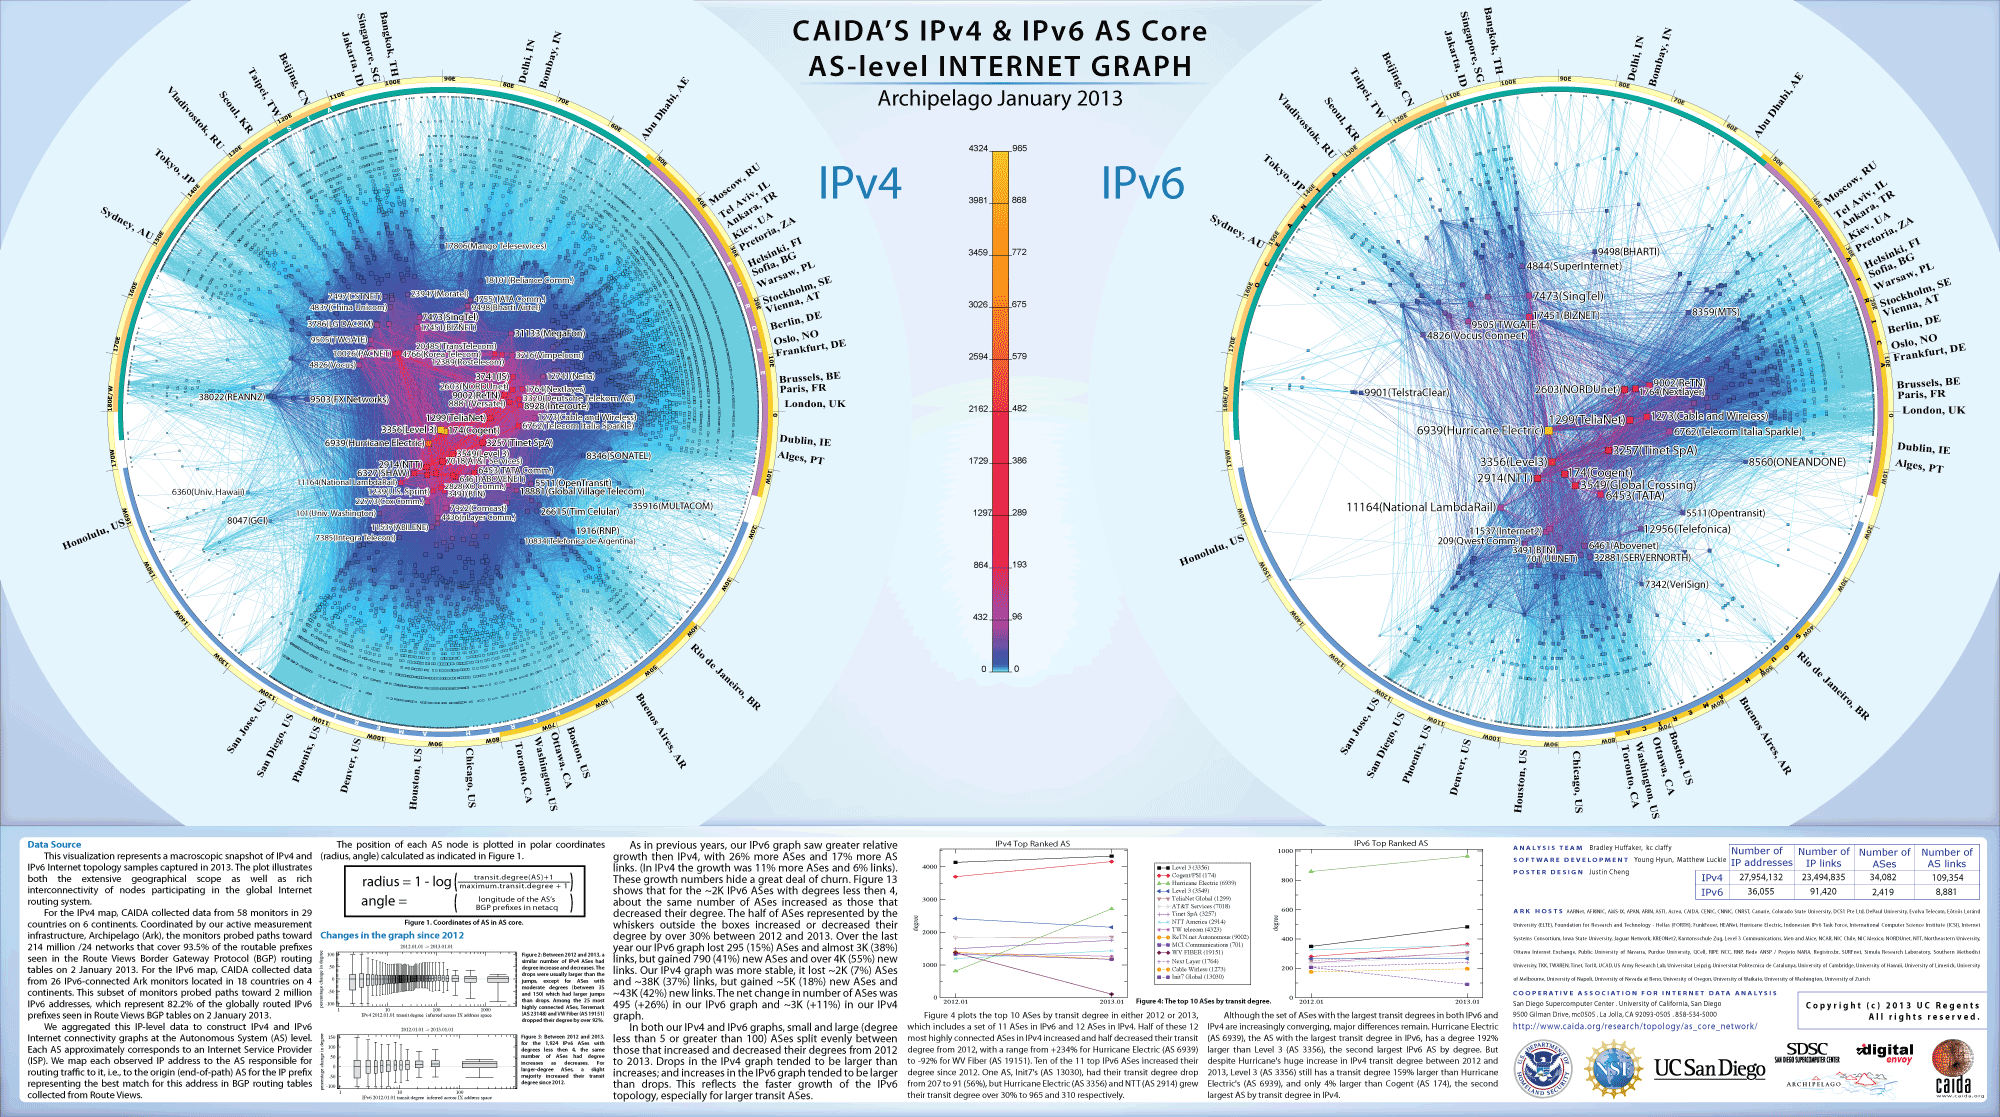
January 2013 IPv4 & IPv6

-
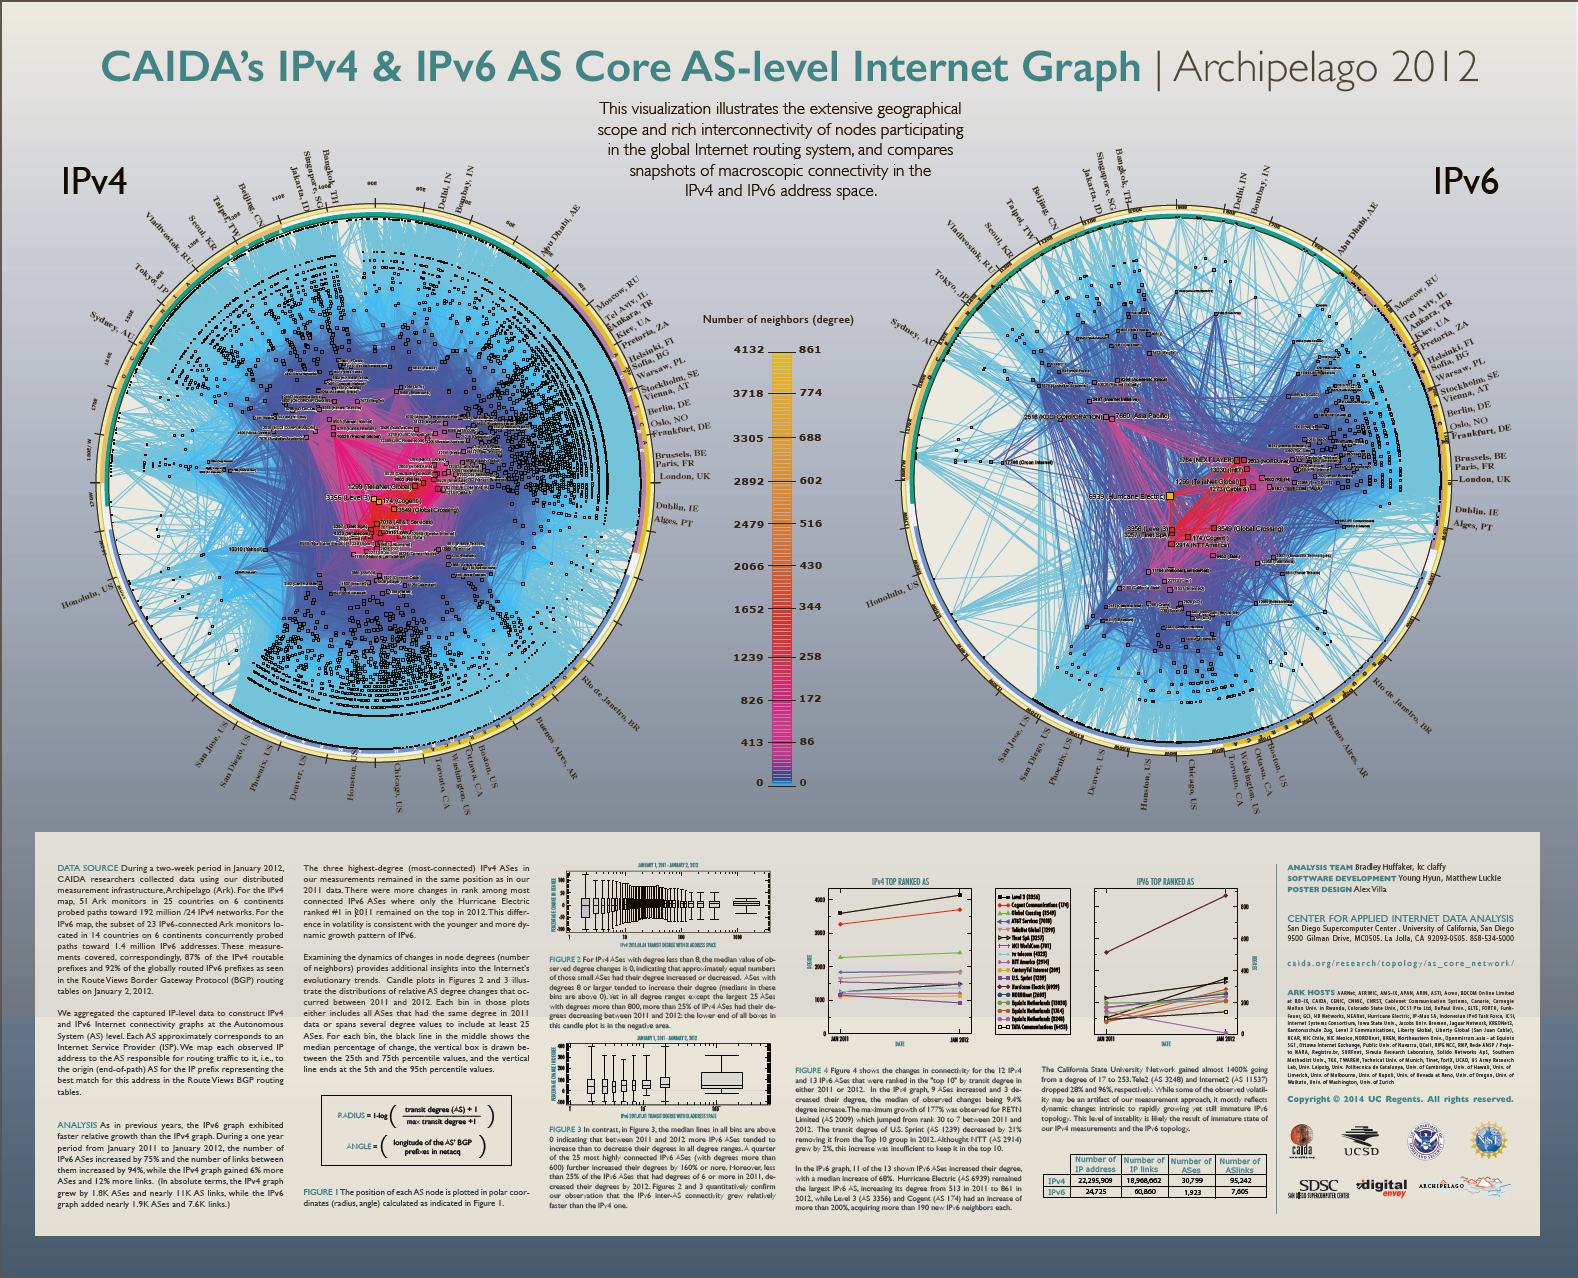
January 2012 IPv4 & IPv6
-
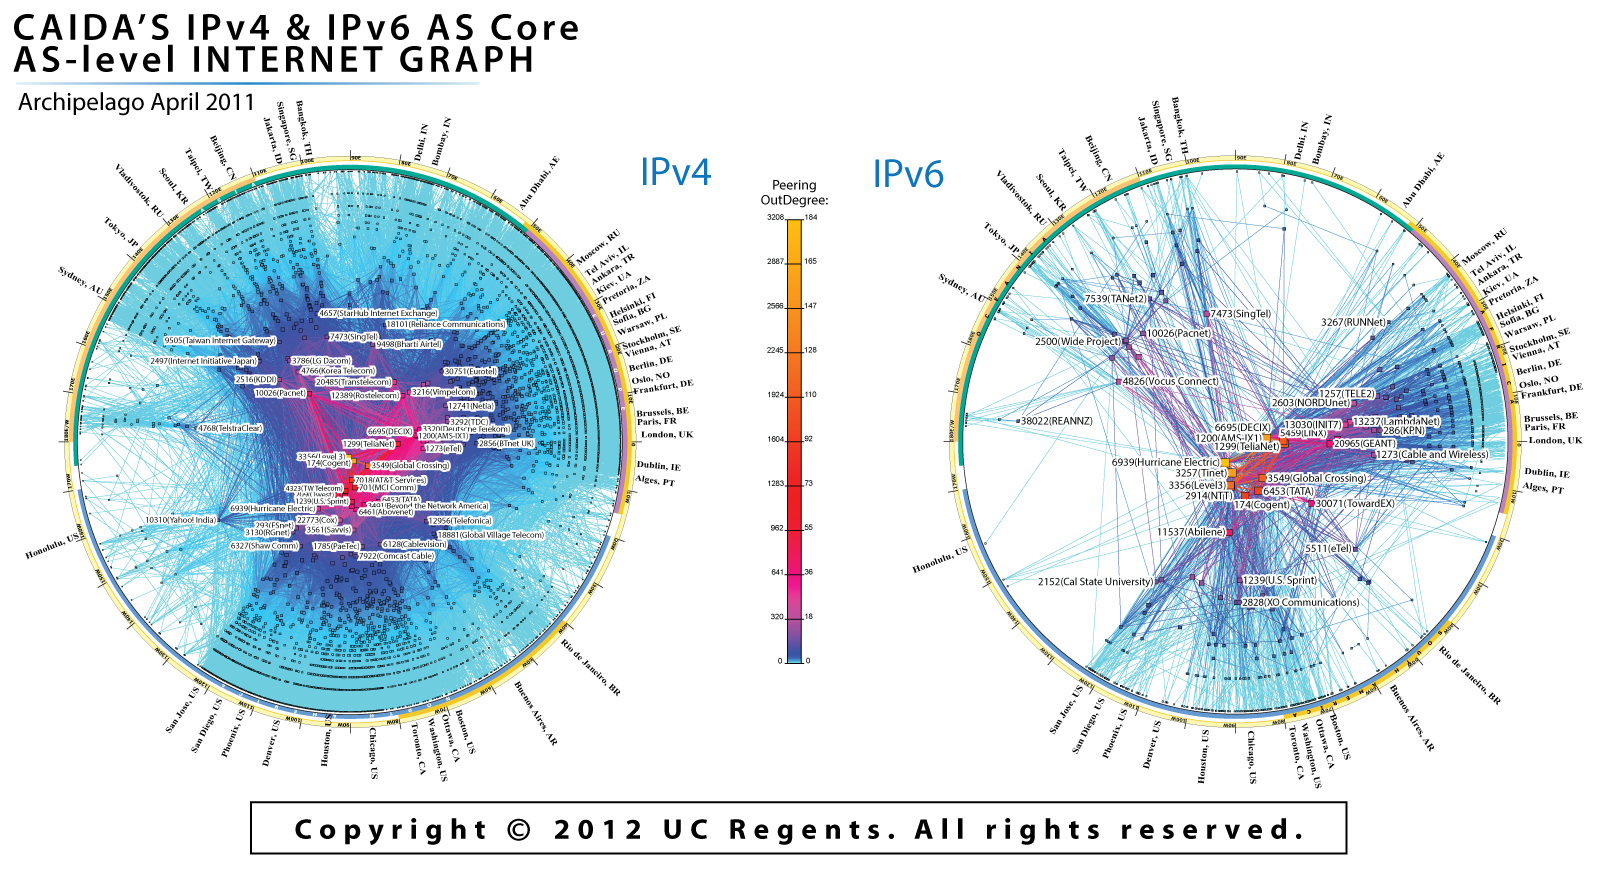
April 2011 IPv4 & IPv6
-
August 2010 IPv4 & IPv6
-
January 2009 IPv4 & IPv6
-
January 2008 IPv4 & IPv6
-
April 2005 IPv4 & IPv6
-
August 2007 IPv4
-
March 2005 IPv6
-
April 2003
-
April 2002
-
December 2000


Infosheets
Over time, CAIDA has produced "infosheets", small double-sided flyers or handouts that give a brief overview of our efforts in a compact distributable format.
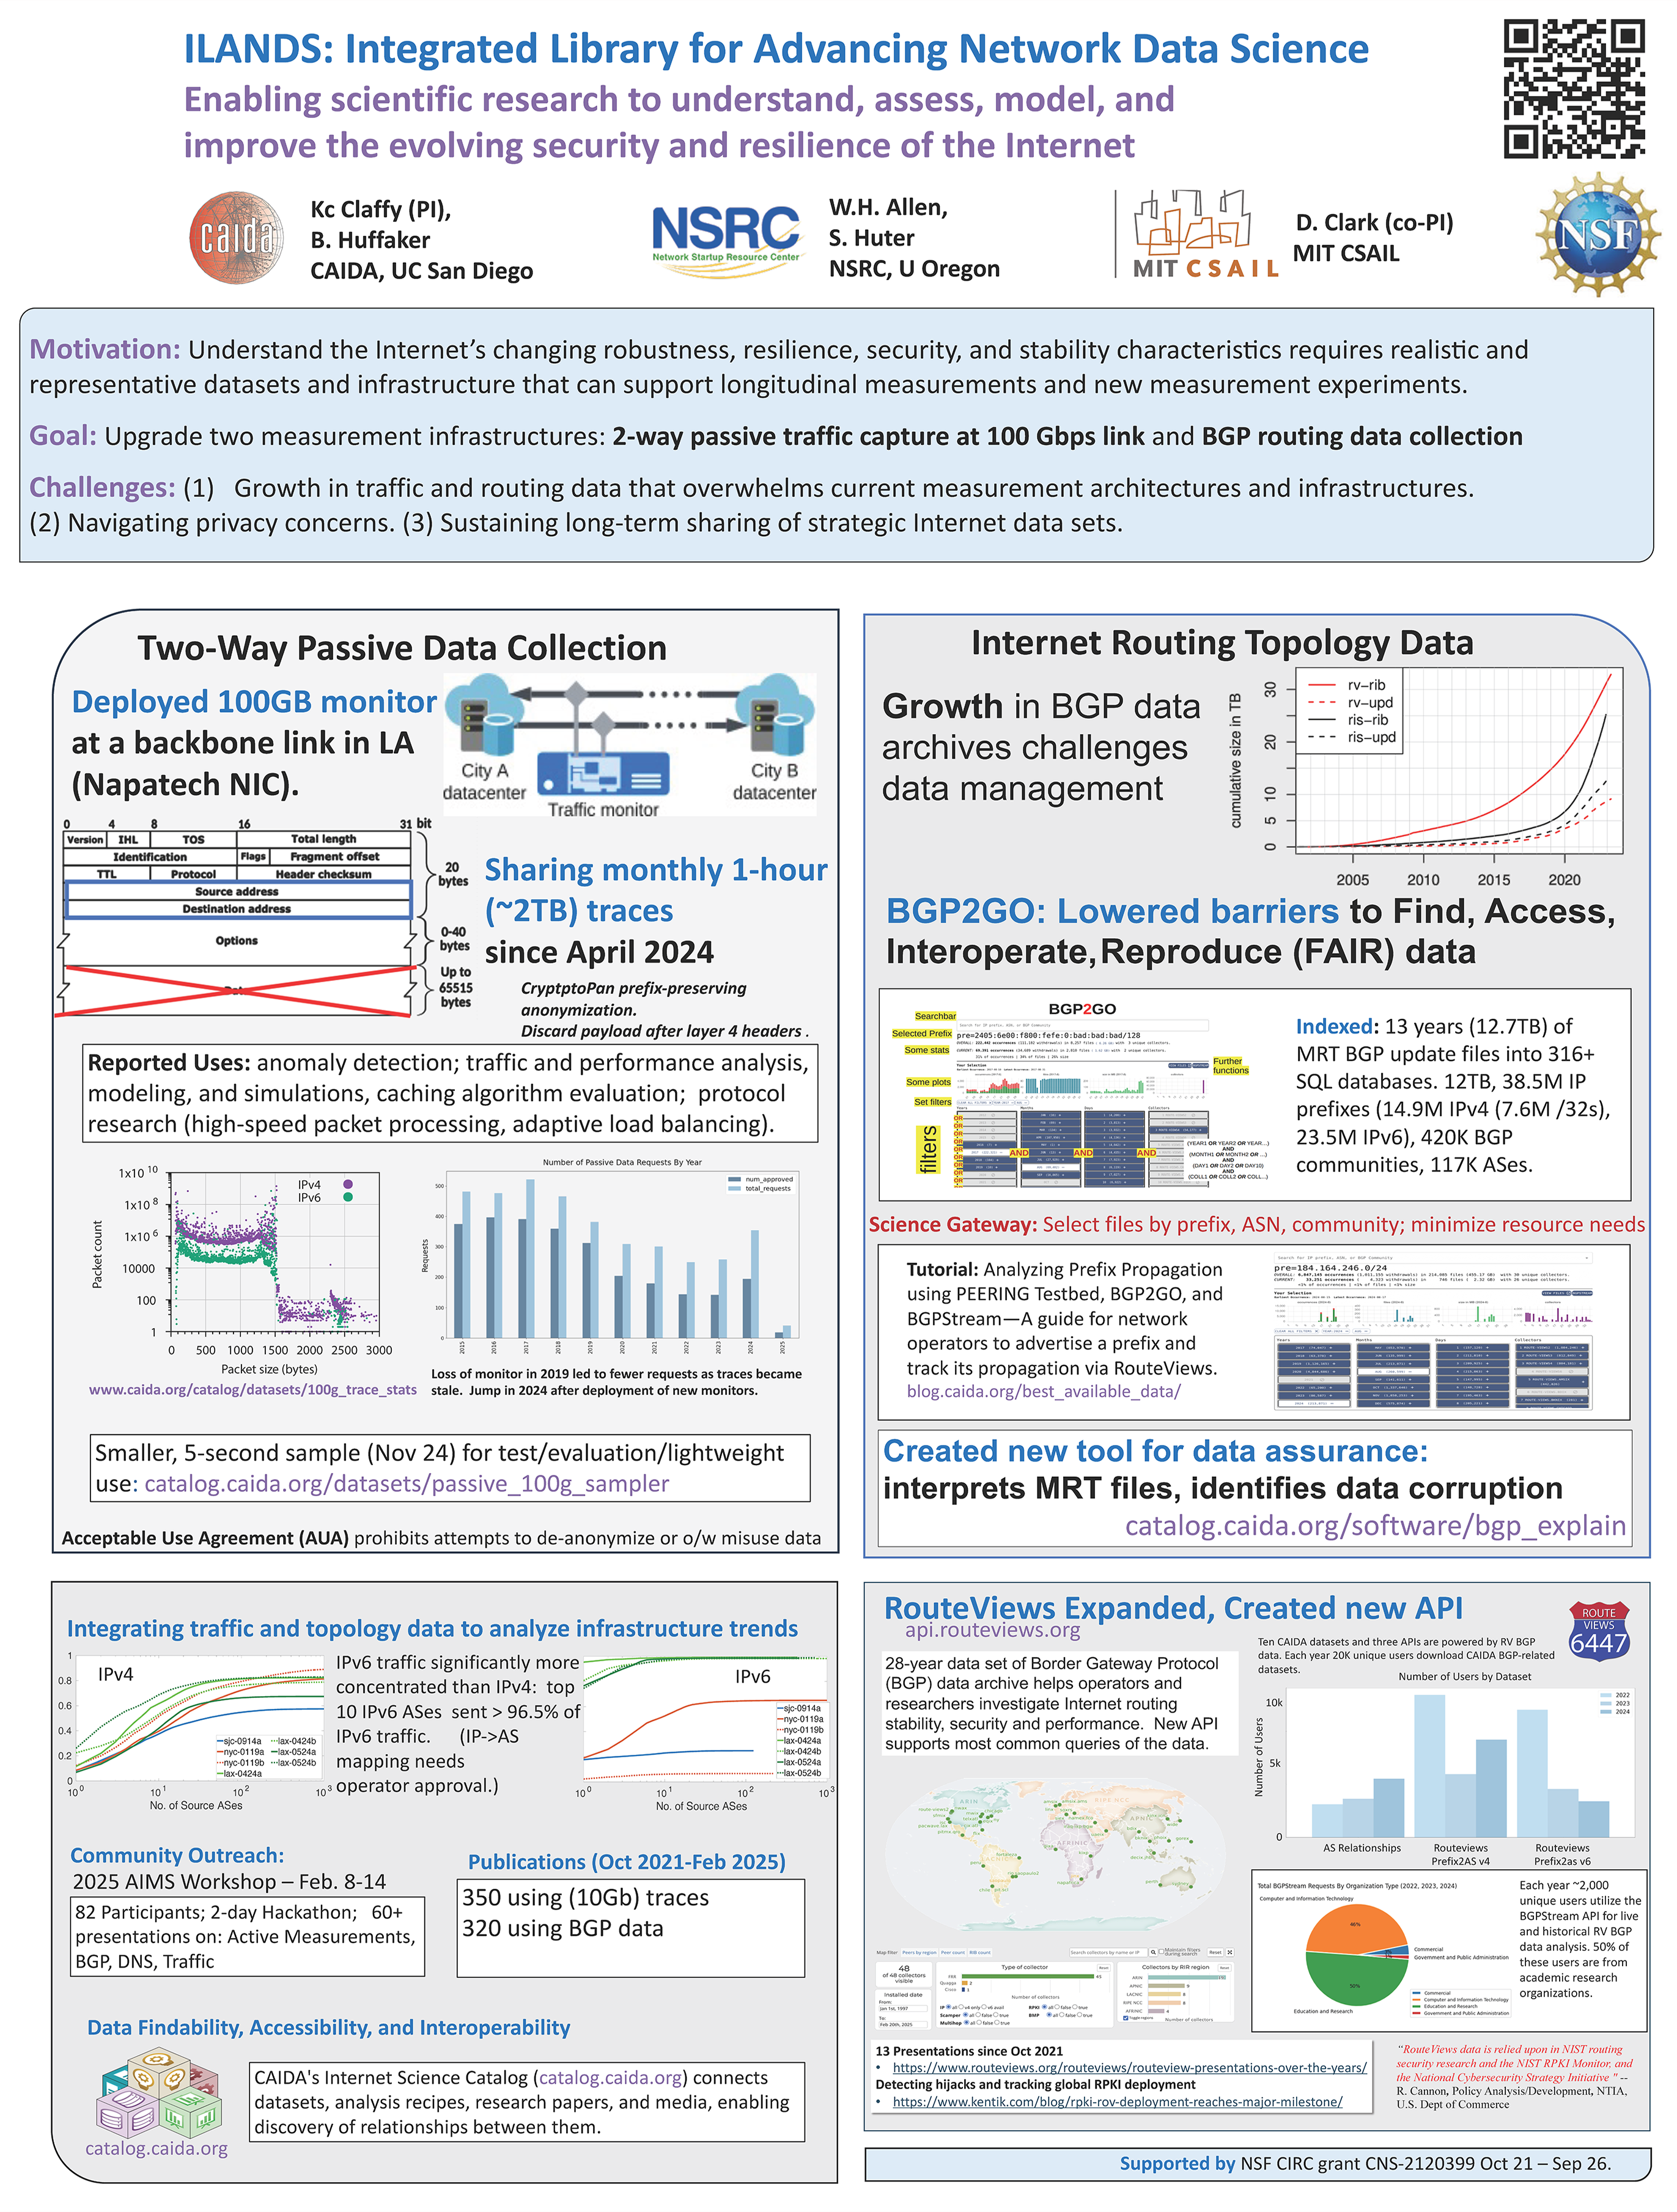
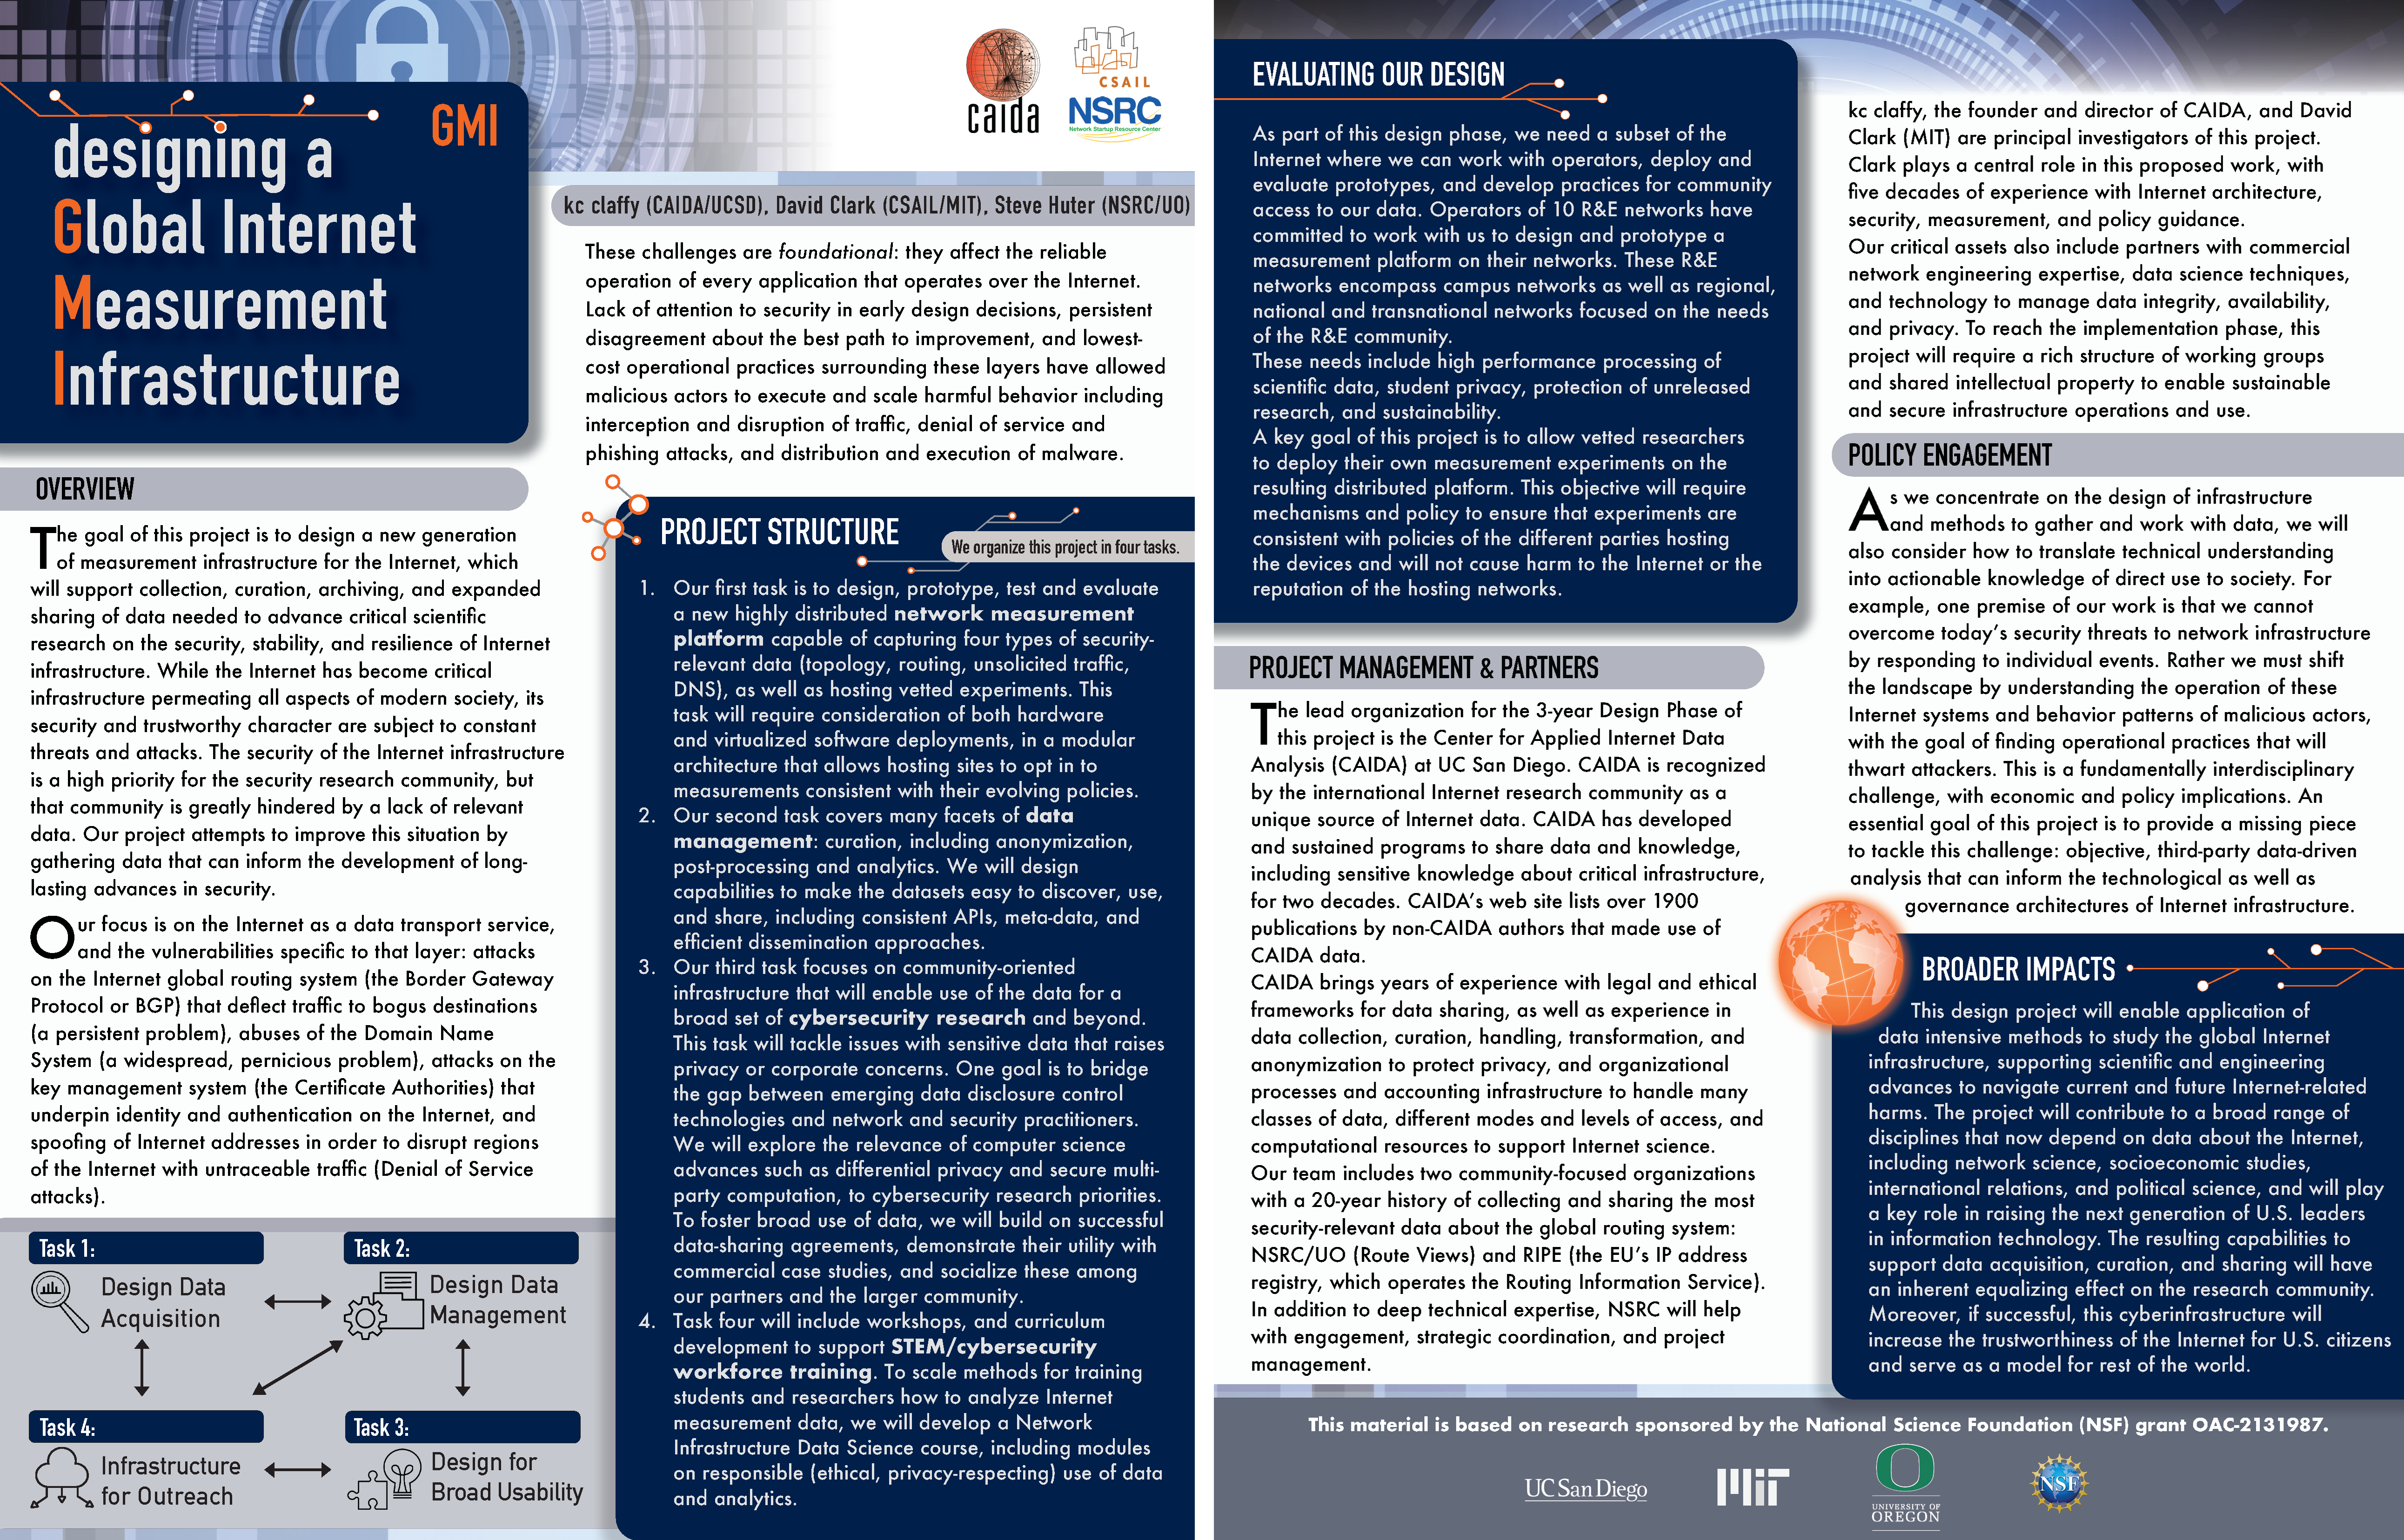

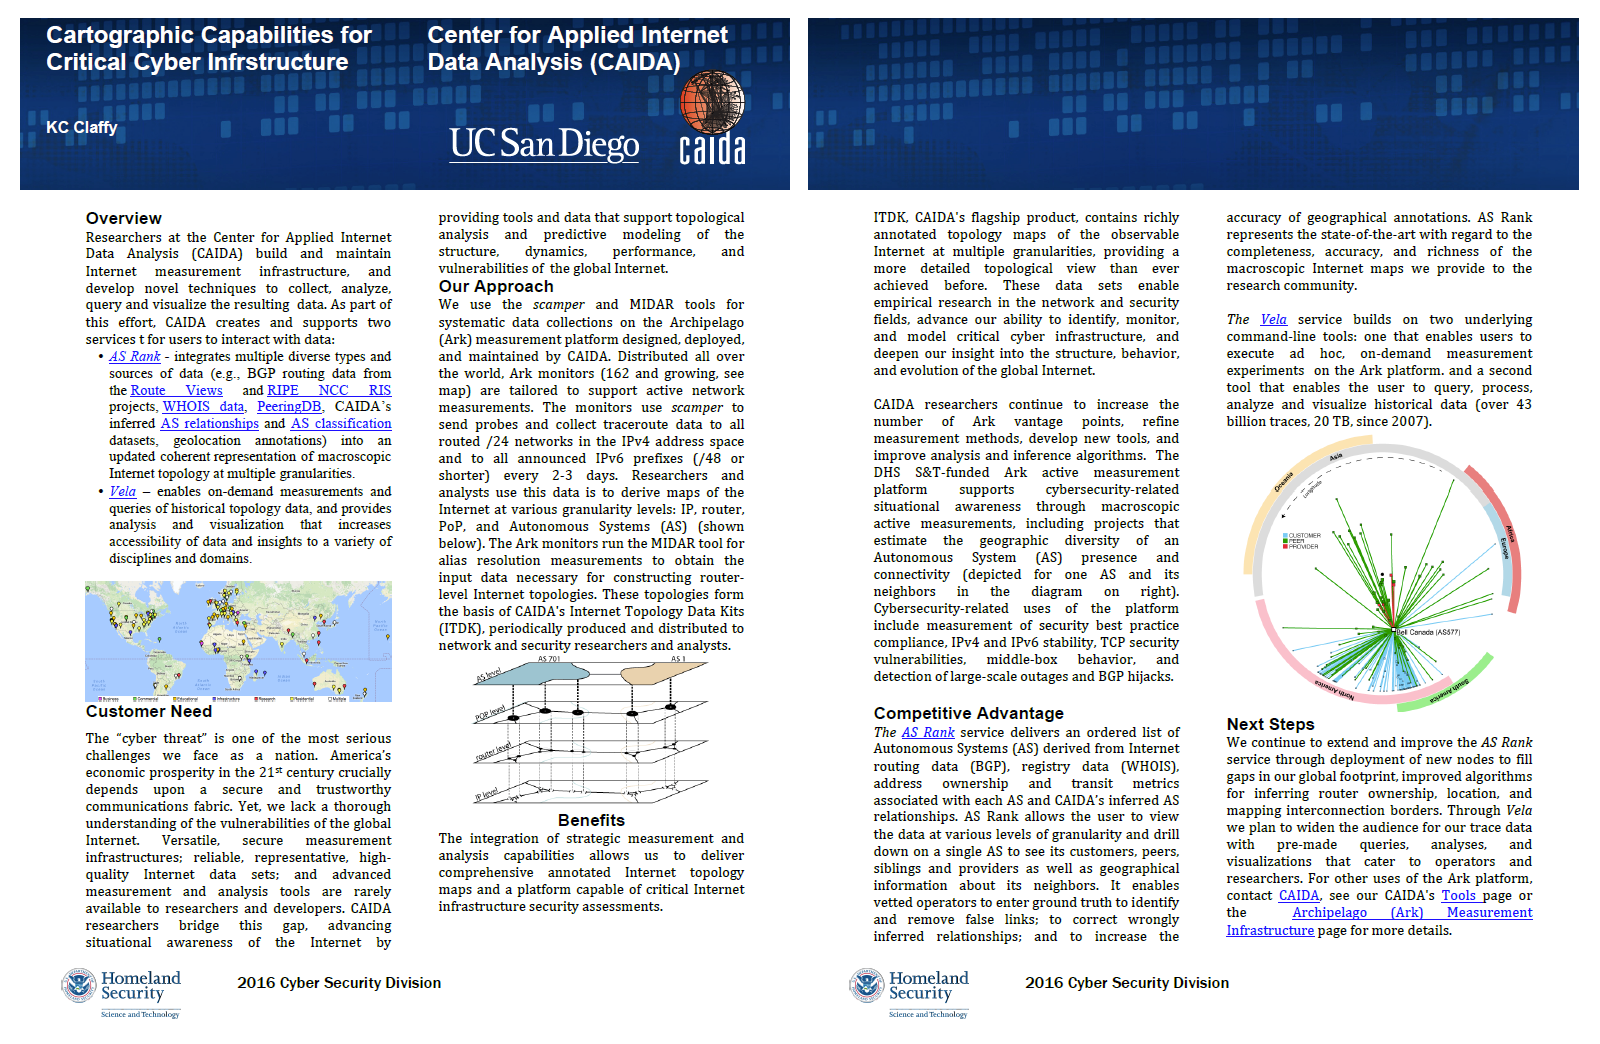
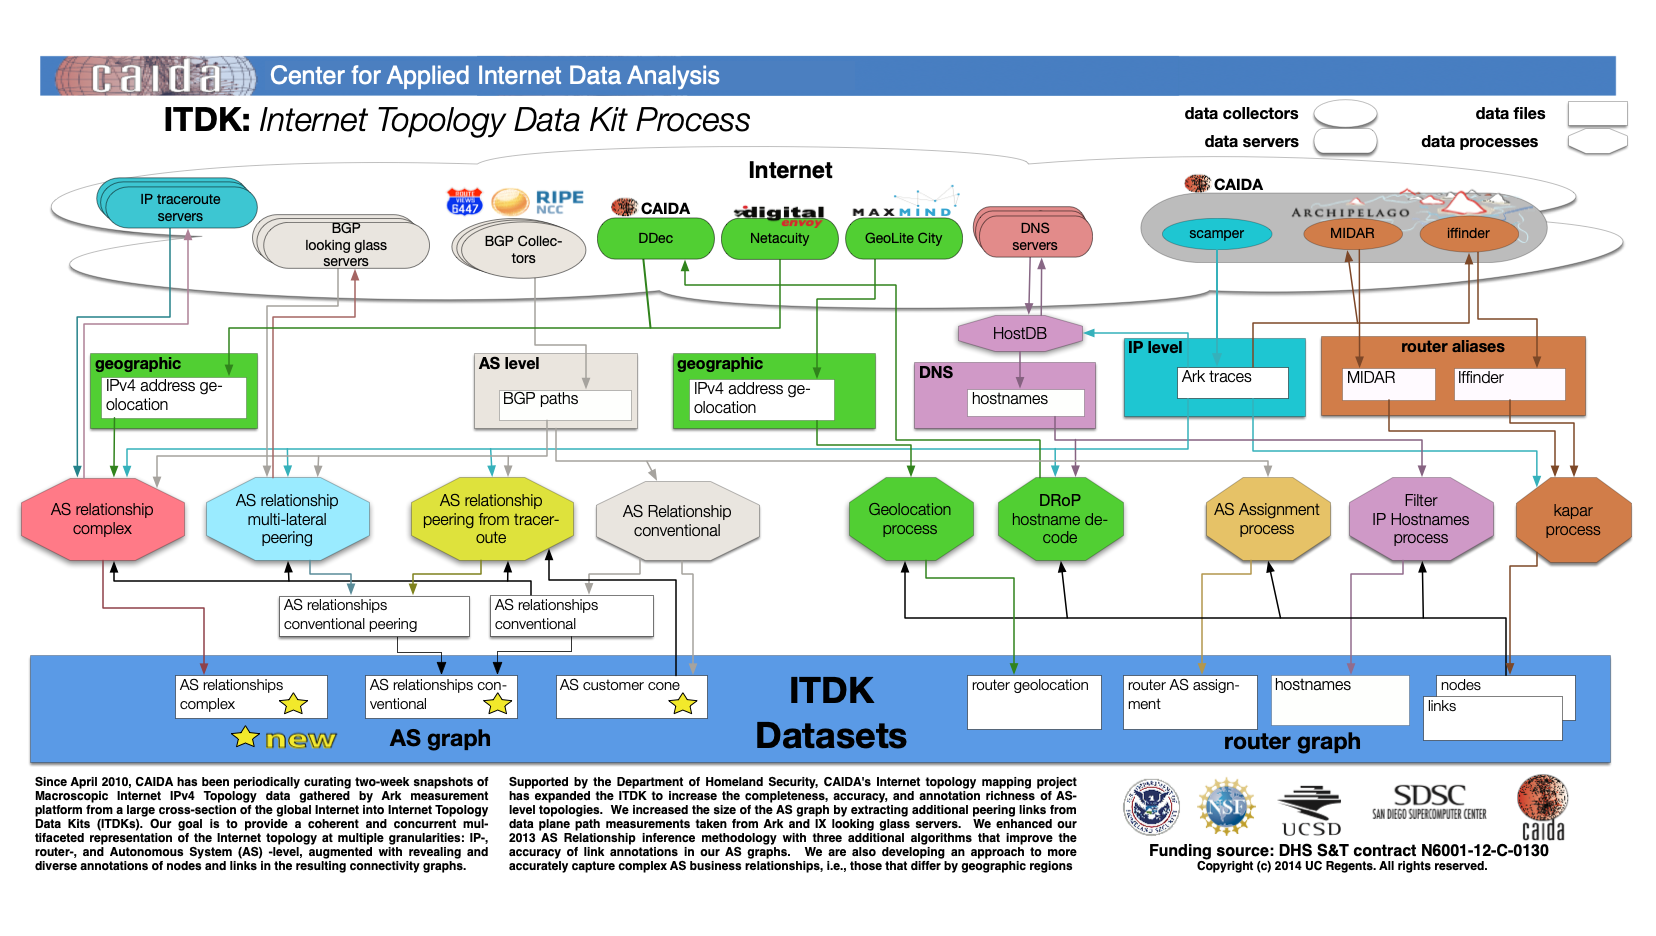
Infrastructure Posters
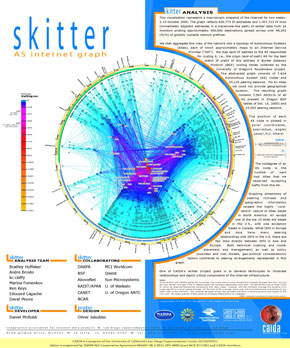
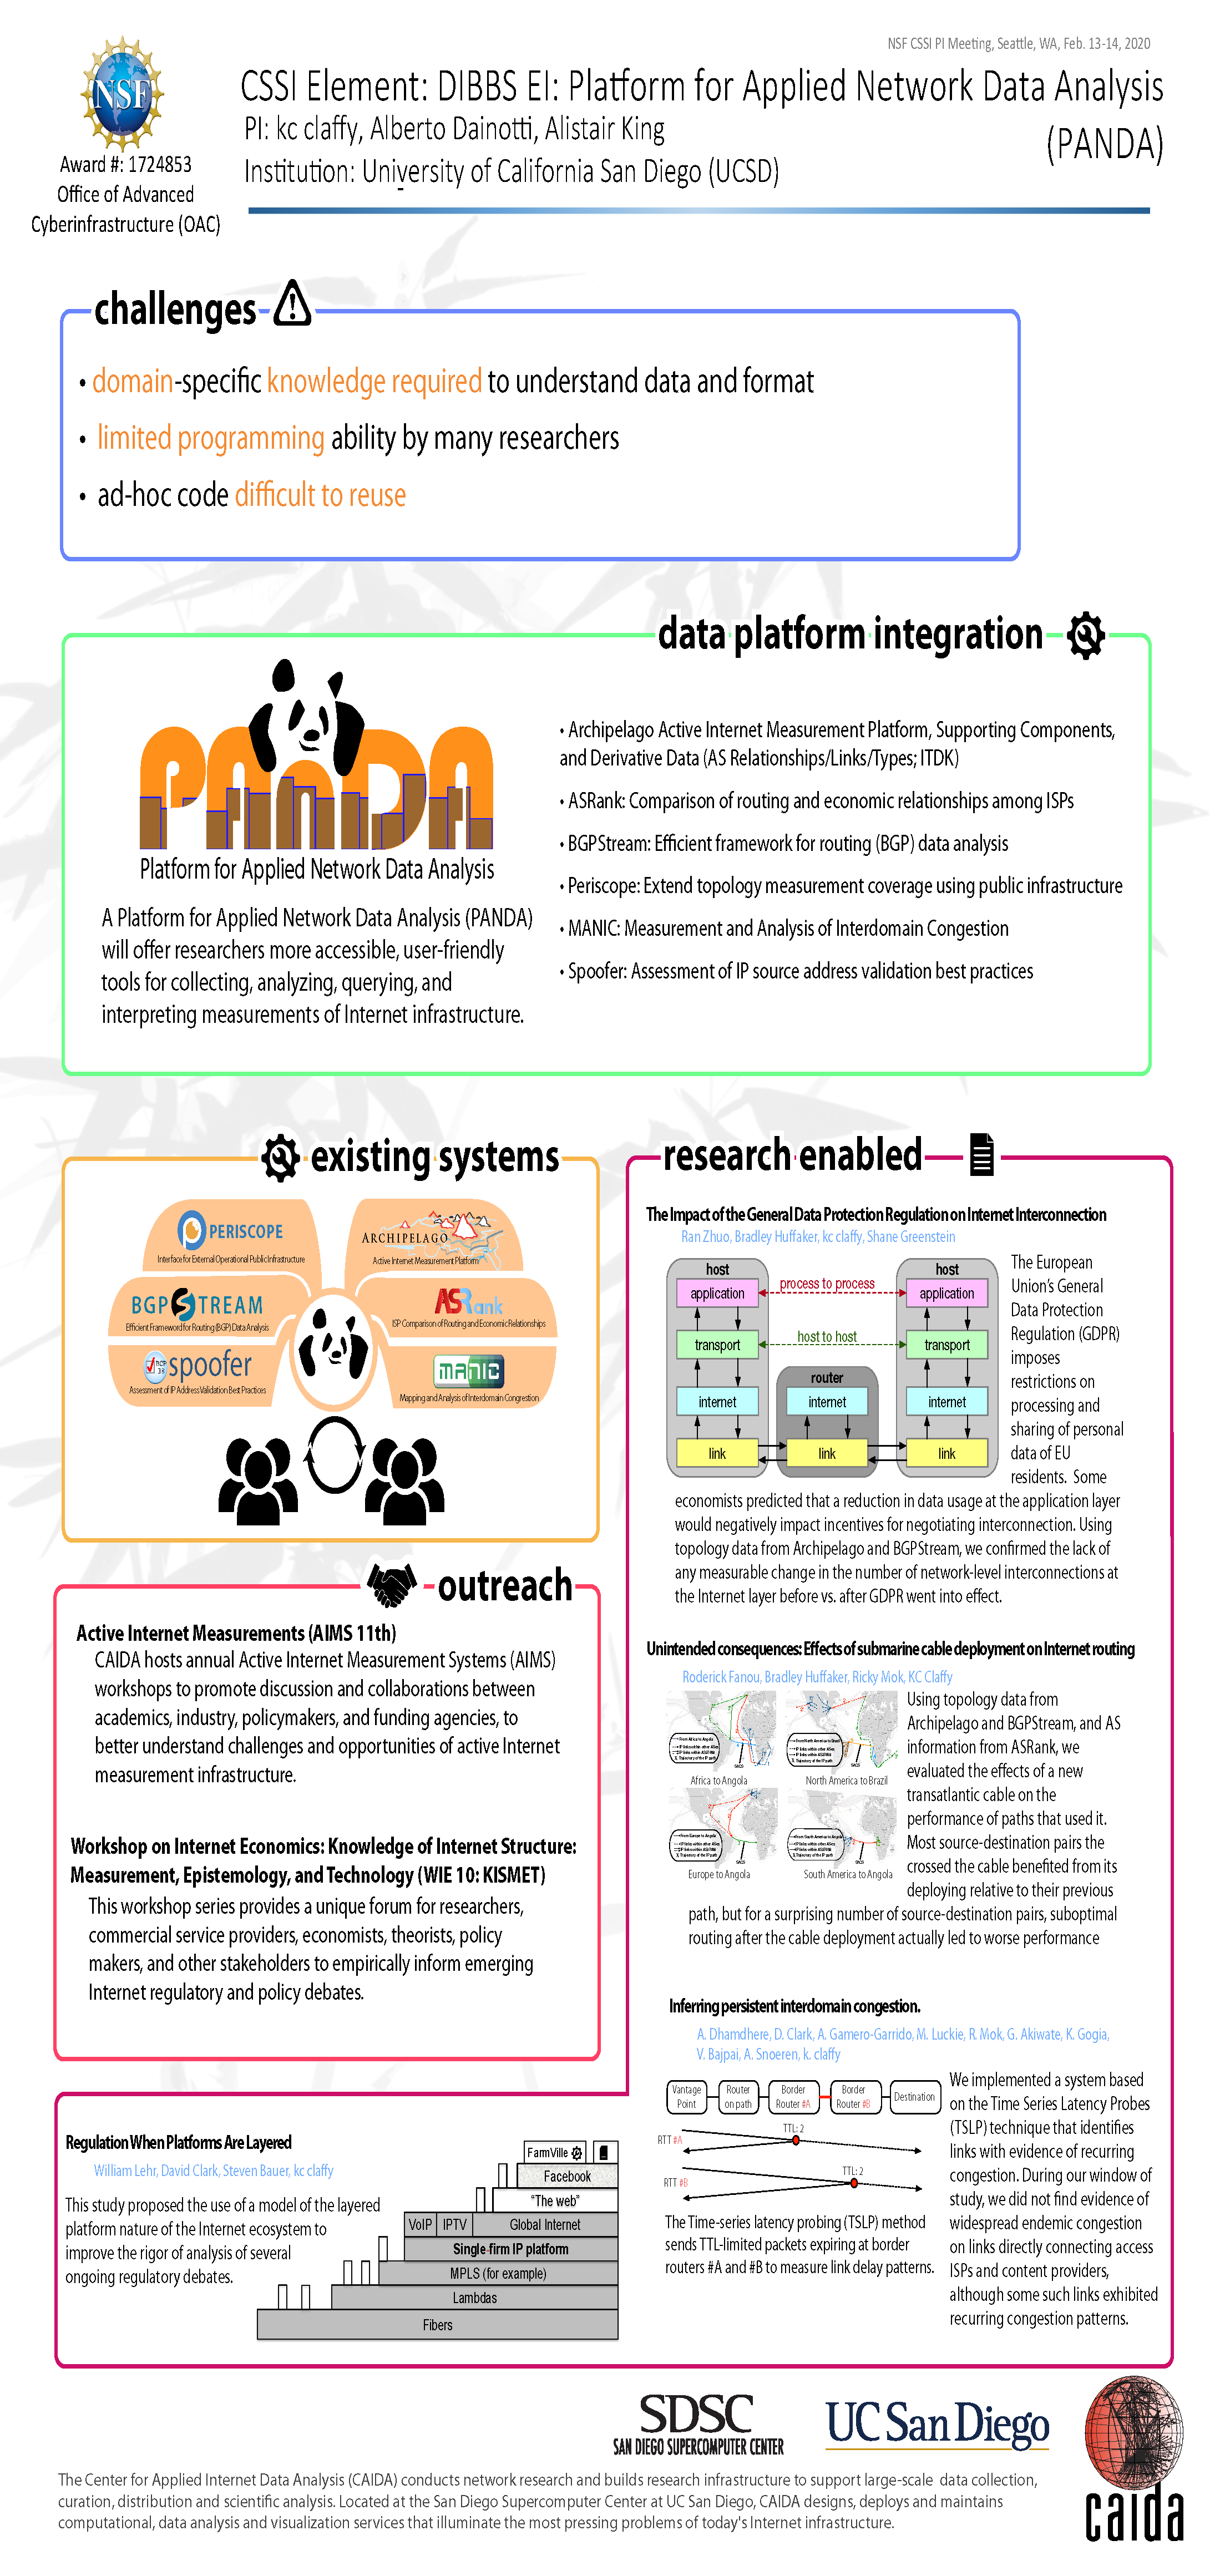
Posters detailing the data collection infrastructures used at CAIDA. Archipelago (Ark
for short) is CAIDA's next-generation active measurement
infrastructure and represents an evolution of the skitter
infrastructure that has been serving the network research community
for more than 8 years. For more information, see the Archipelago Measurement Infrastructure.

Security Posters
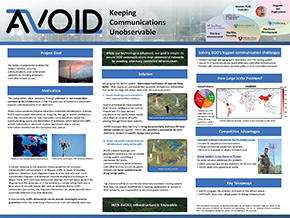
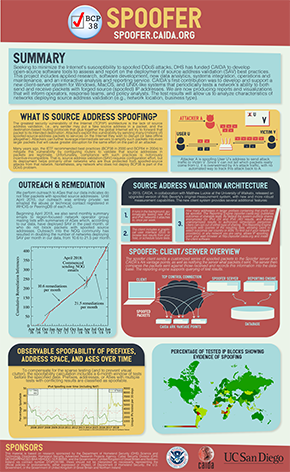
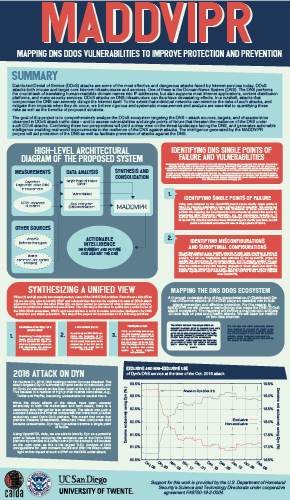
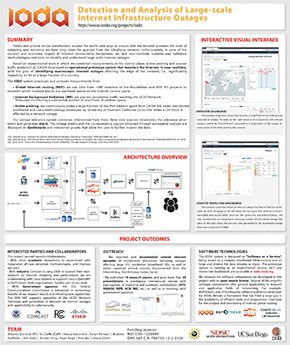
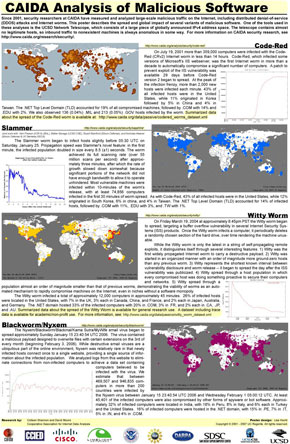
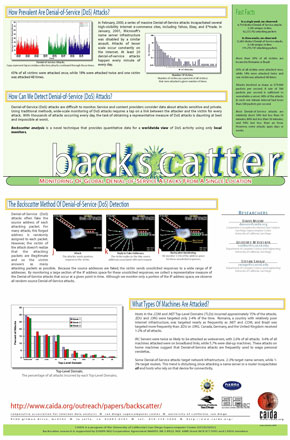
Security research
at CAIDA includes analysis of network-based attacks e.g.
denial-of-service attacks, data hosting and provision, and
measurement and statistical analysis of the trends and impact that
certain Internet worms and viruses have on the global network
infrastructure.
-
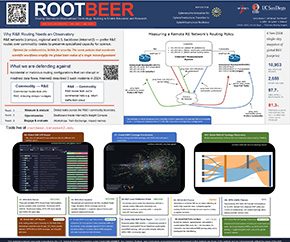
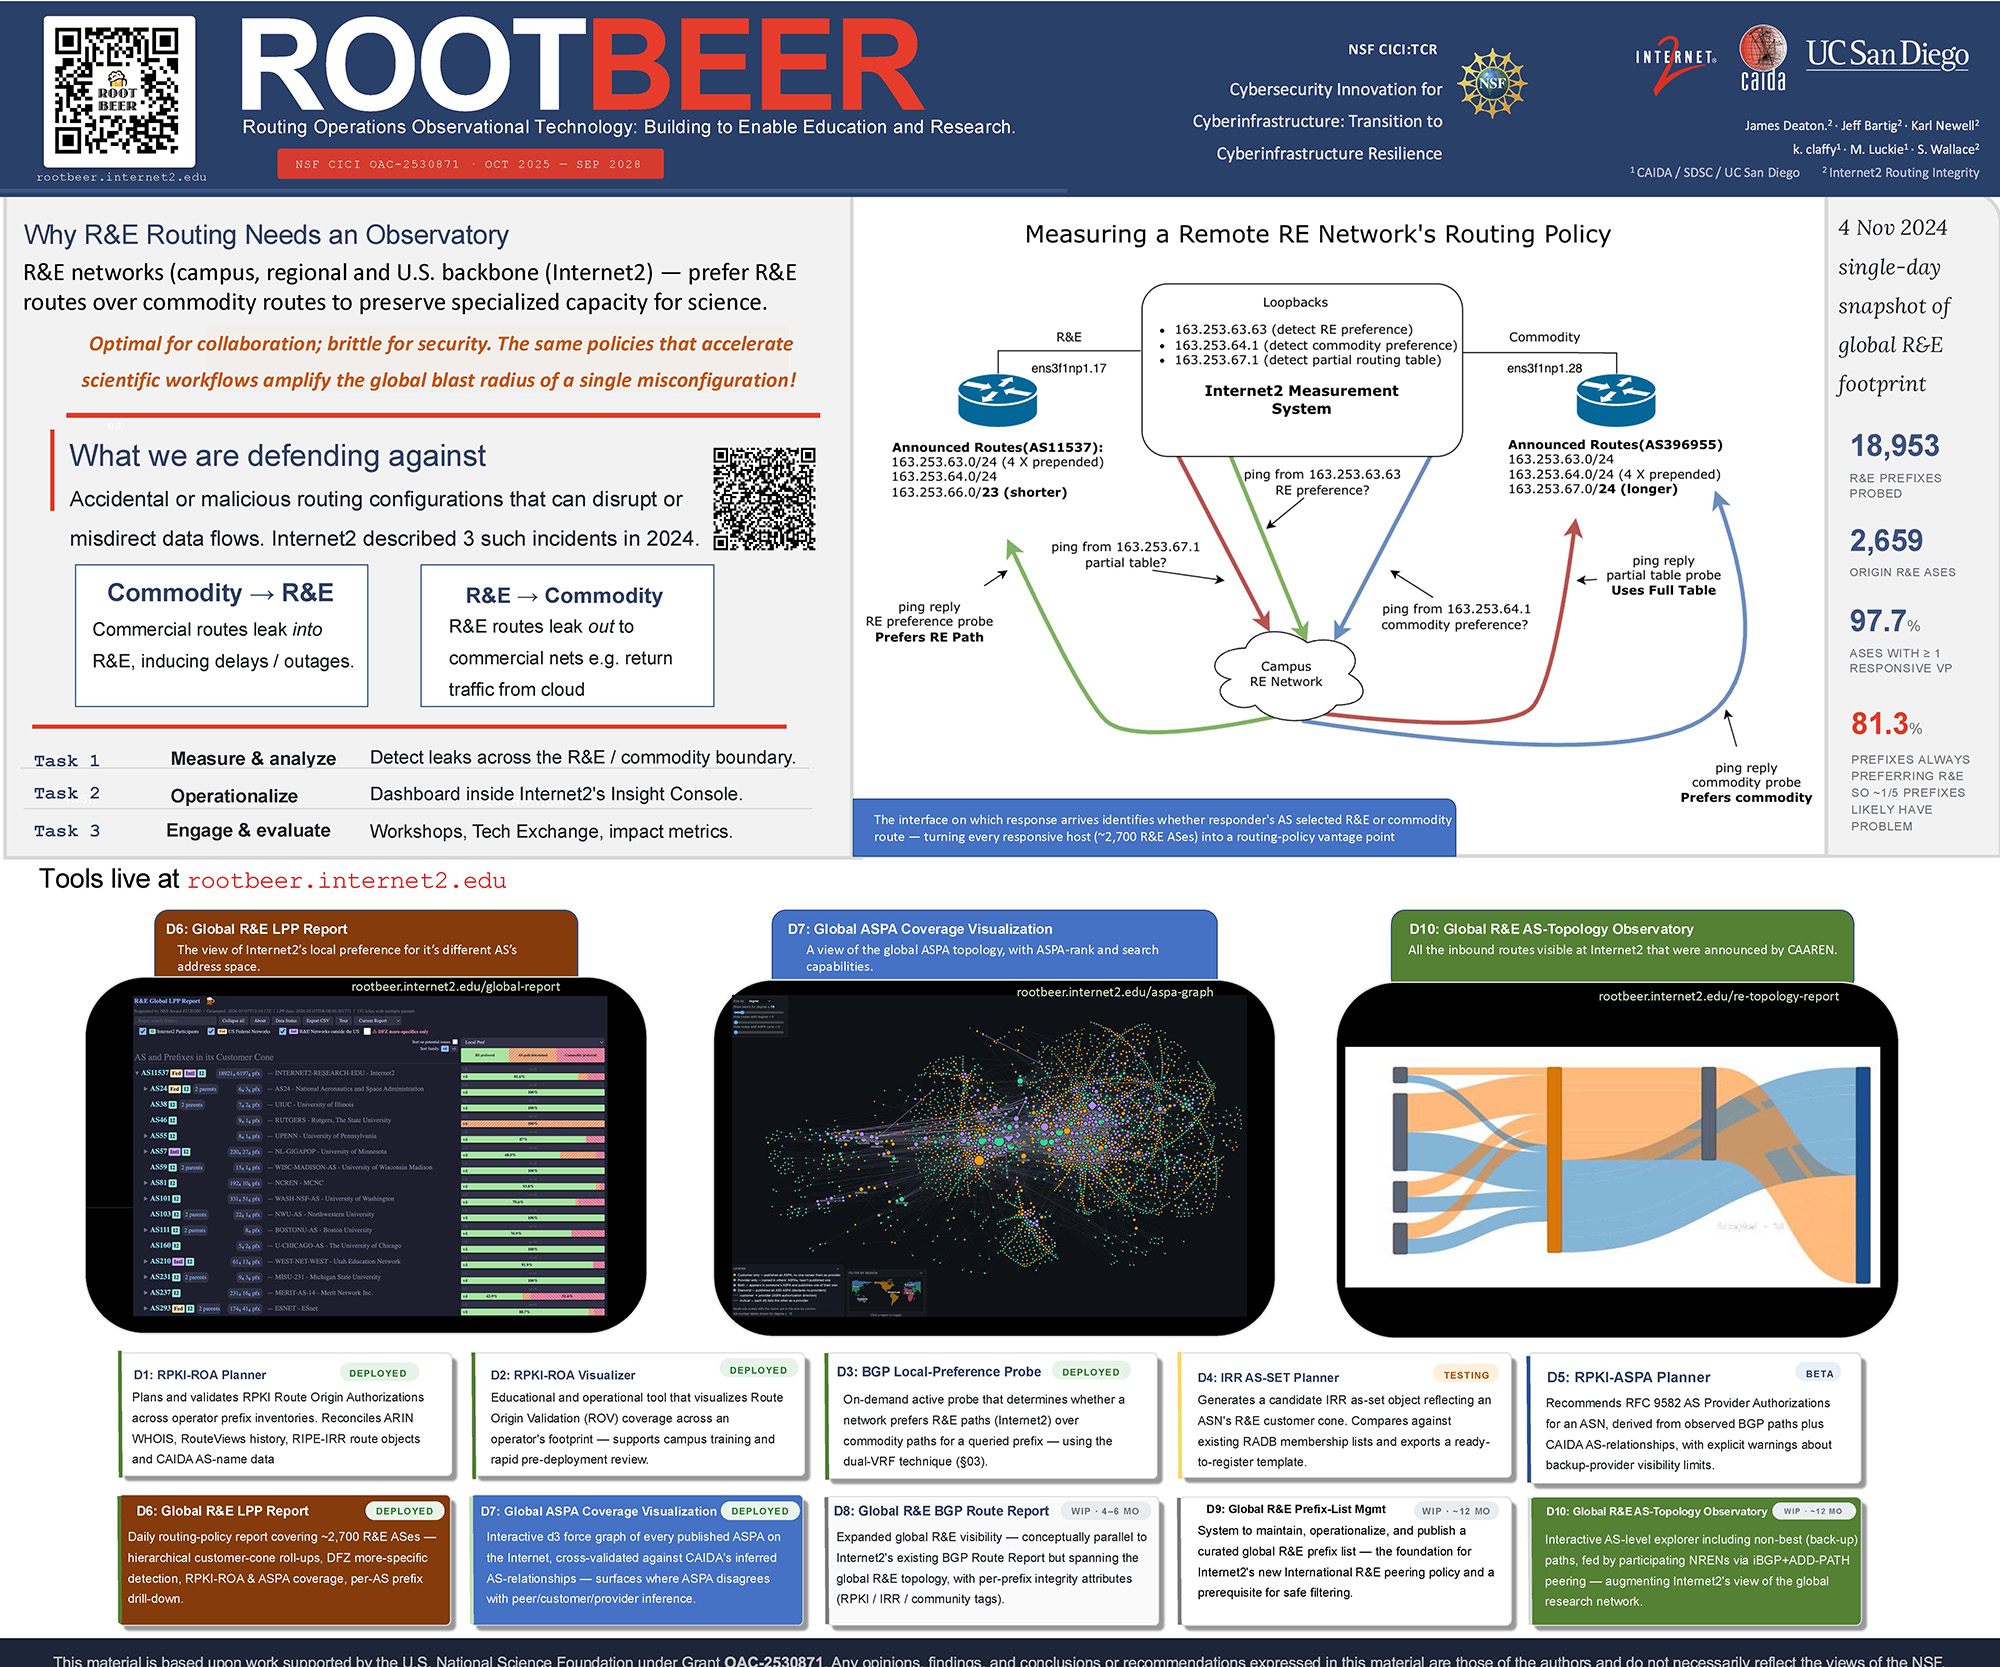
ROOTBEER (2026)
-
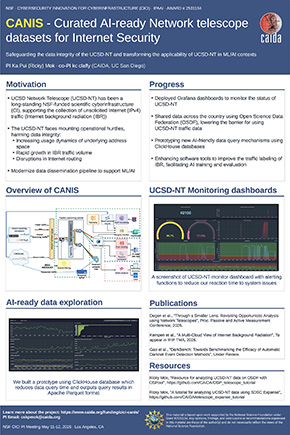
CANIS (2026)
-
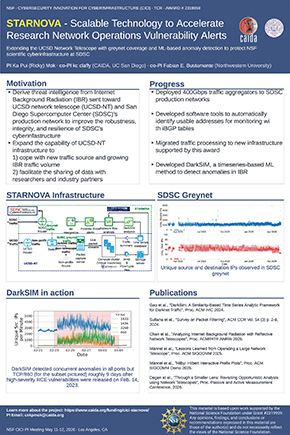
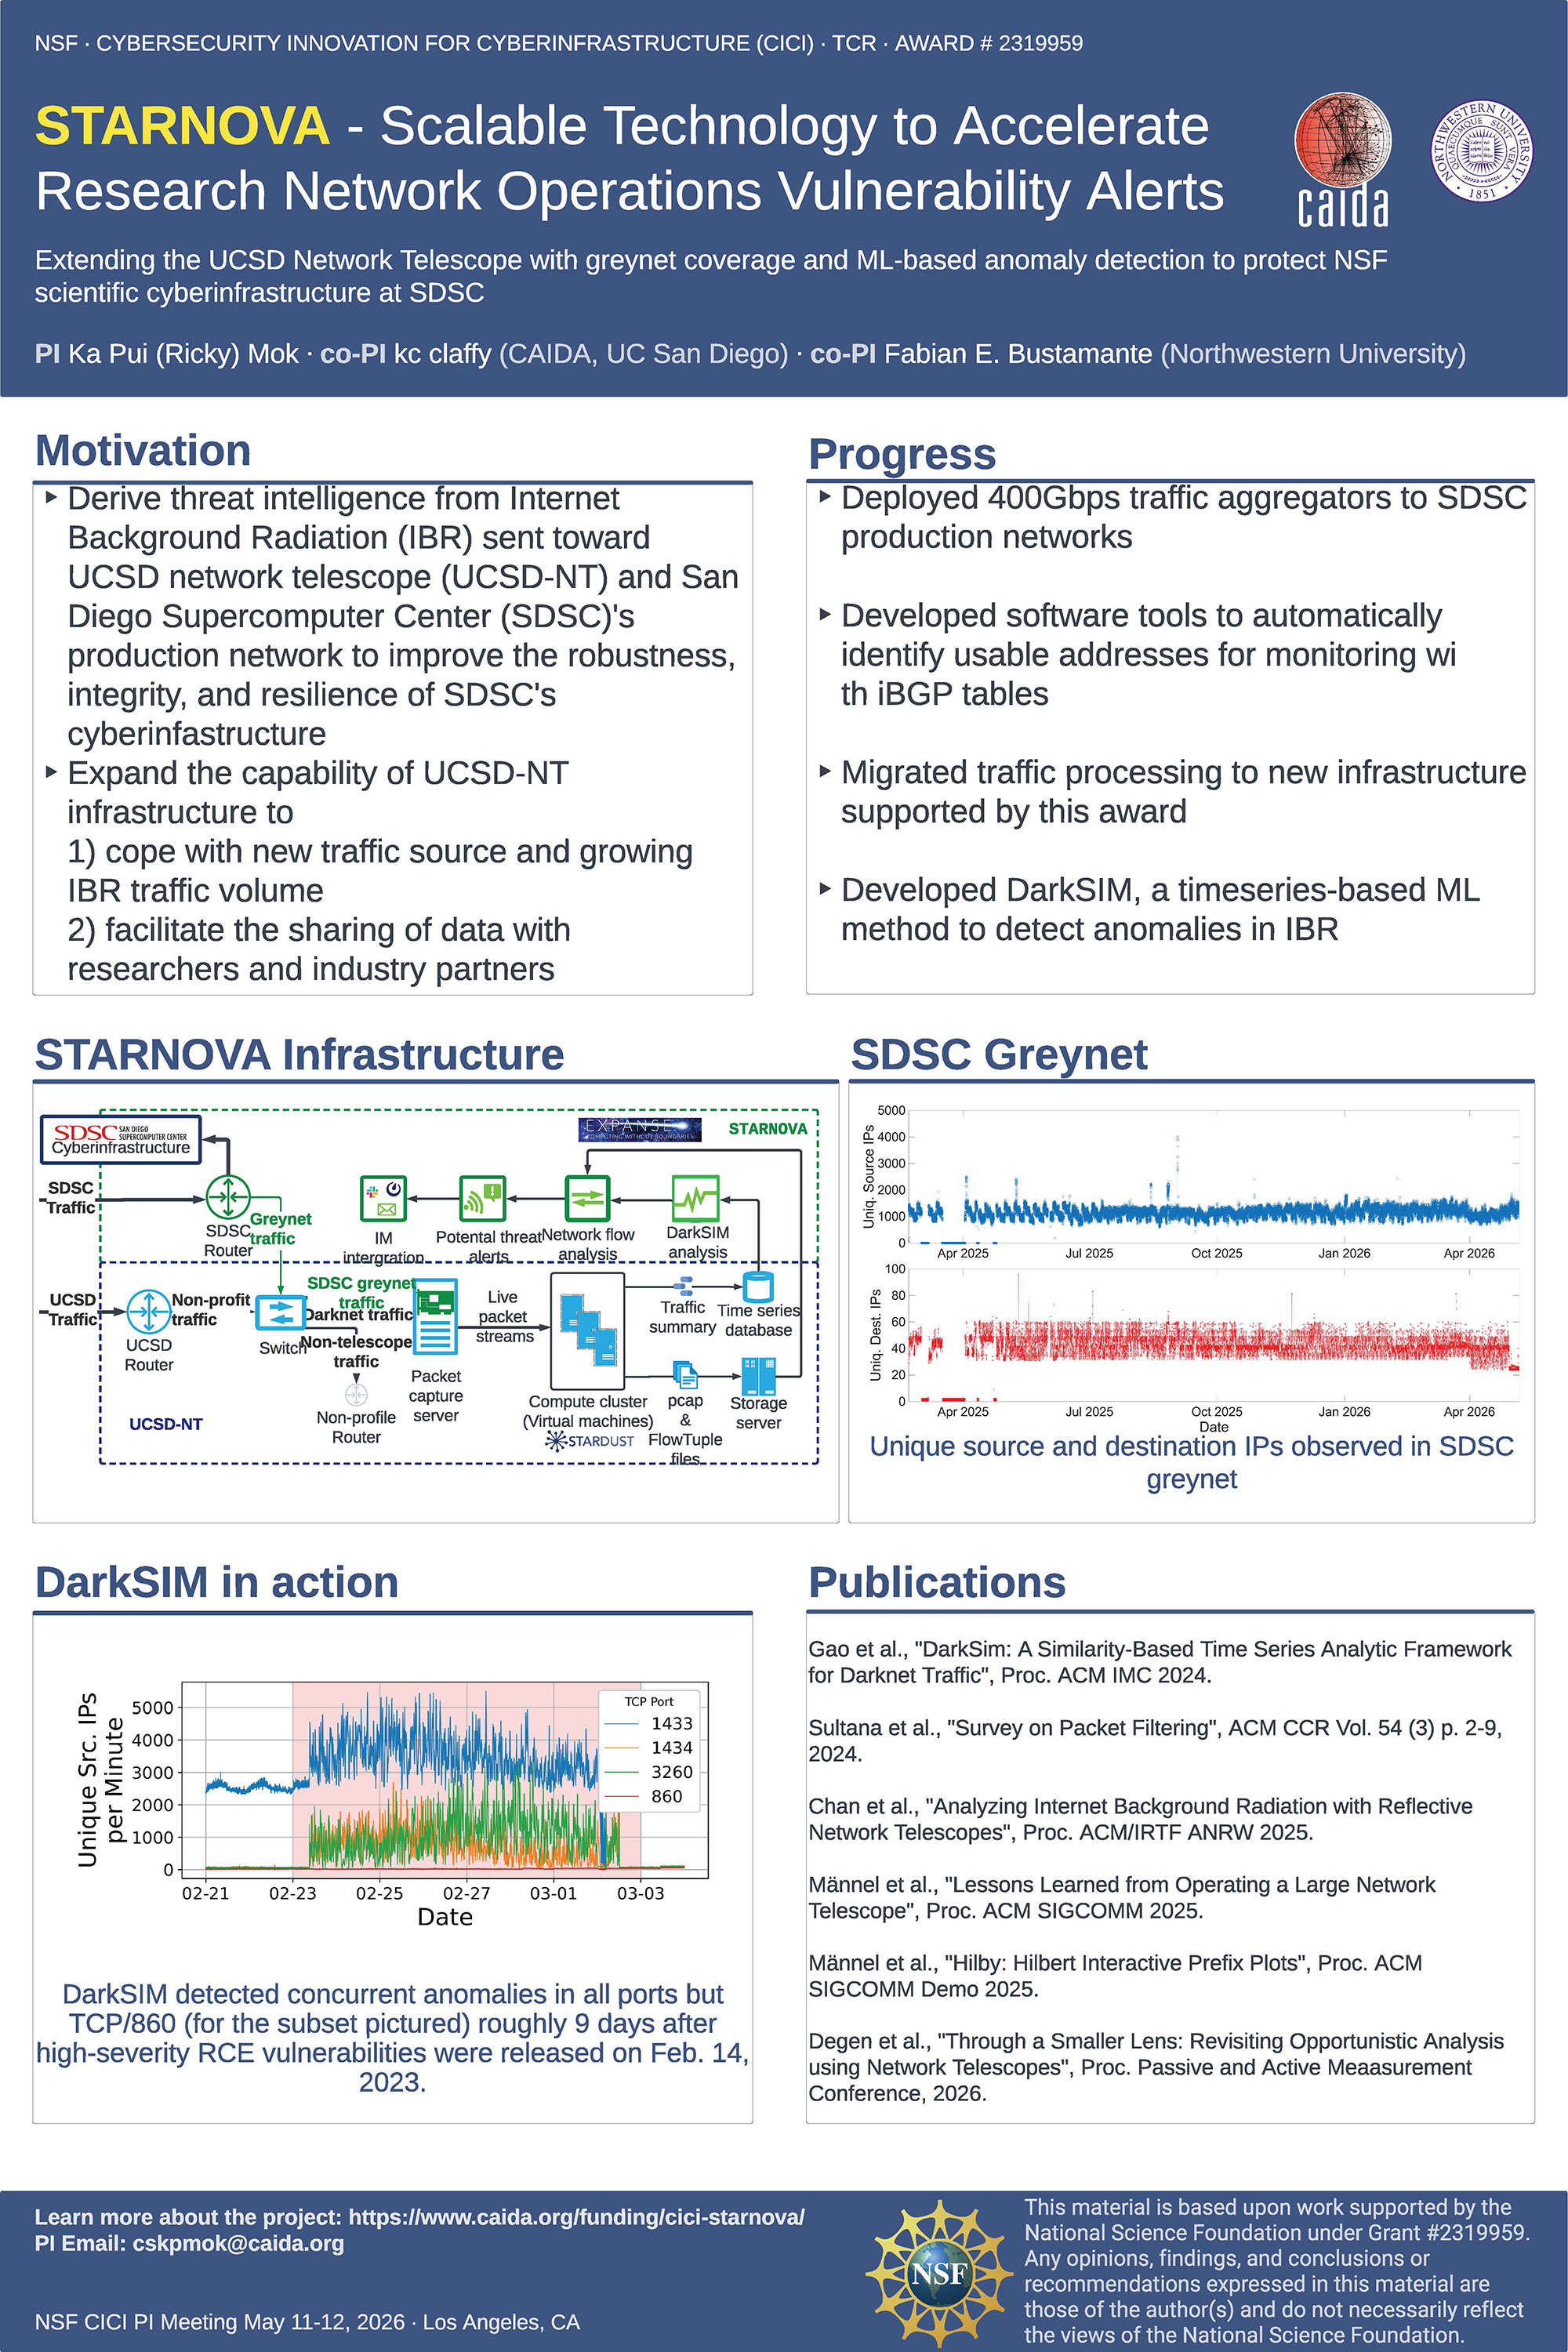
STARNOVA (2026)
-
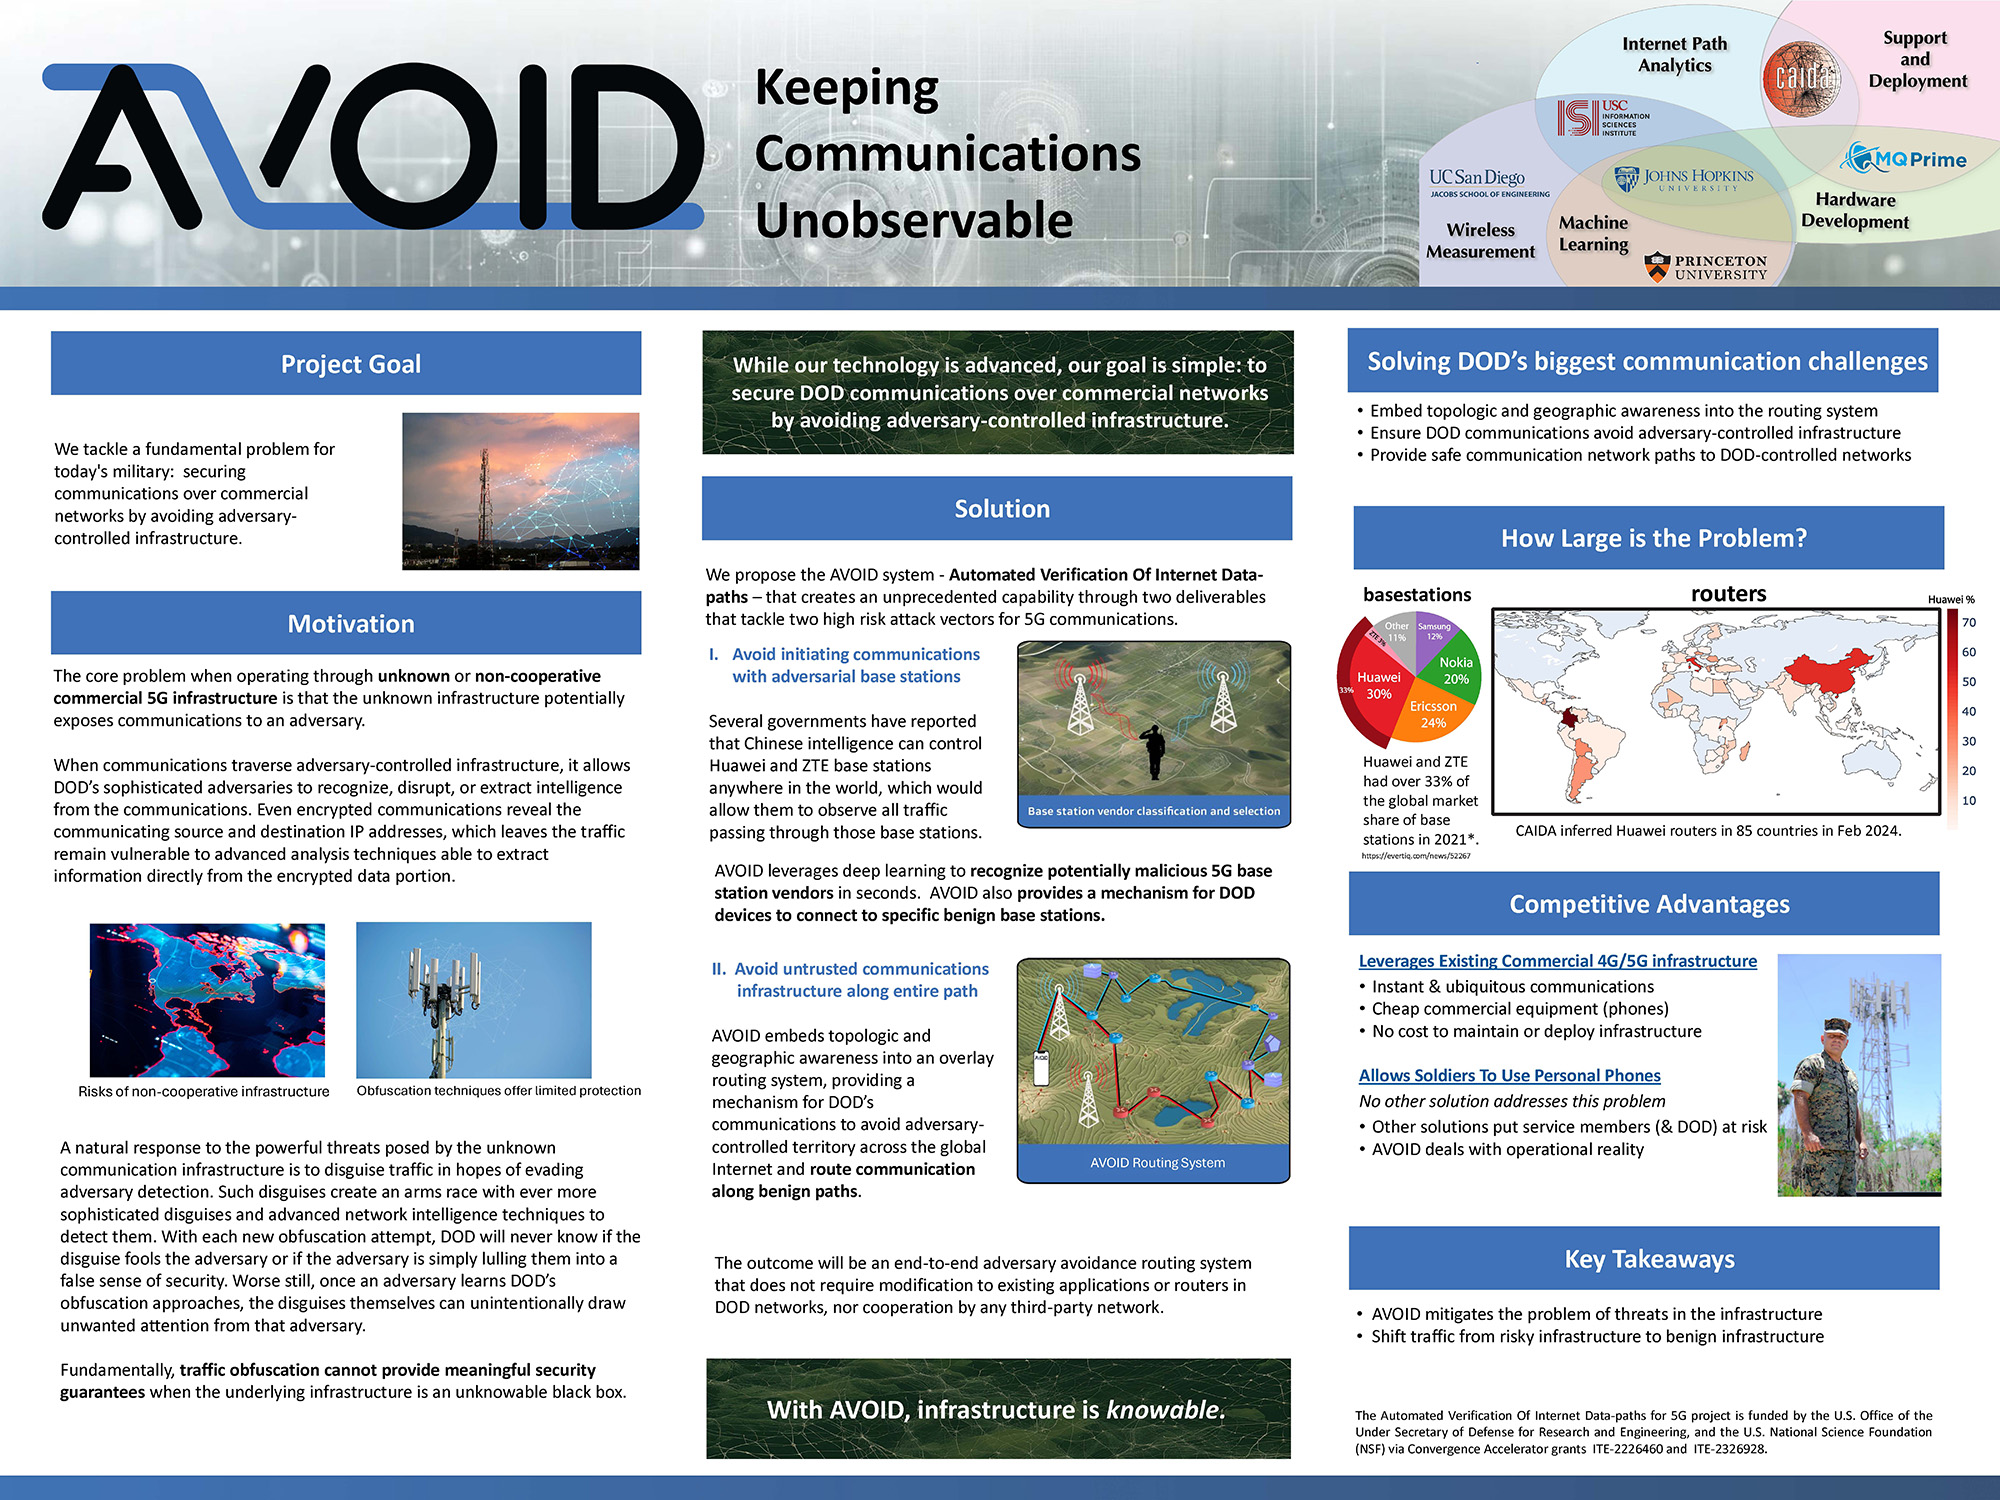
AVOID (2024)
-
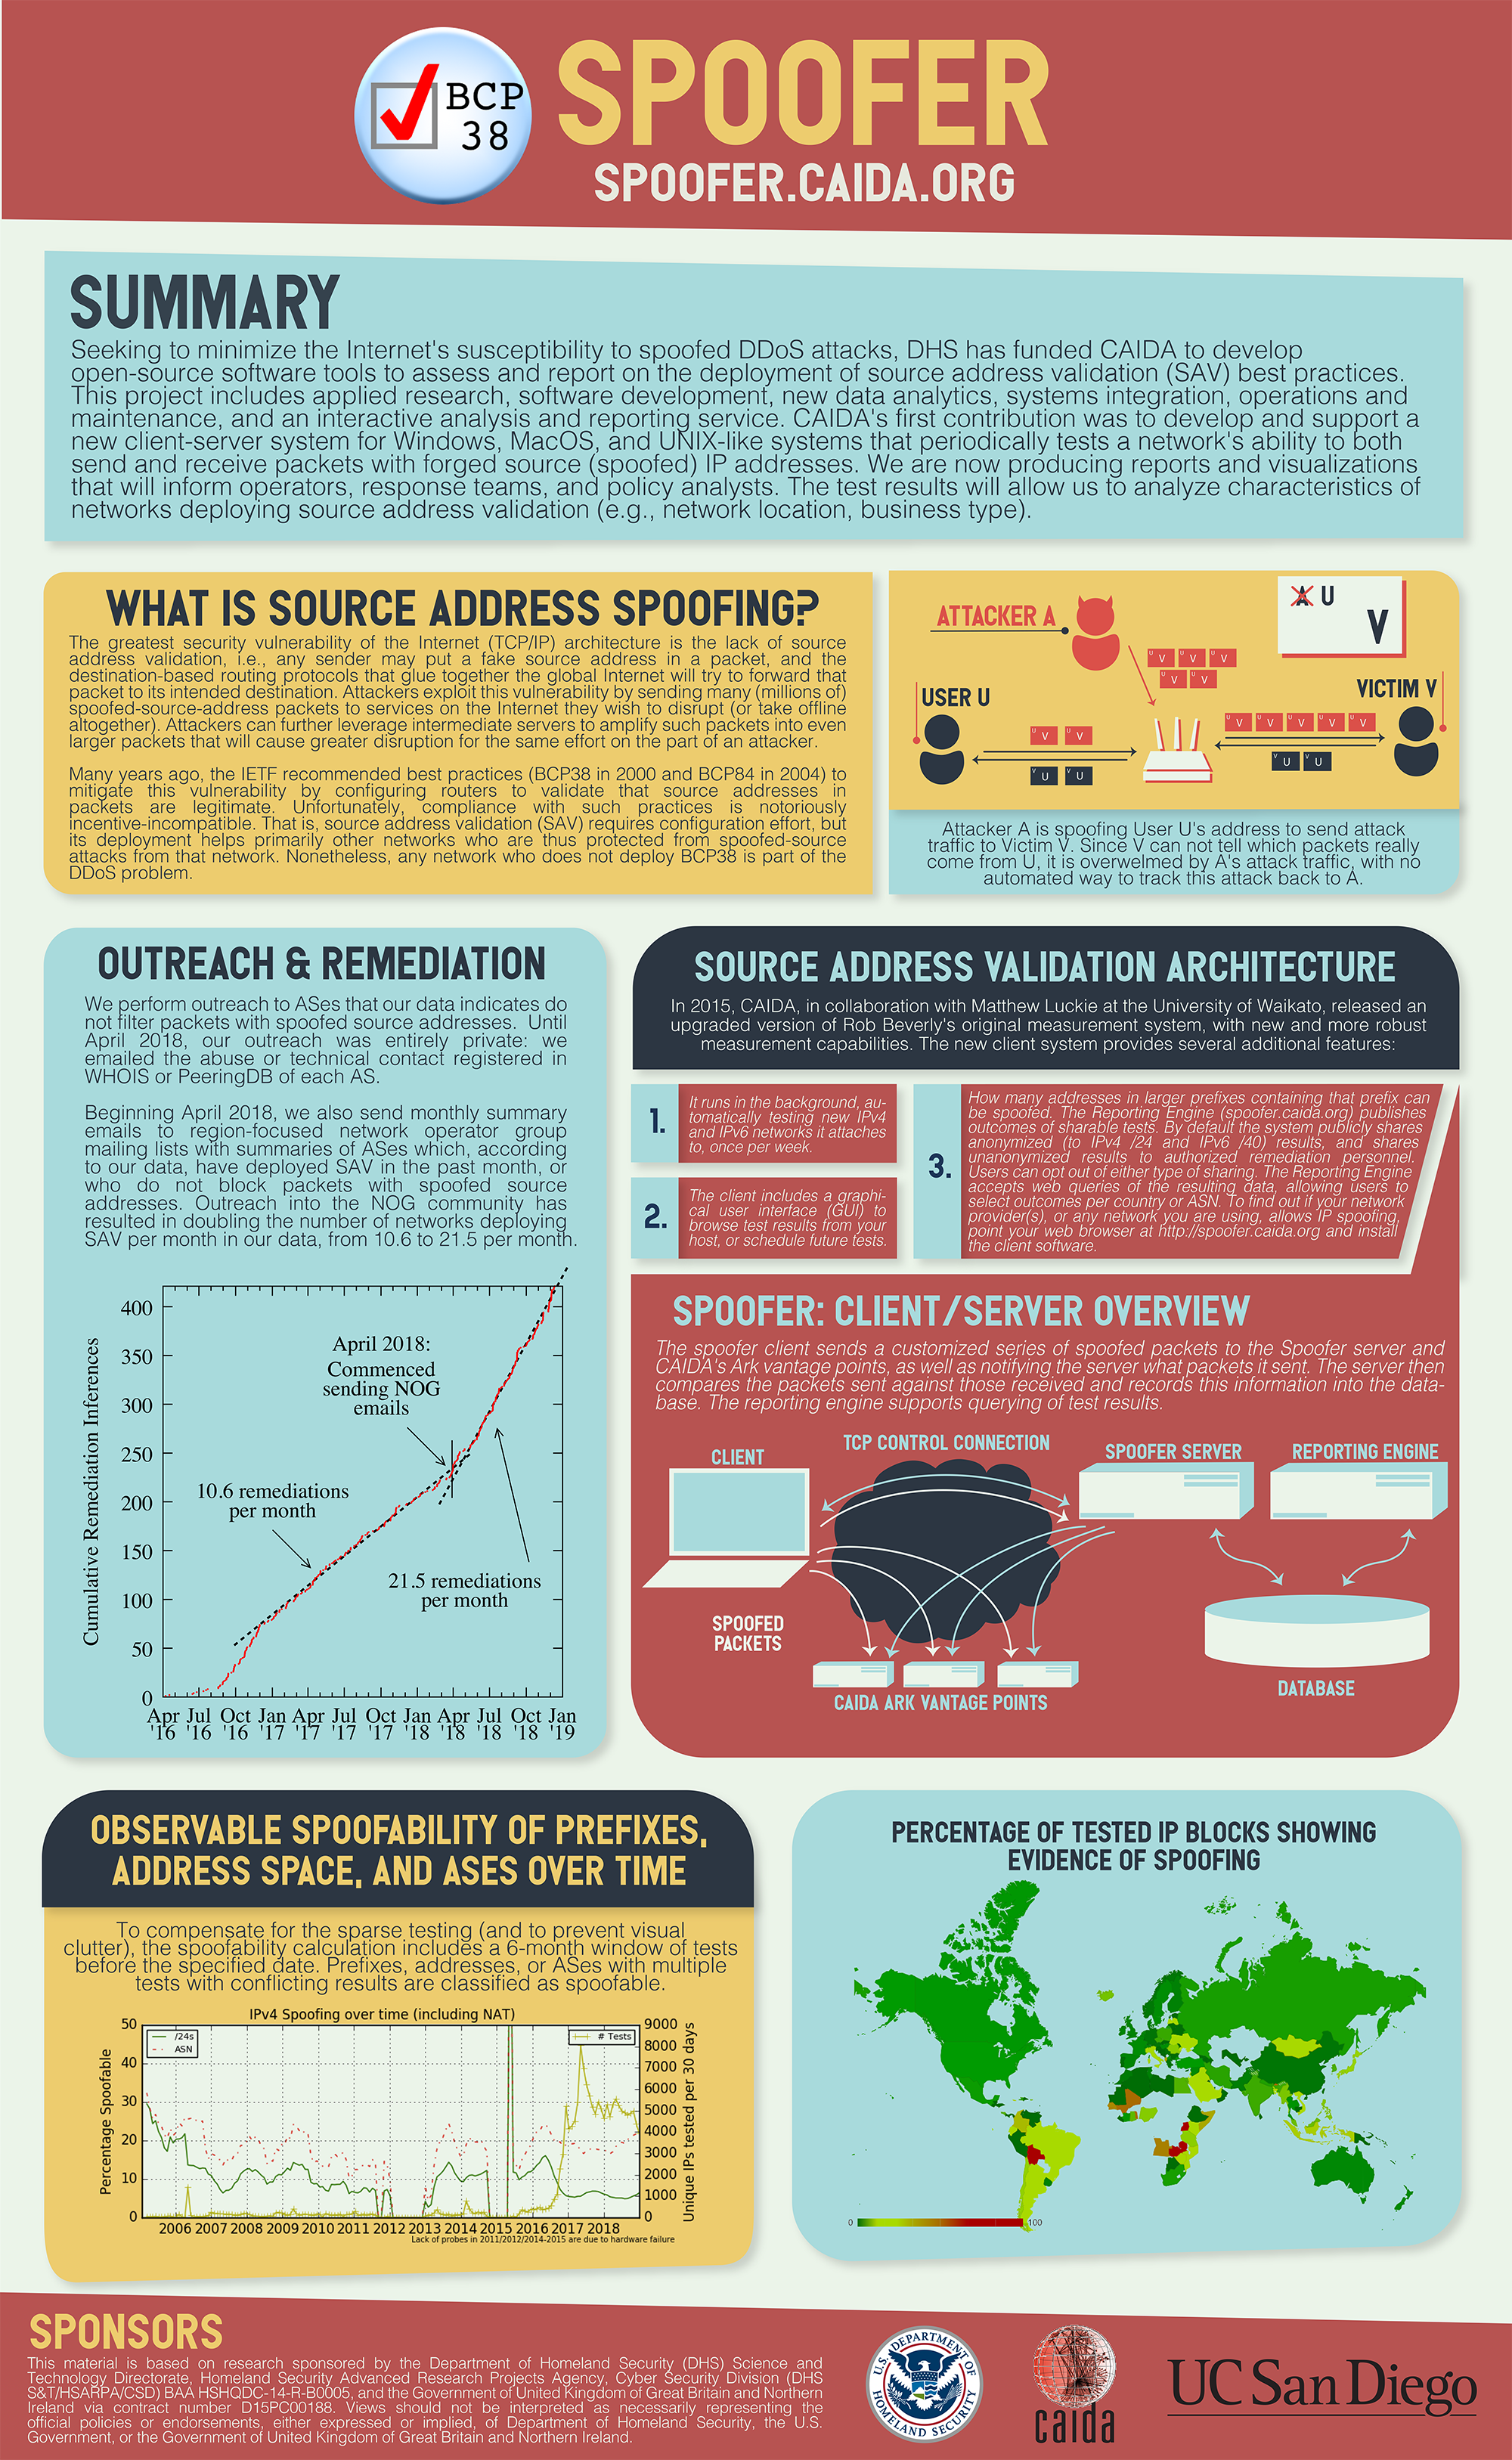
Spoofer (2018)
-
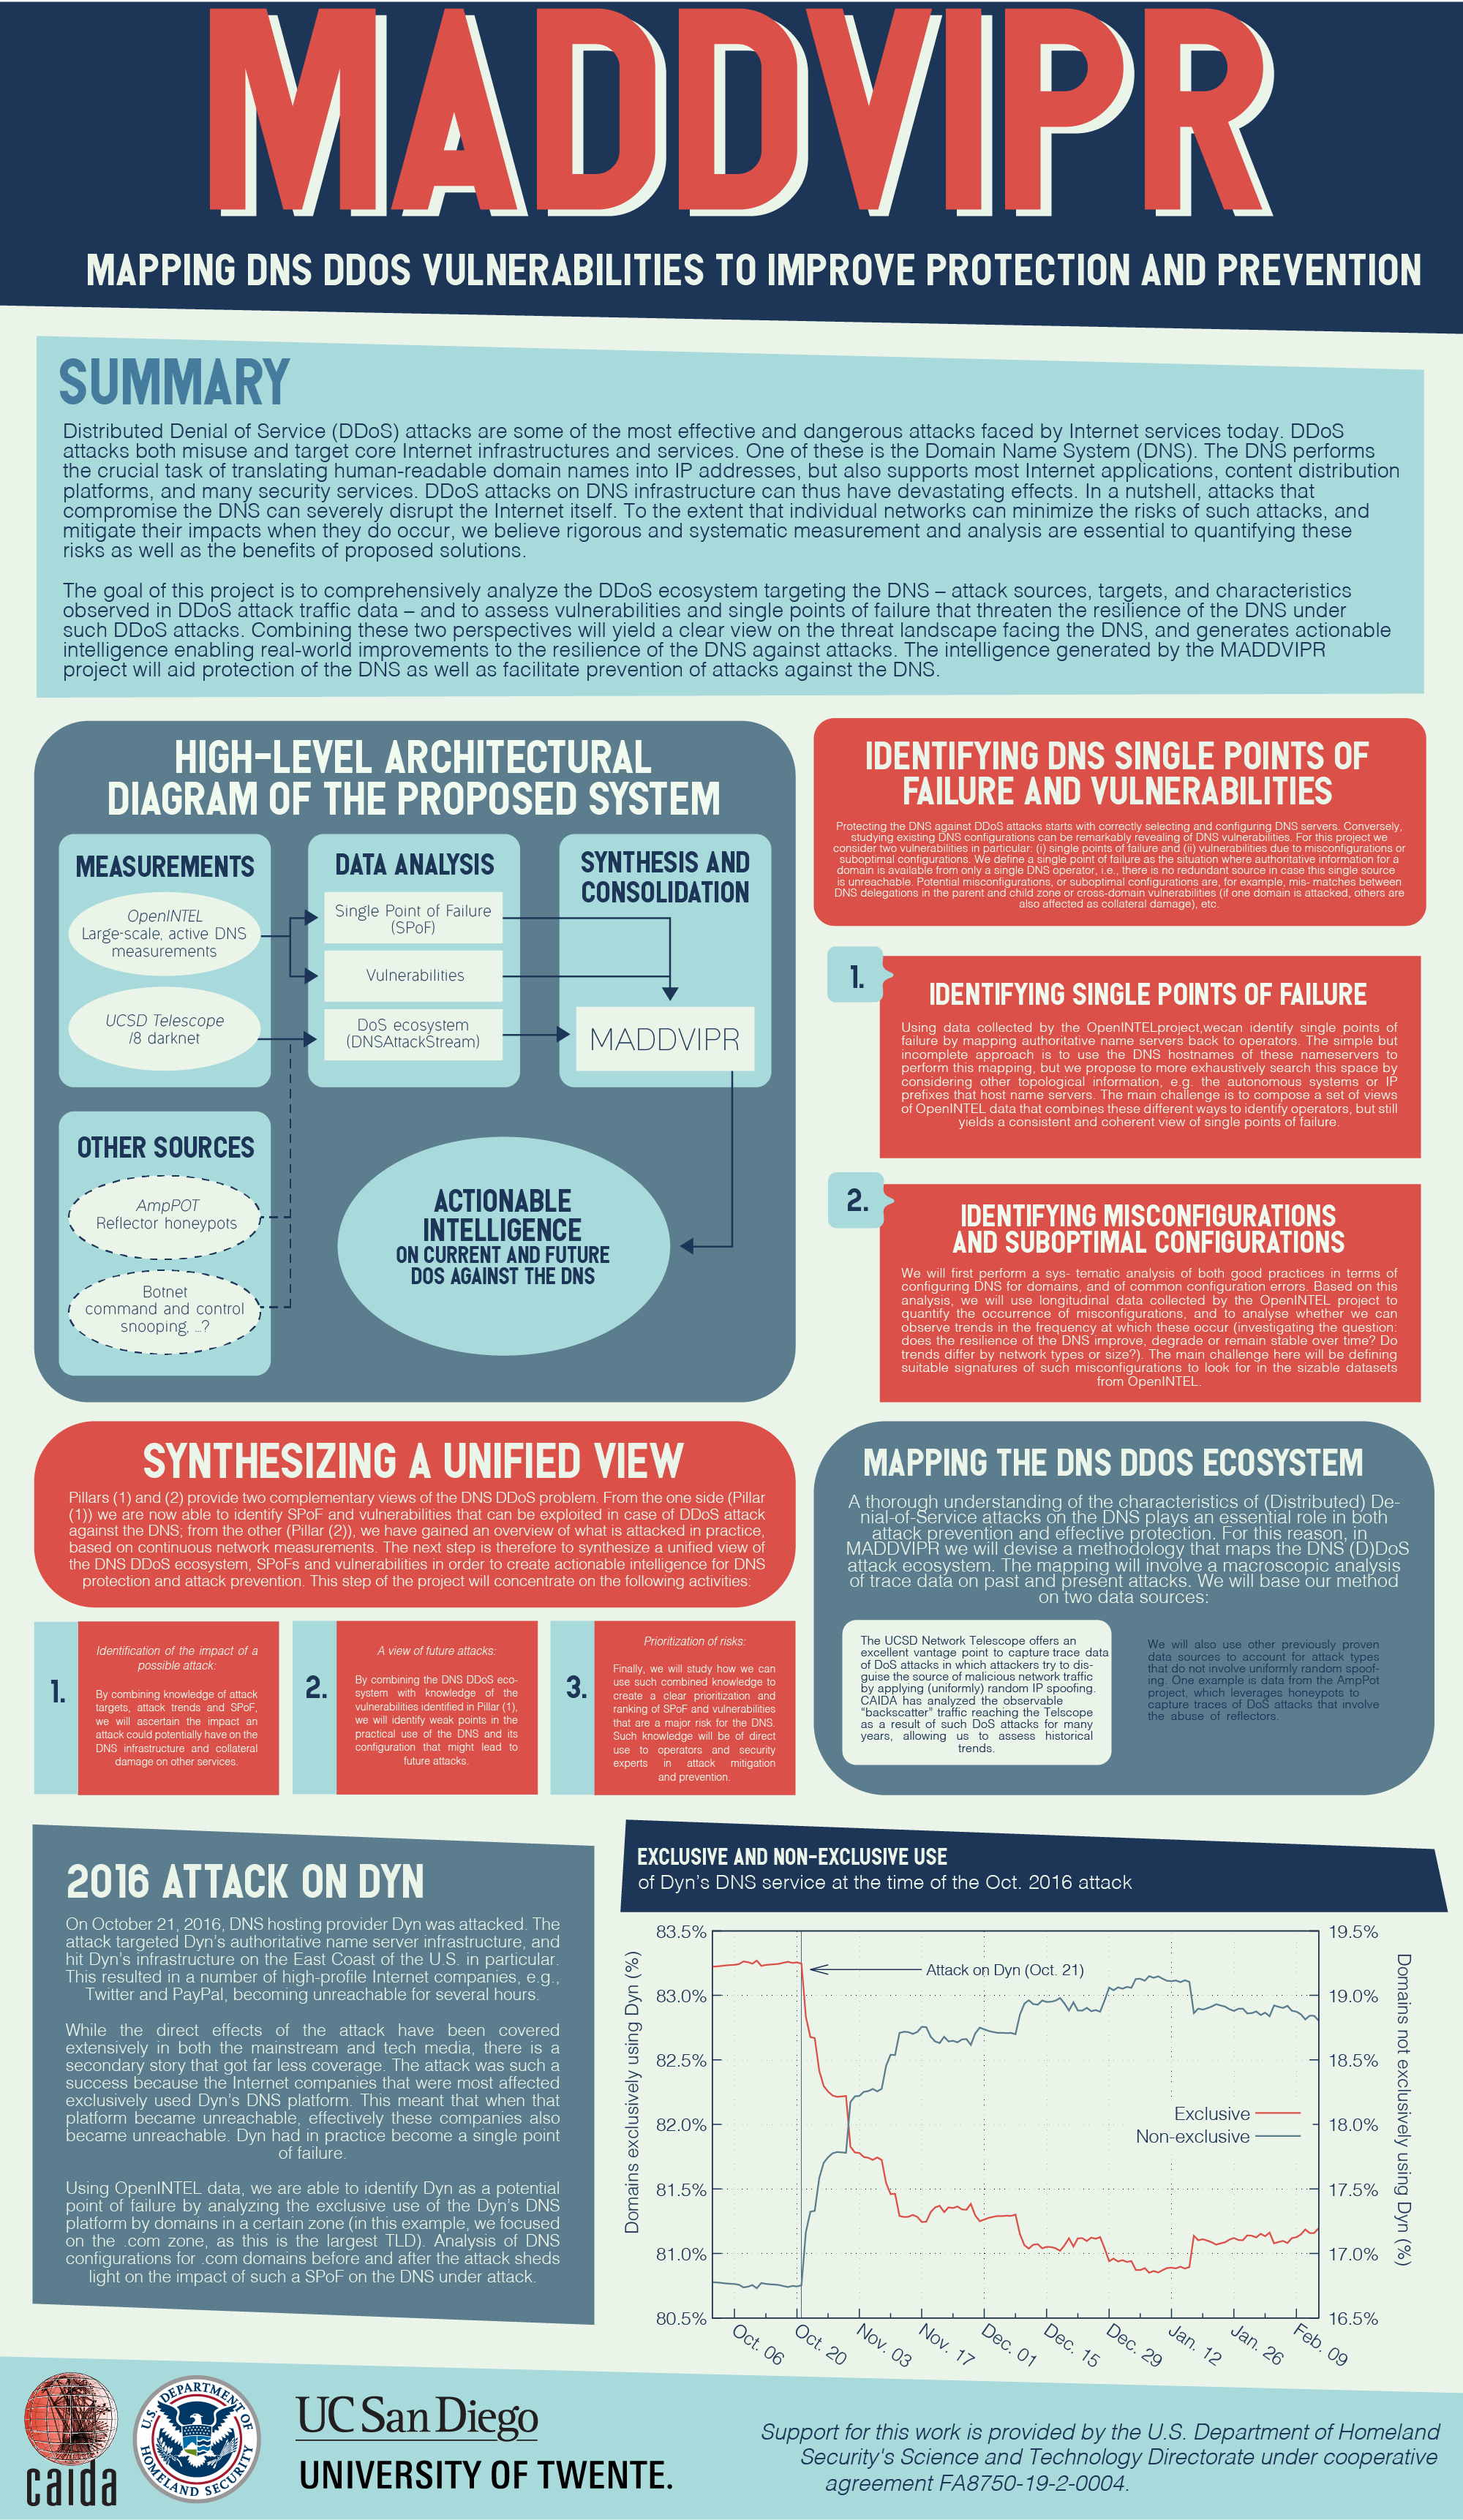
MADDVIPR: Mapping DNS DDoS Vulnerabilities to Improve Protection and Prevention (2018)
-
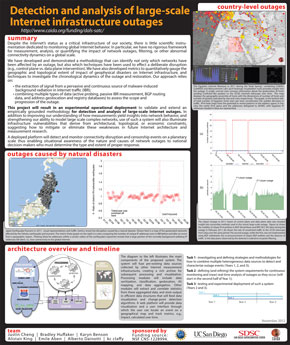
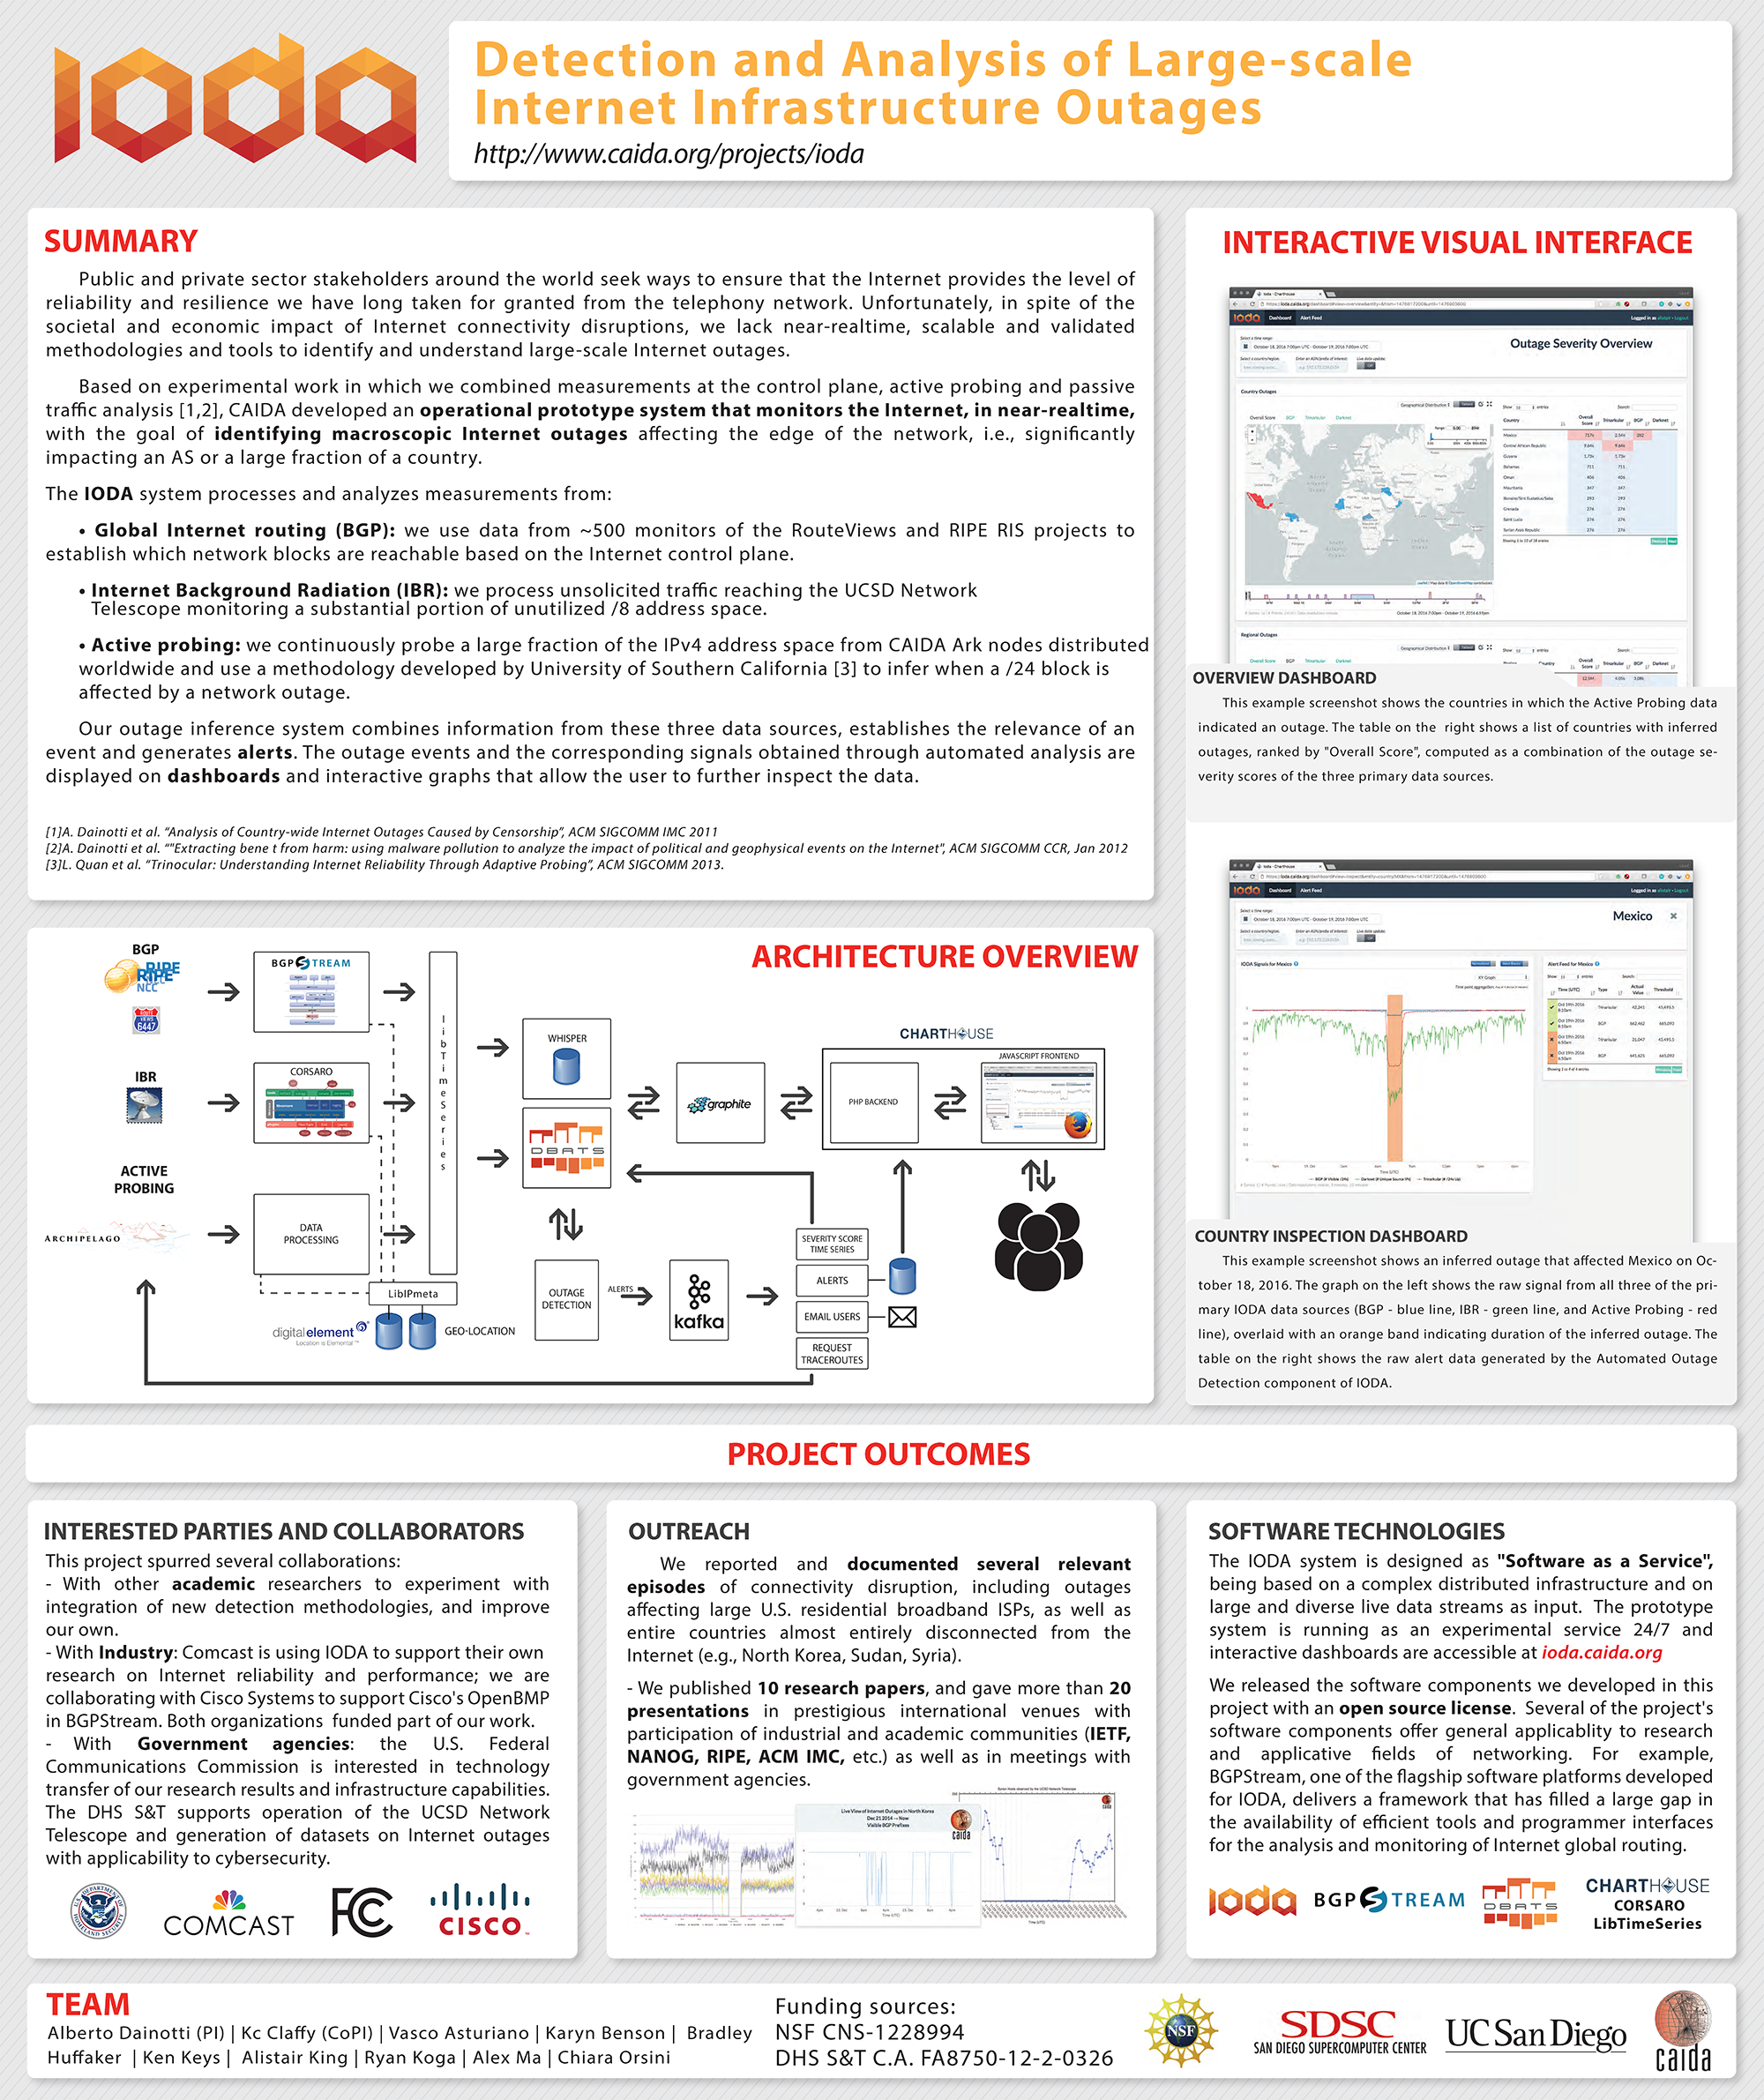
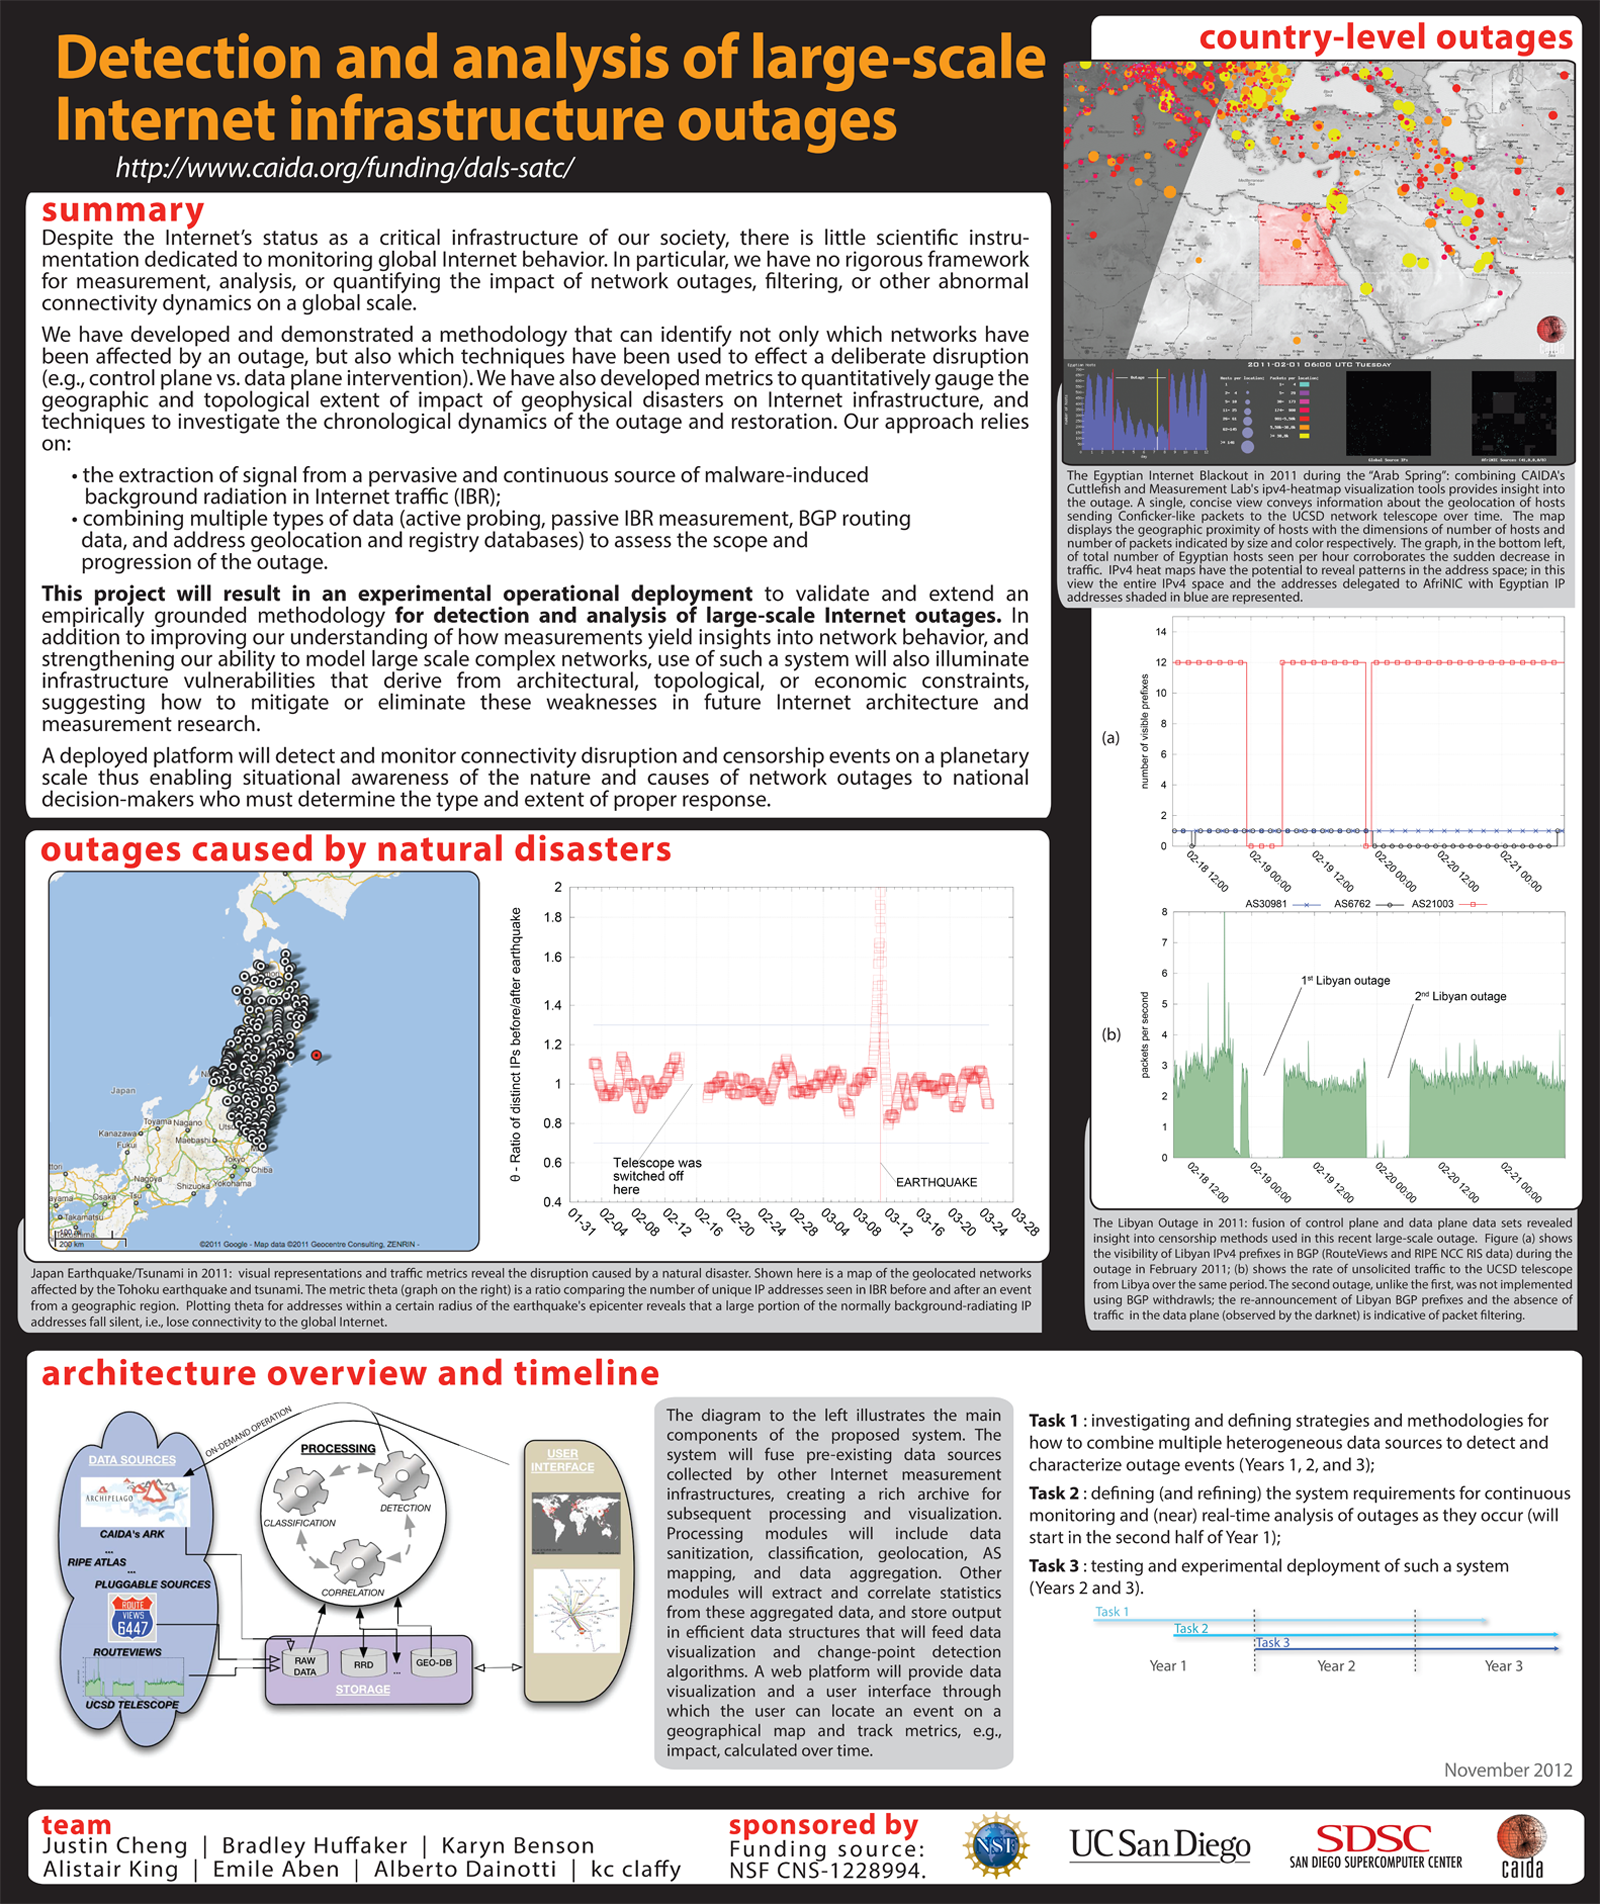
Detection and analysis of large-scale Internet infrastructure outages (2017)
-
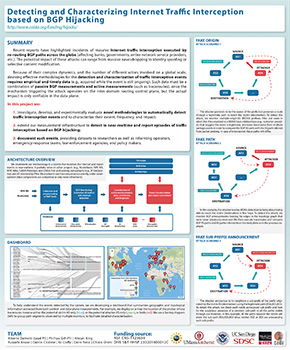
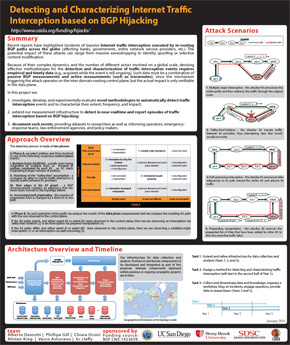
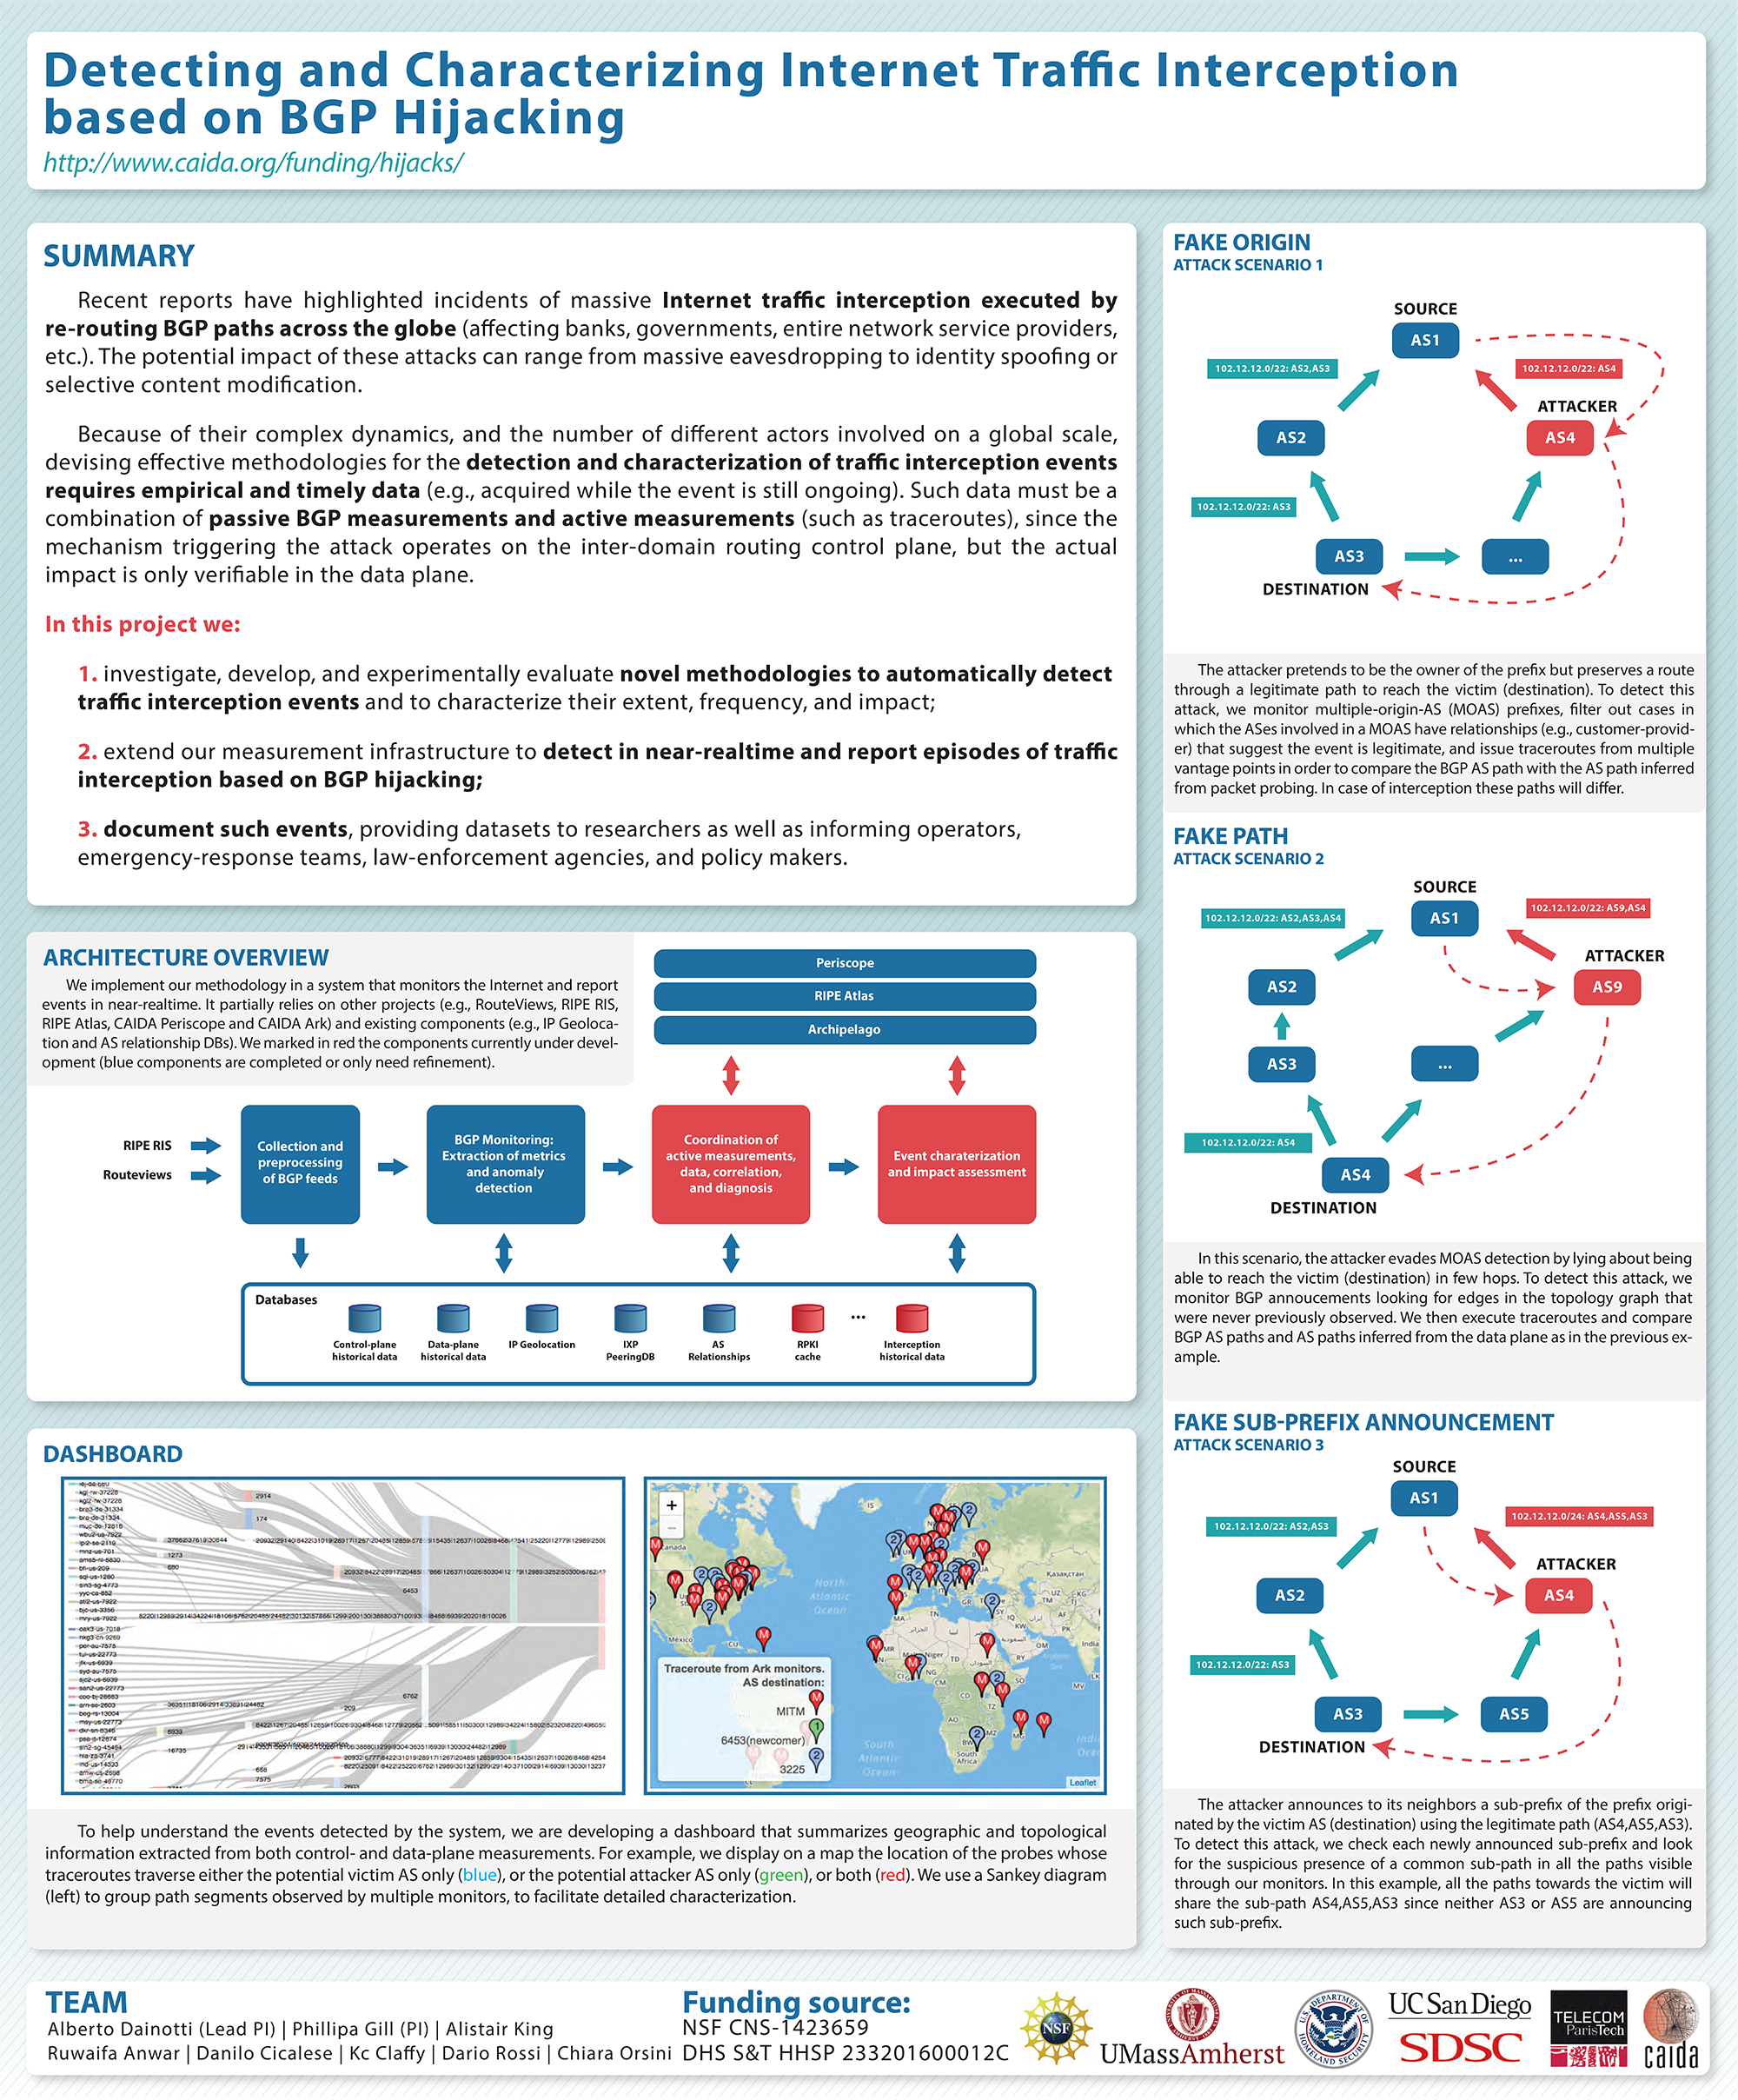
Detecting and Characterizing Internet Traffic Interception based on BGP Hijacking (2017)
-
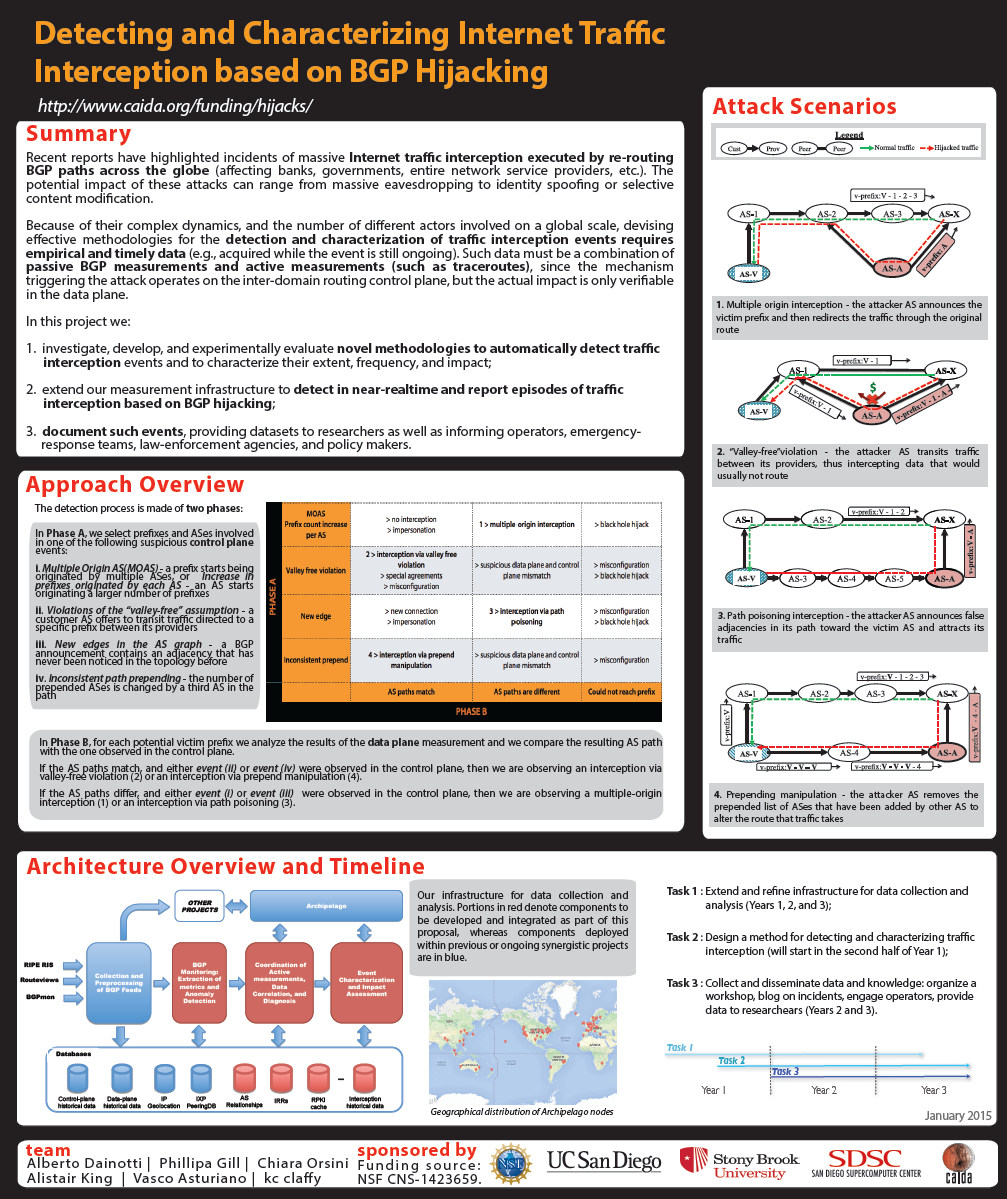
Detecting and Characterizing Internet Traffic Interception based on BGP Hijacking (2015)
-
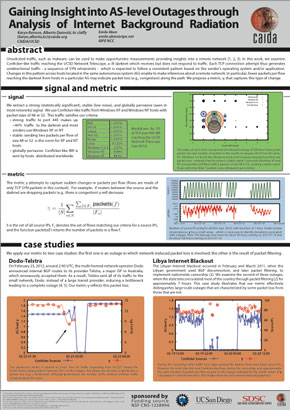
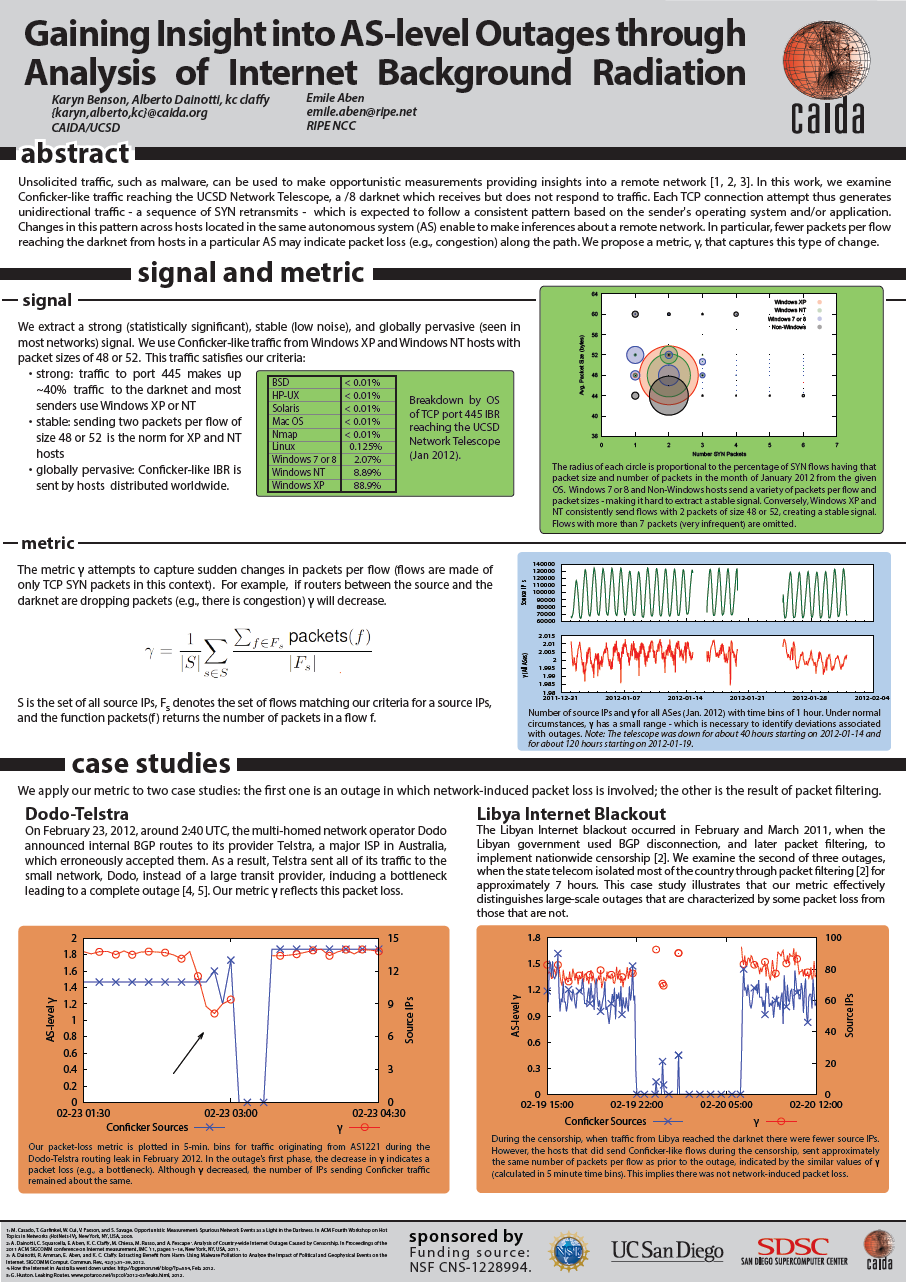
Gaining Insight into AS-level Outages through Analysis of Internet Background Radiation (2012)
-
Detection and analysis of large-scale Internet infrastructure outages (2012)
-
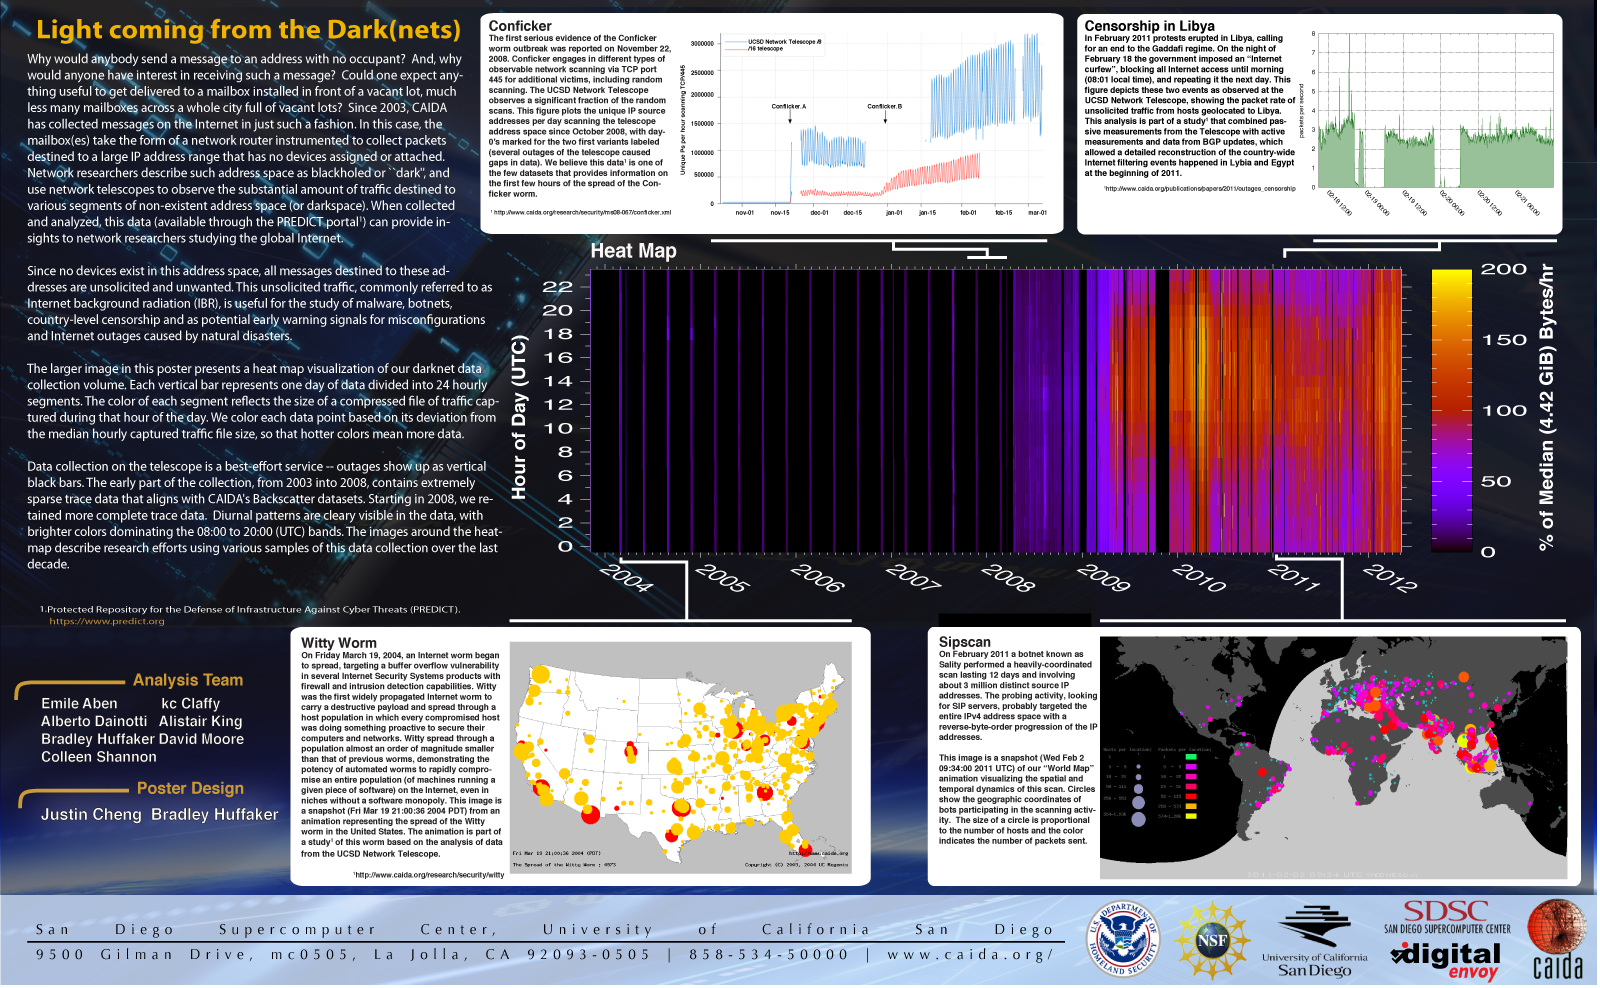
Light from the Dark(nets) Telescope Poster (2012)
-
CAIDA Analysis of Malicious Software (2007)
-
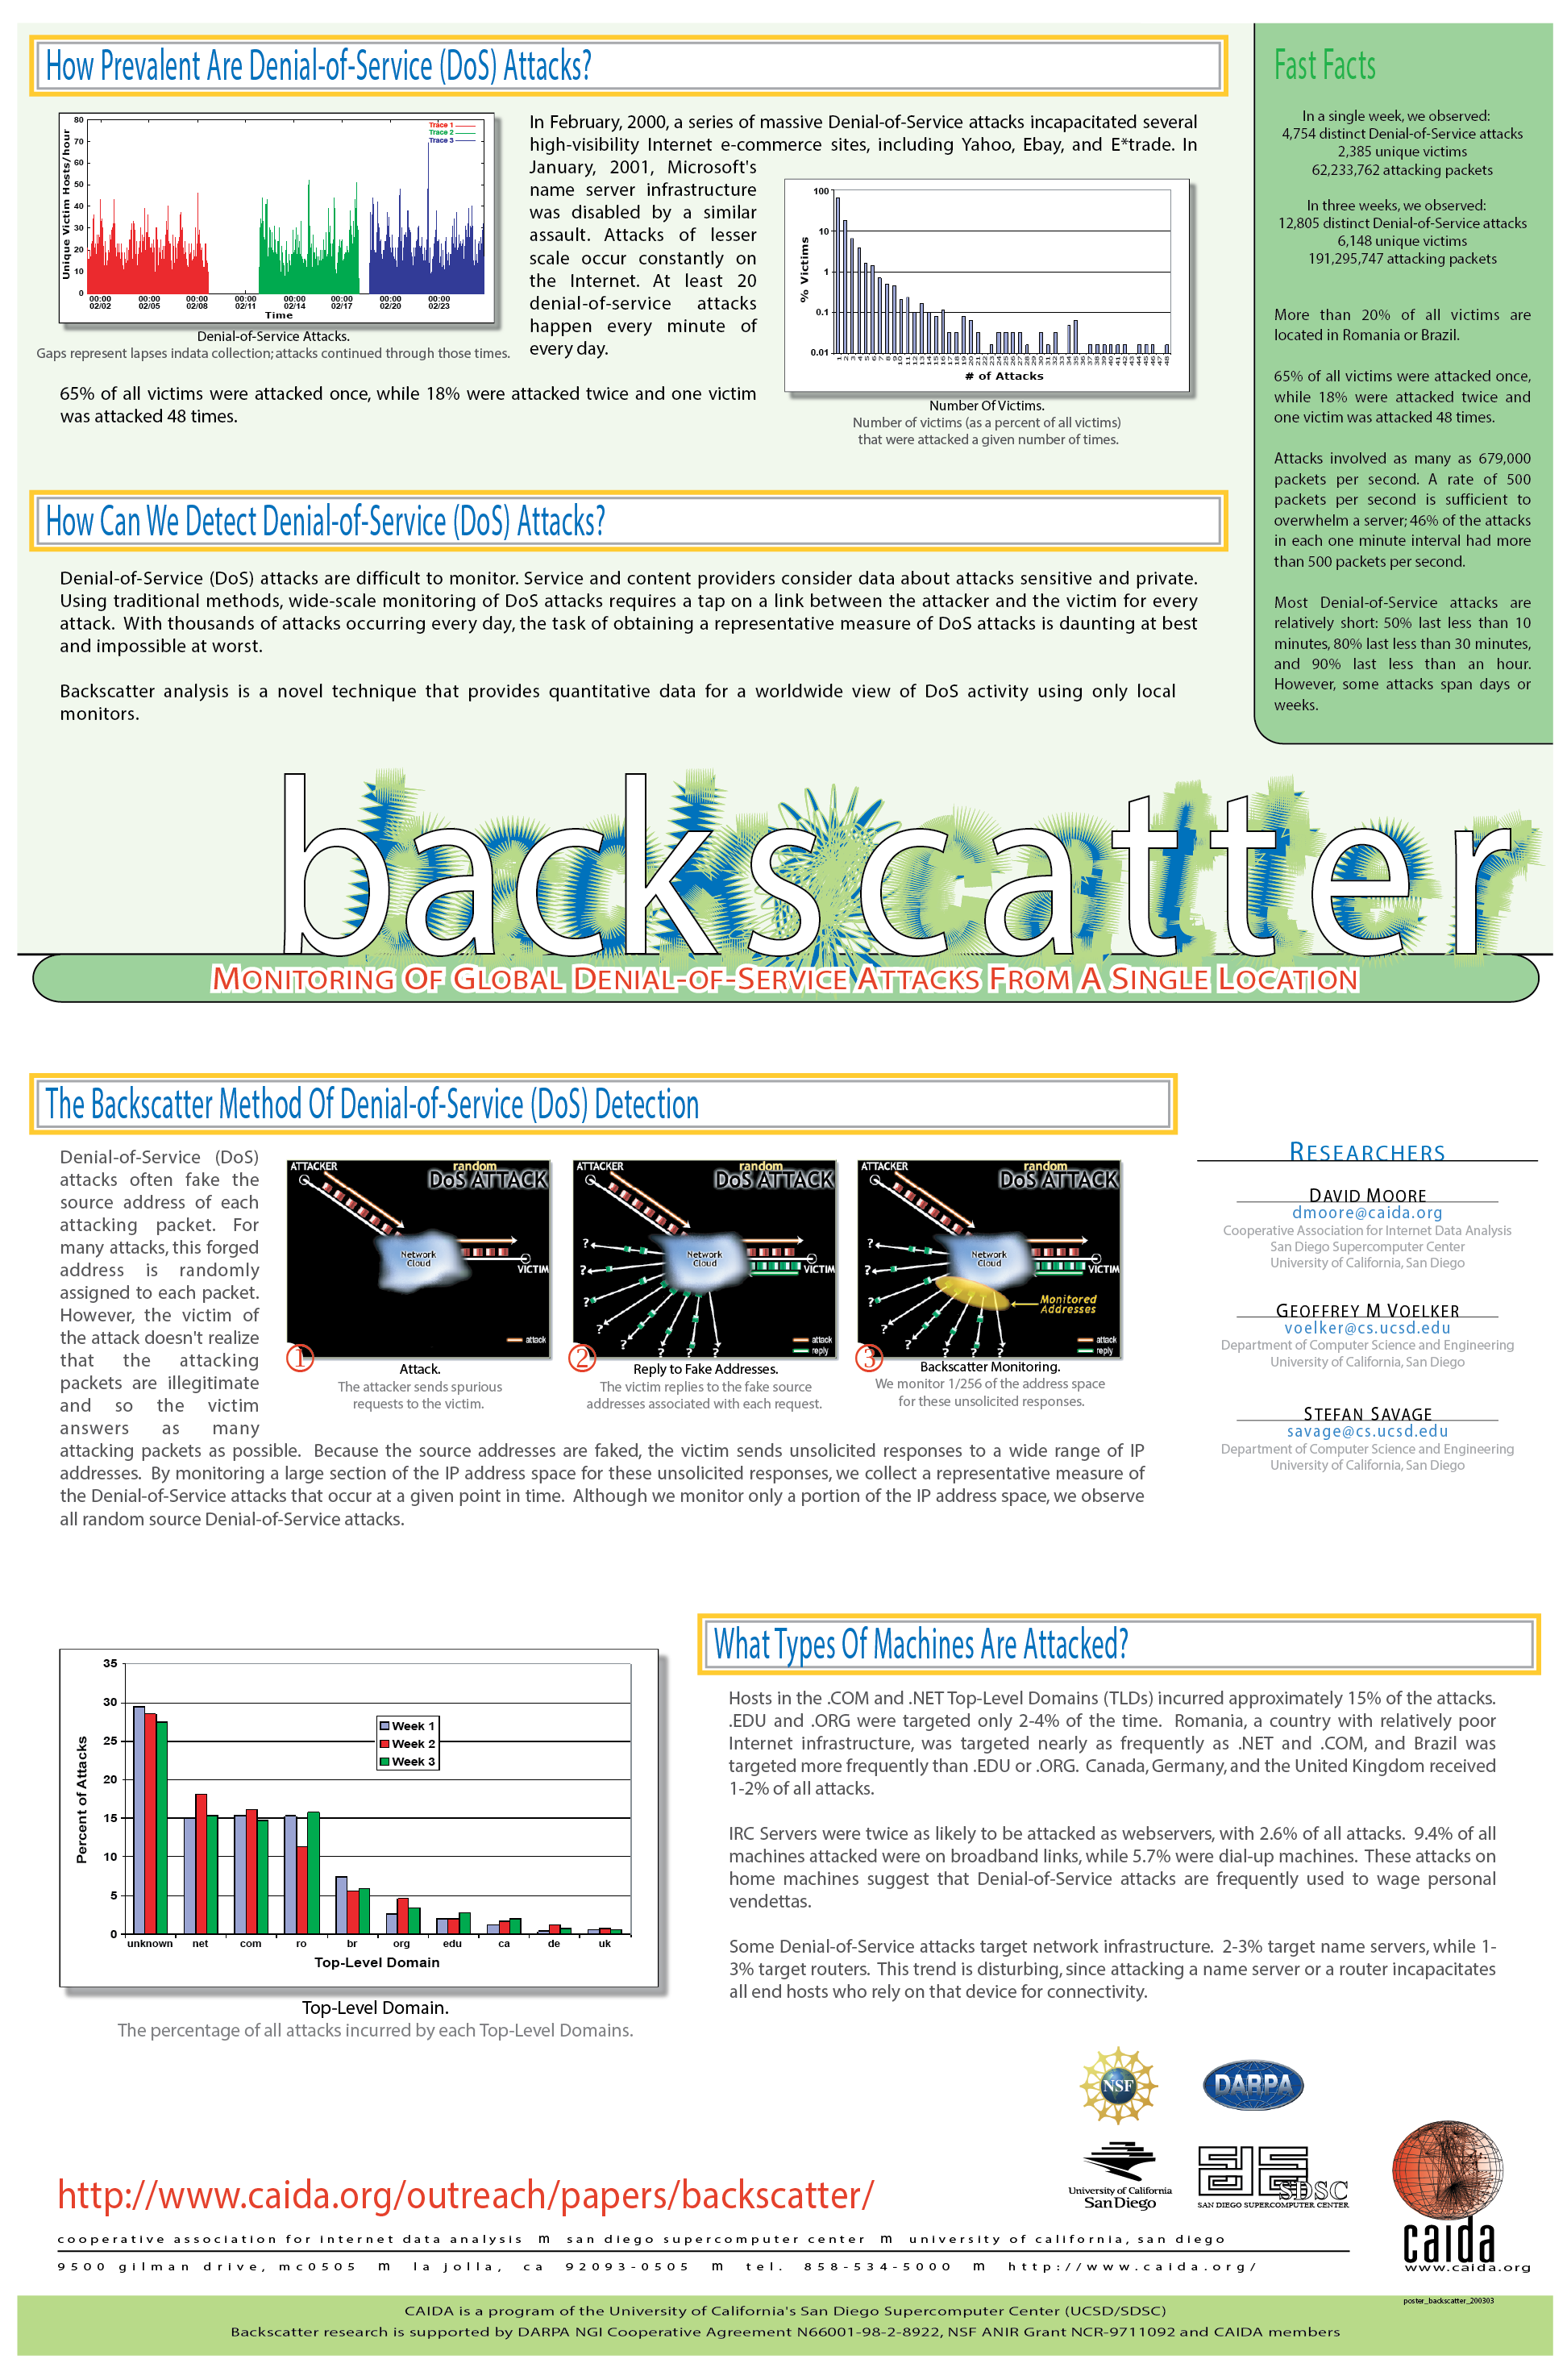
Backscatter (2003)

DNS Posters
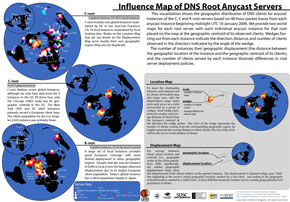
CAIDA seeks to
characterize the dynamics and performance of the Domain Name System
(DNS), a critical infrastructural component of the Internet. We
also collect data in support of long-term research of the DNS
behavior and stability. To see more about CAIDA's DNS efforts, see
the DNS Research page.

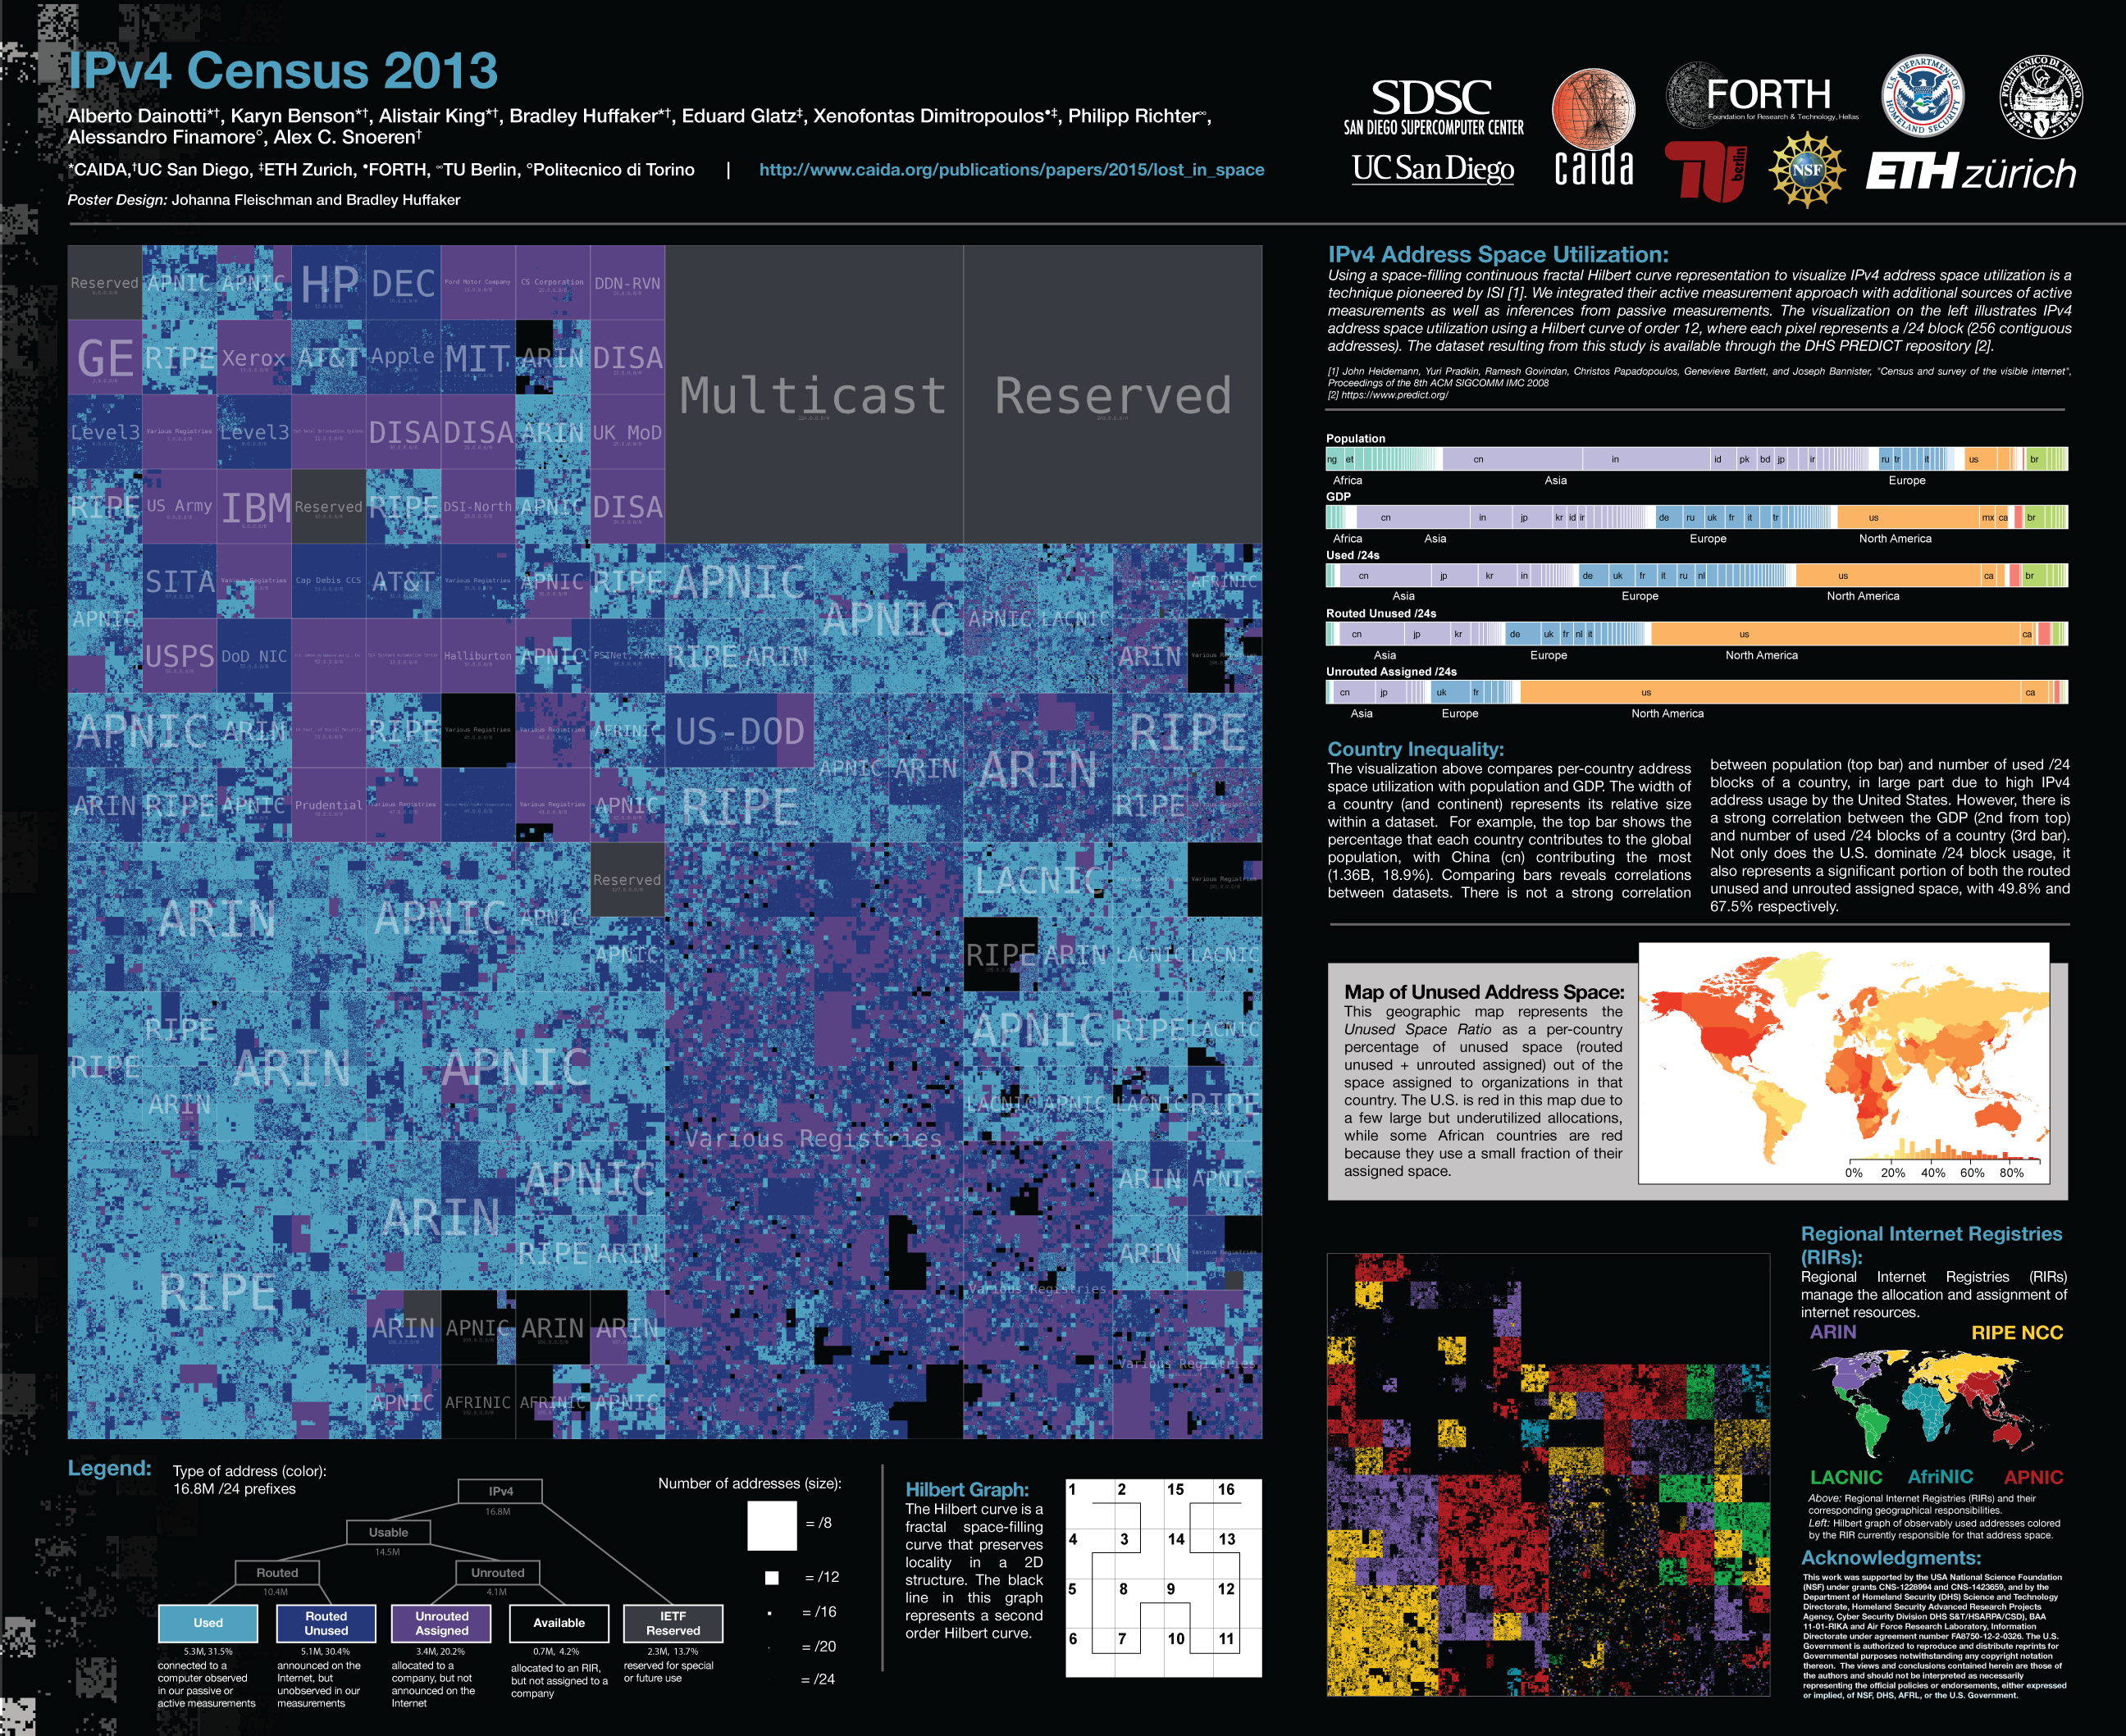
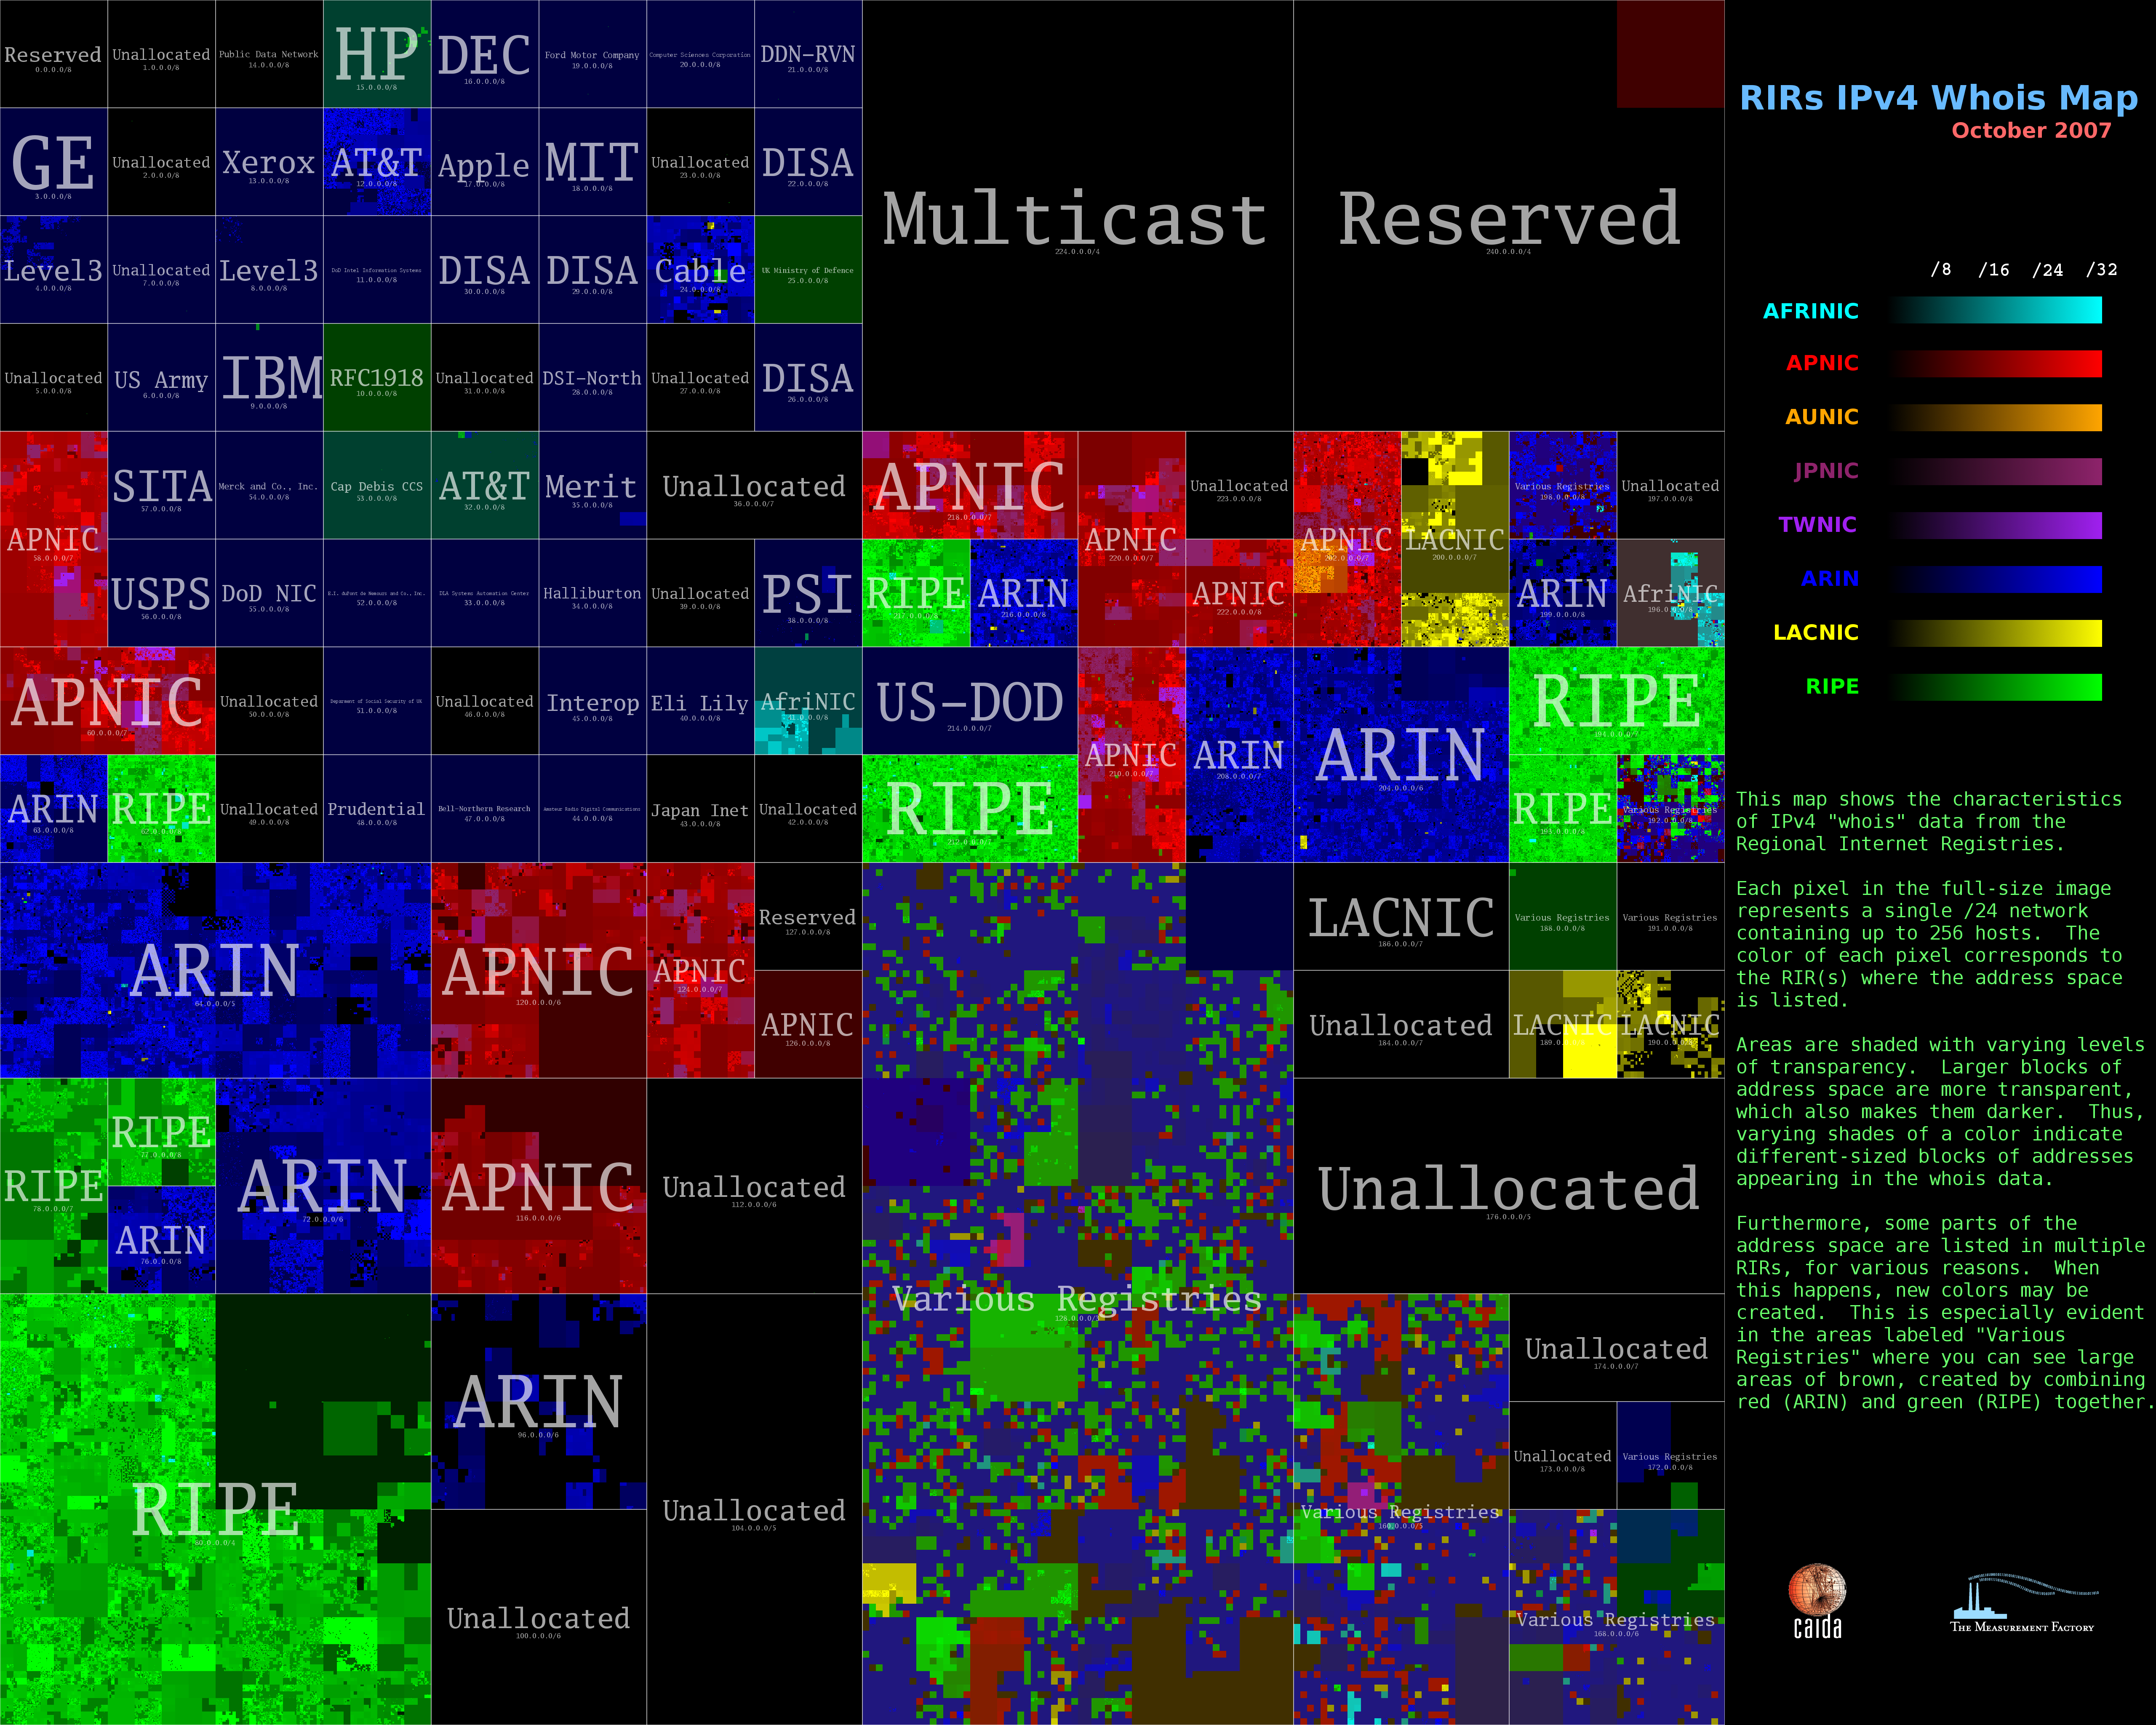
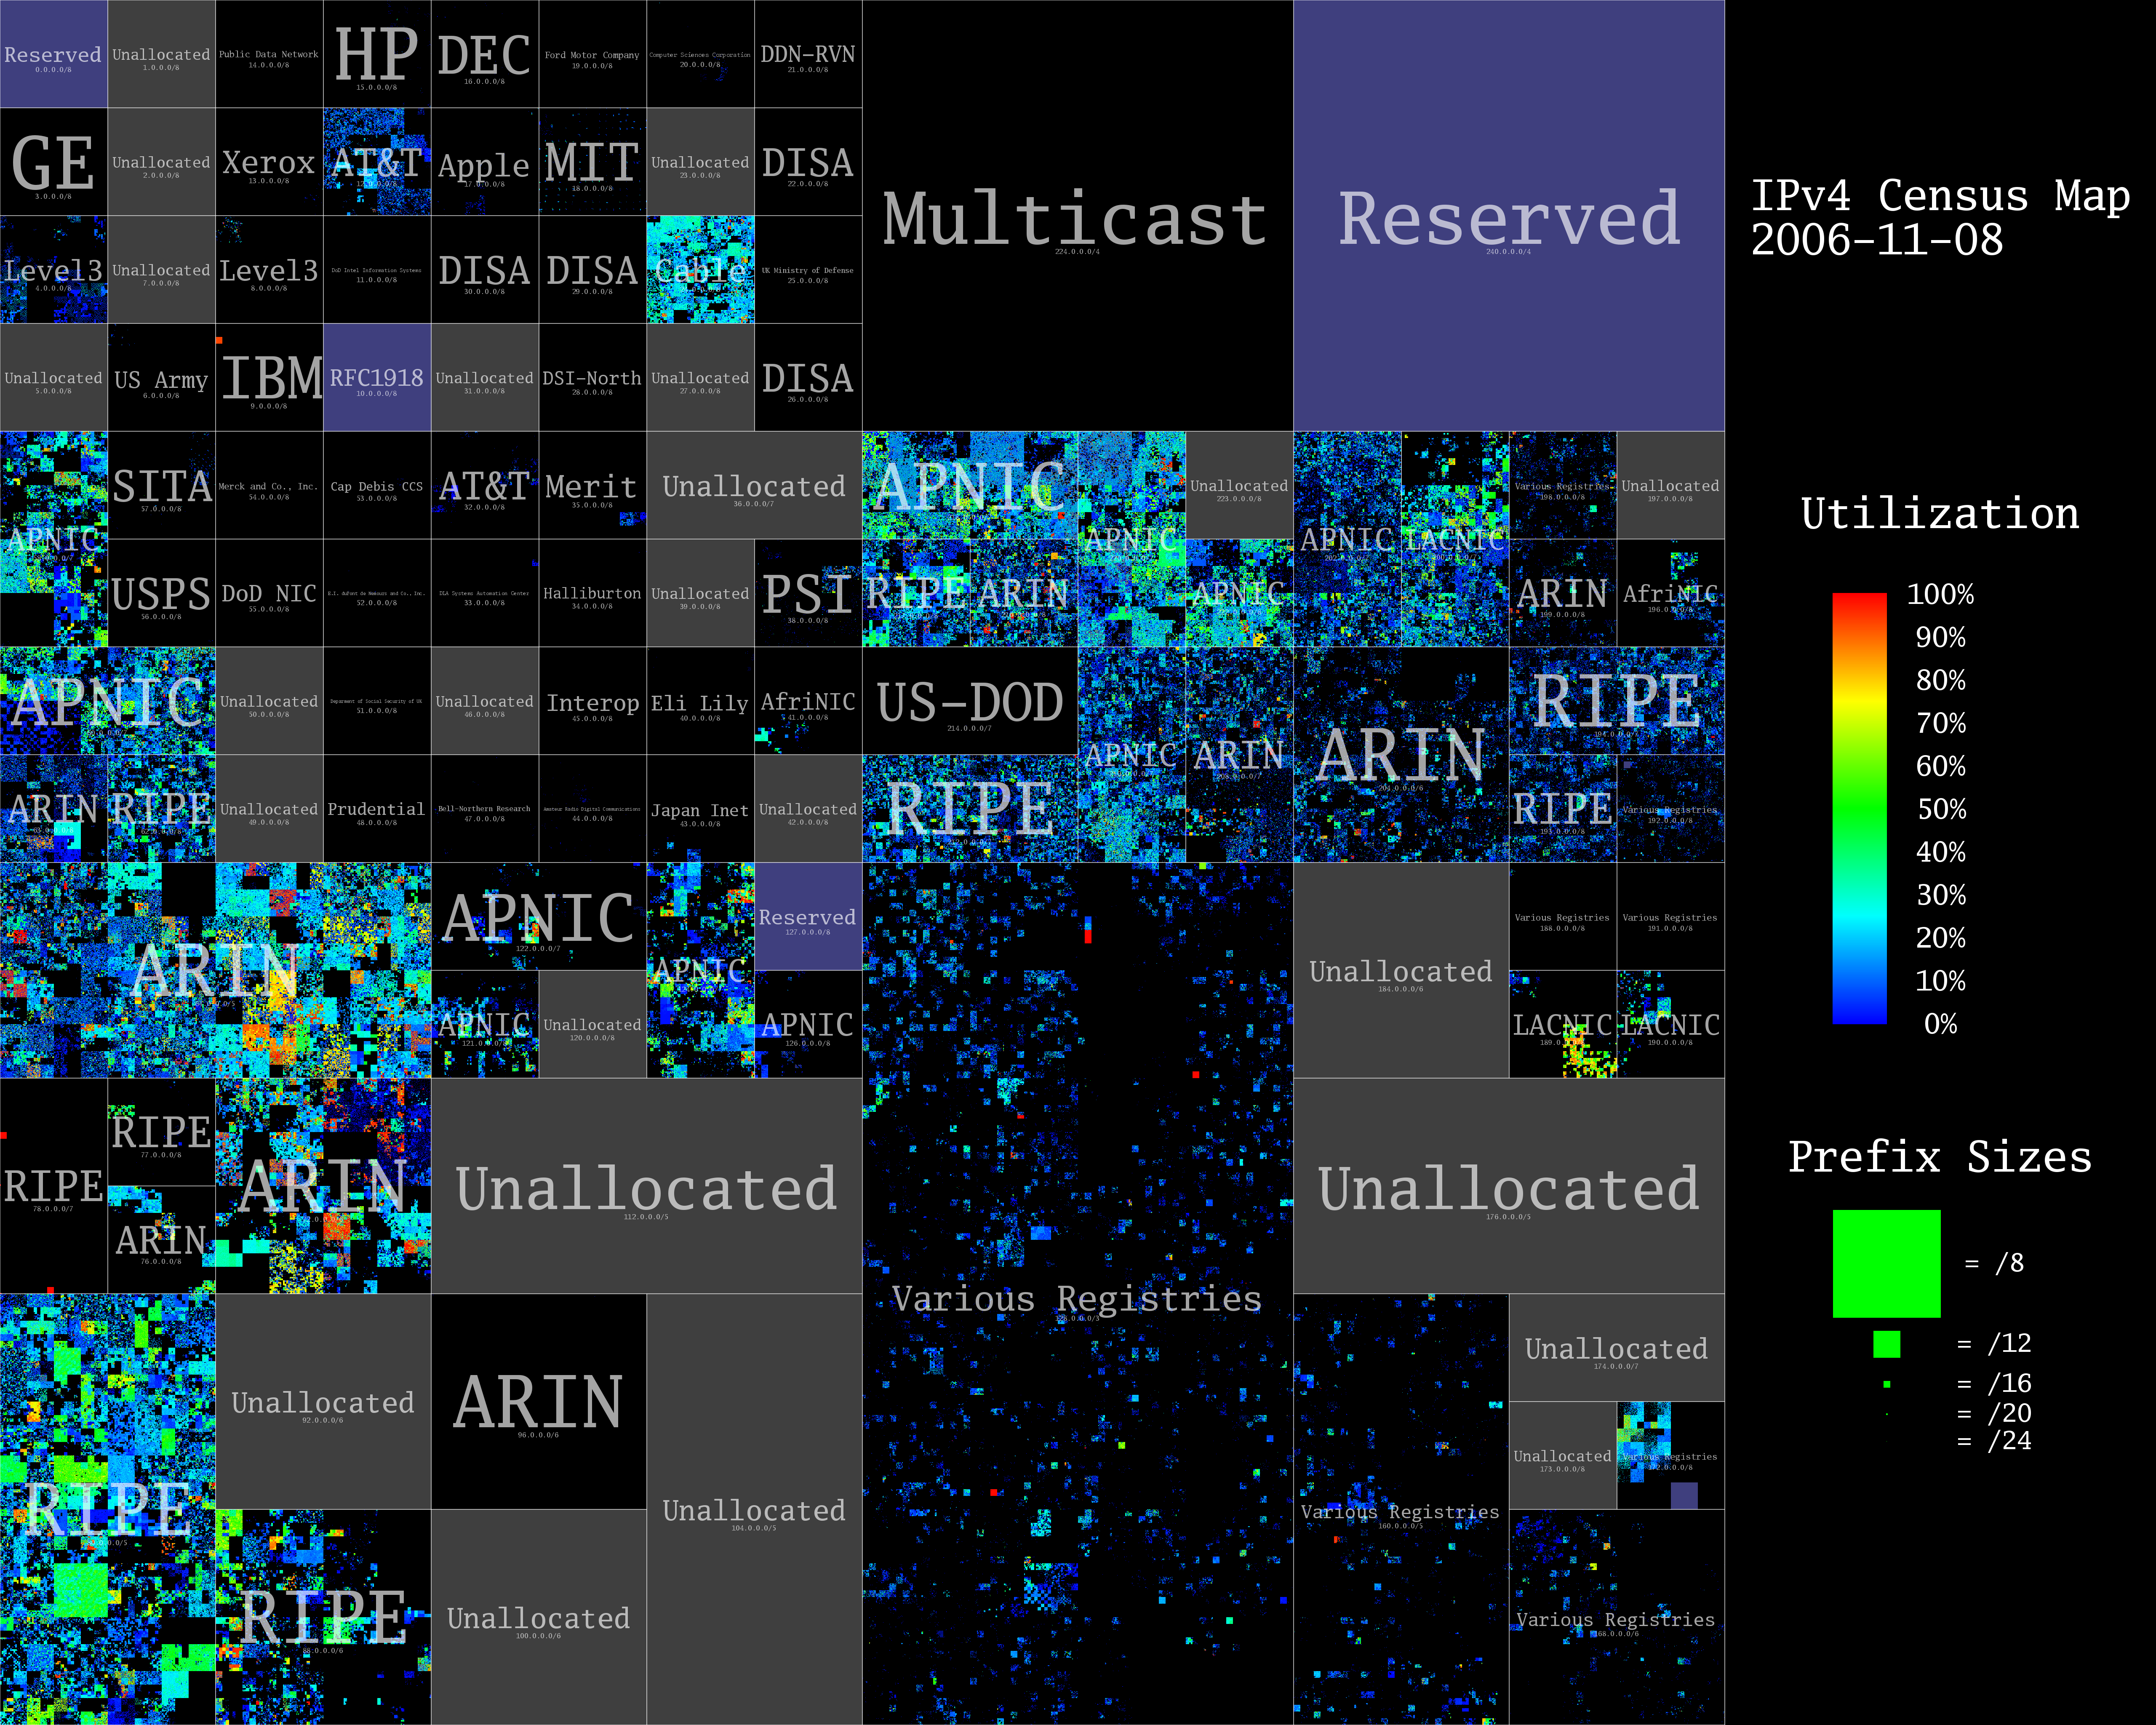
Address Space Consumption
Internet address space allocation and utilization is visualized here using heatmaps. A heat map is a
graphical representation of data where the values taken by a
variable in a two-dimensional map are represented as colors.
IPv4 BGP Geopolitical Analysis Poster
The worldwide
distribution of Internet resources and address space is highly
non-uniform. We present an analysis comparing five demographic
measures against three measures of Internet resources, stratified
by continent with substratification by country. We found that two
continents and one country consume a much larger share of Internet
resource allocation than predicted by their demographic measures of
size. For more information see IPv4 BGP Geopolitical
Analysis.
-
IPv4 Analysis