

Animations
Videos and animations produced by CAIDA are available for download.
Security
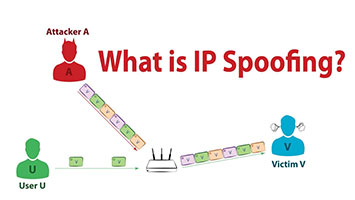 |
What is IP Spoofing? (May 2017, 3m 51s): YouTube |
 |
Nyxem Virus (Jan 2006, 0m 39s): small .mov (841 KB) | large .mov (3.1 MB) | small .gif (840 KB) | large .gif (3.1 MB) |
 |
Witty Worm (world) (Mar 2004, 0m 3s): small .gif (53 KB) | large .gif (83 KB) |
 |
Witty Worm (USA) (Mar 2004, 0m 3s):
small .gif (54 KB) |
large .gif (129 KB)
|
 |
Code-Red Worm (Jul 2001, 0m 28s): .mov (314 KB) | .fli (208 KB) | .gif (4.2 MB) |
Internet Outages
|
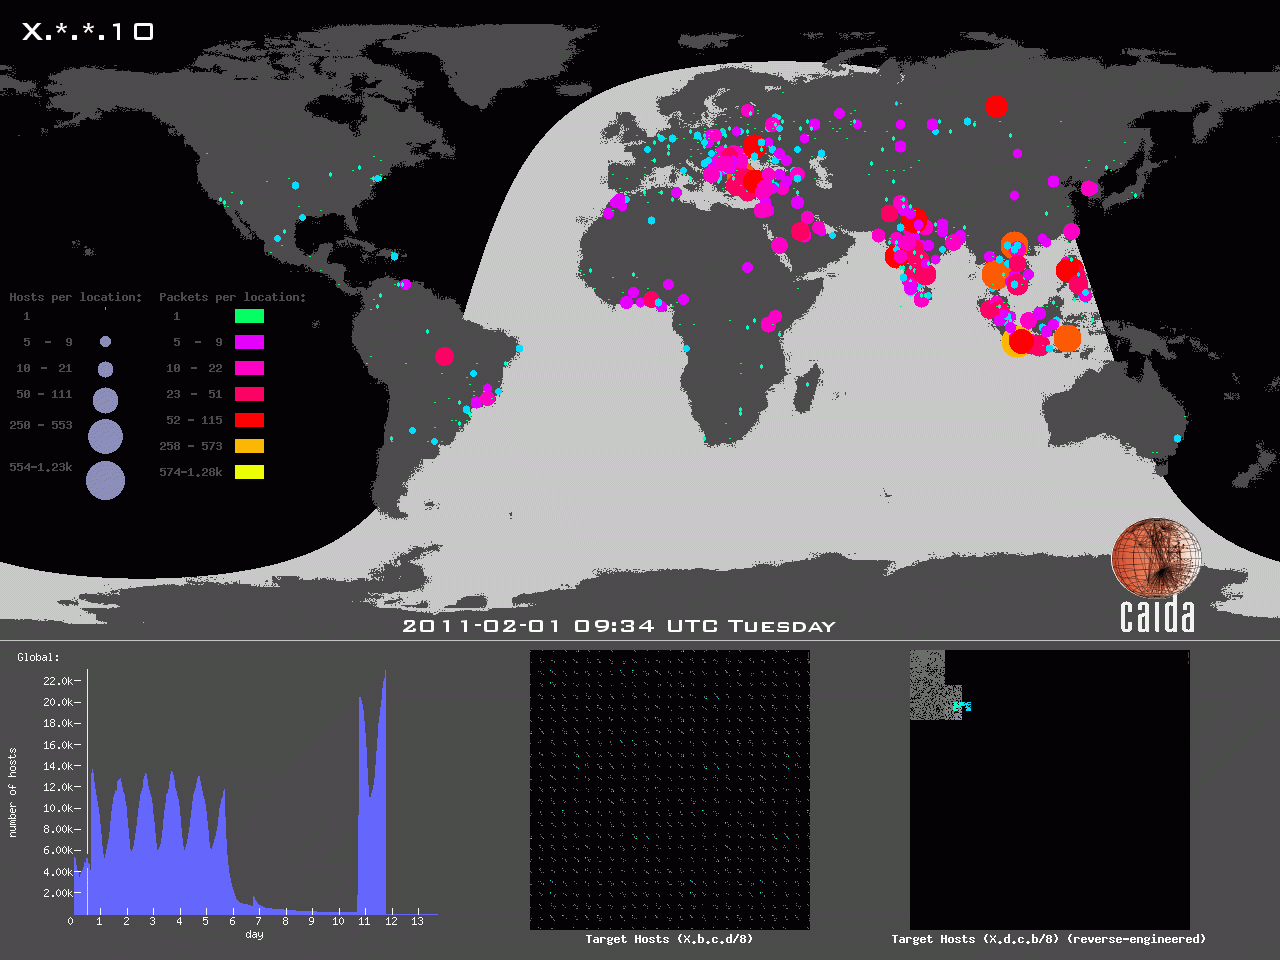
Sipscan - Coordinated View (Nov 2012, 2m 03s):
.mp4 (40.3 MB) |
YouTube |
screenshot
The sipscan coordinated view animation combines the world map animation, standard byte ordered target progression animation, and the reversed byte order animation into a single, synchronized video. This allows an immediate comparison between the geographical dynamics of the sources and the progression of the target addresses across the duration of the scan. |
|
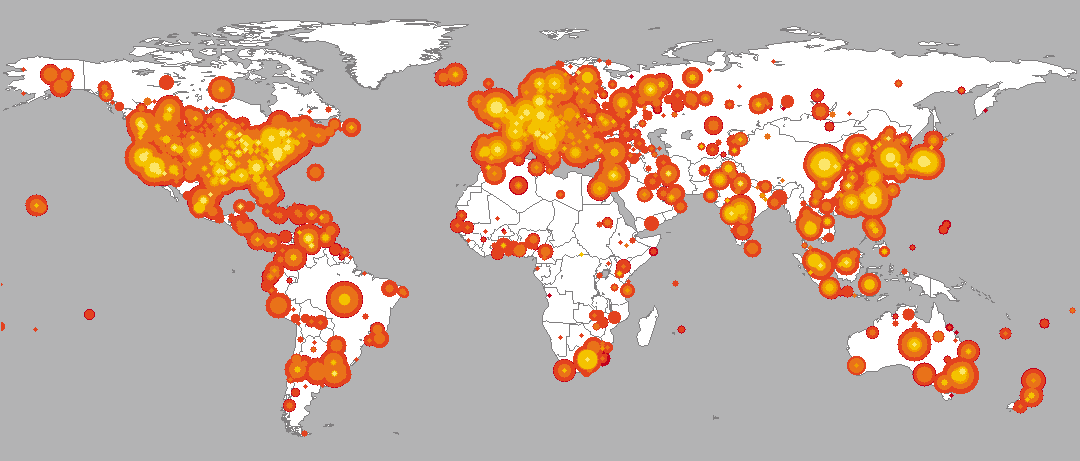
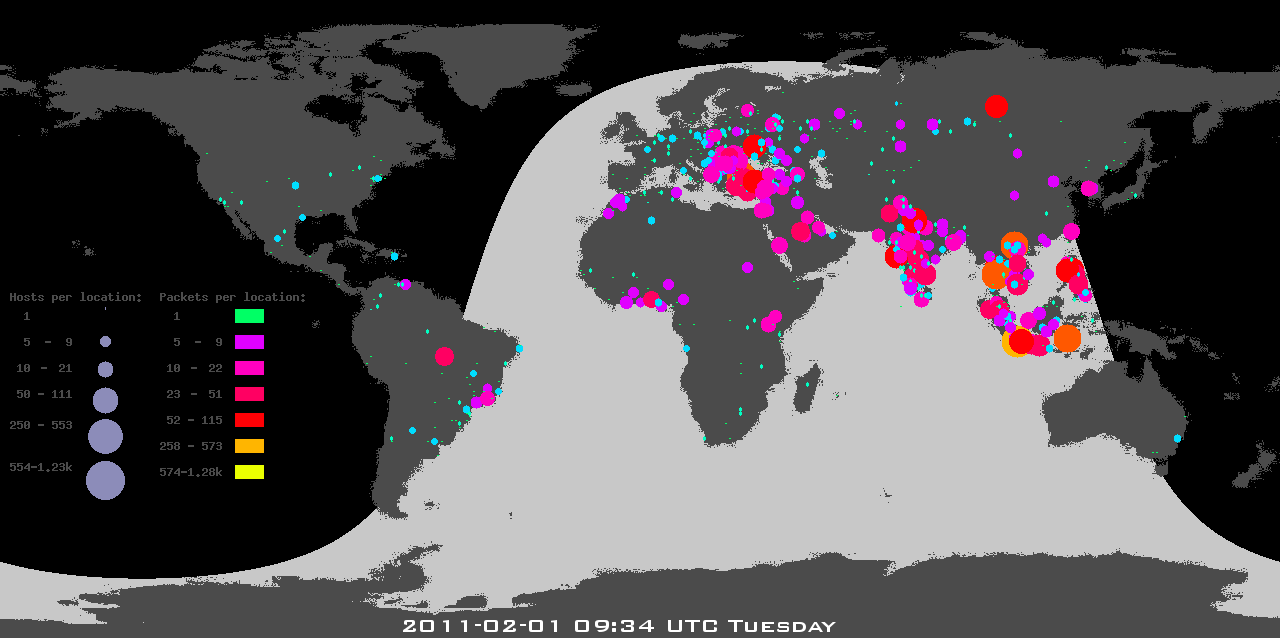
Sipscan - World Map (Nov 2012, 2m 03s):
.mp4 (35.8 MB) |
YouTube |
screenshot
The Sipscan World Map animation shows, with 5:20-minutes of data represented per frame, circles at the geographical coordinates of source hosts (bots) with size proportional to the number of hosts geolocated to those coordinates, and color to the number of packets sent. The animation depicts the spatial and temporal dynamics of the scan. |

|
Sipscan Target Progression in Standard Byte Order (Nov 2012, 2m 03s):
.mp4 (40.1 MB) |
YouTube |
screenshot
The animation of the sipscan target progression in standard byte order represents the progression over time of the actual IP addresses targeted by the sipscan. The darknet address space is represented as a Hilbert curve of order 12. Drawing the Hilbert curve using IP addresses sequenced in their natural byte order does not reveal a particular pattern in the target progression, showing the square uniformly filling across the 12 days of the scan. |
|
Sipscan Target Progression in Reversed Byte Order (Nov 2012, 2m 03s):
.mp4 (21.0 MB) |
YouTube |
screenshot
The animation of the sipscan target progression in reversed byte order represents the progression over time of the IP addresses targeted by the sipscan. The darknet address space is represented as a Hilbert curve of order 12 in which the order of the three least significant bytes of each address is reversed before mapping it into the curve. Highlighted pixels correspond to IP addresses that have been probed up to that time (5 Feb 2011 11:47 GMT, in this frame). The animation proves the reverse-byte order progression is rigorously followed by the bots during the entire 12 days, independent of the varying rate of the sipscan. |
|
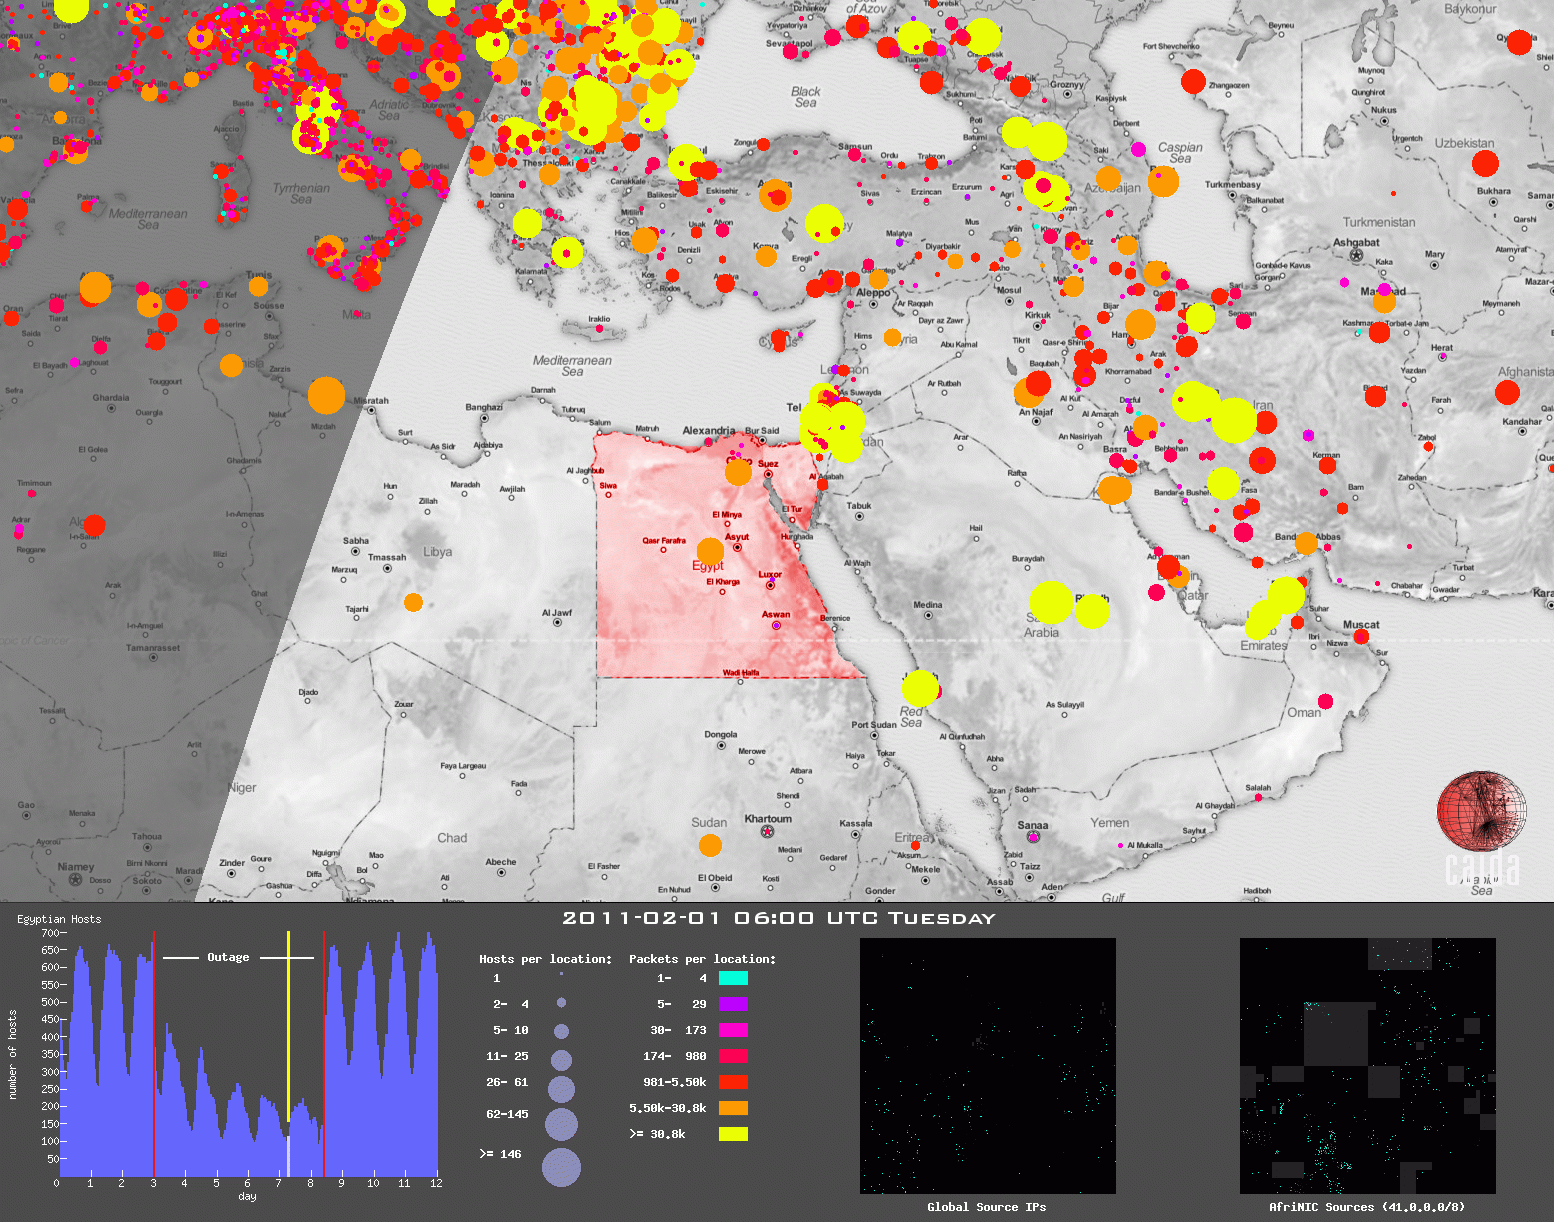
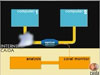
Egypt Internet Blackout - Coordinated View (Nov 2012, 0m 32s):
.mp4 (11.5 MB) |
YouTube |
screenshot
The Egypt outage coordinated view animation combines a geographical representation of Egypt region along with animations of the source addresses observed during the event, both at a global level, and from the 41.0.0.0/8 network delegated to AfriNIC. (Egypt area map © OpenStreetMap contributors, CC BY-SA) |

|
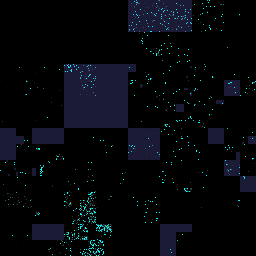
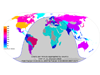
Egypt Internet Blackout - Source Addresses (Whole Internet) (Nov 2012, 0m 32s):
.mp4 (11.4 MB) |
YouTube |
screenshot
The full source address space animation shows which sources sent packets to the UCSD Network Telescope before, during, and after the Egypt Internet Blackout. Address ranges which have been identified to belong to Egyptian organizations are highlighted in a dark blue color. |
|
Egypt Internet Blackout - Source Addresses (41.0.0.0/8 - AfriNIC) (Nov 2012, 0m 32s):
.mp4 (2.3 MB) |
YouTube |
screenshot
The zoomed source address space animation shows which sources within the 41.0.0.0/8 network - which has been delegated to AfriNIC - sent packets to the UCSD Network Telescope before, during, and after the Egypt Internet Blackout. Address ranges within the /8 network which have been identified to belong to Egyptian organizations are highlighted in a dark blue color. |
Passive Monitoring
|
DNS Workload for the .CL Chilean ccTLD - Queries per minute (2007, 0m 23s): .gif (3.1 MB) |
|
DNS Workload for the .CL Chilean ccTLD - Clients per minute (2007, 0m 23s): .gif (2.9 MB) |
|
Backscatter Analysis (2001, 1m 26s): .mov (4.4 MB) | .mpg (5.9 MB) |
|
Traffic Characterization (1999, 1m 12s):
.mov (3.3 MB) |
.mpg (4.3 MB)
|
|
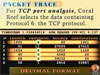
TCP Port Analysis (1999, 2m 15s):
.mov (6.0 MB) |
.mpg (6.1 MB)
|
Active Monitoring
|
Henya: CAIDA's Internet Topology Query System Tool (2016, 8m 03s):
YouTube
Henya is CAIDA's large-scale Internet topology query system which provides remote search of traceroute data without requiring data downloads. Henya includes built-in analyses and visualizations for commonly occuring needs, and is intended to be responsive enough for interactive data exploration. |
|
 |
Traceroute (2001, 4m 11s):
.mov (13.9 MB) |
.mpg (14.0 MB)
|
 |
AS Core Networks (Jan 2000, 3m 20s): .mov (9.85 MB) | .mpg (33.2 MB) | |
 |
Skitter Tool (1999, 3m 44s): .mov (8.8 MB) | .mpg (10.0 MB) |
Network Visualizations
 |
mapnet video (1998, 8m 27s): .mov (16.2 MB) | .mpg (29.8 MB) |