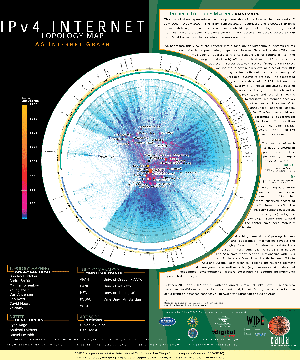
IPv4 AS Core: Visualizing IPv4 Internet Topology at a Macroscopic Scale in 2007
Since 2000, CAIDA has generated AS Core graphs -- Internet Topology Maps also referred to as AS-level Internet Graphs -- in order to visualize the shifting topology of the Internet over time, as can be seen in the historical view.
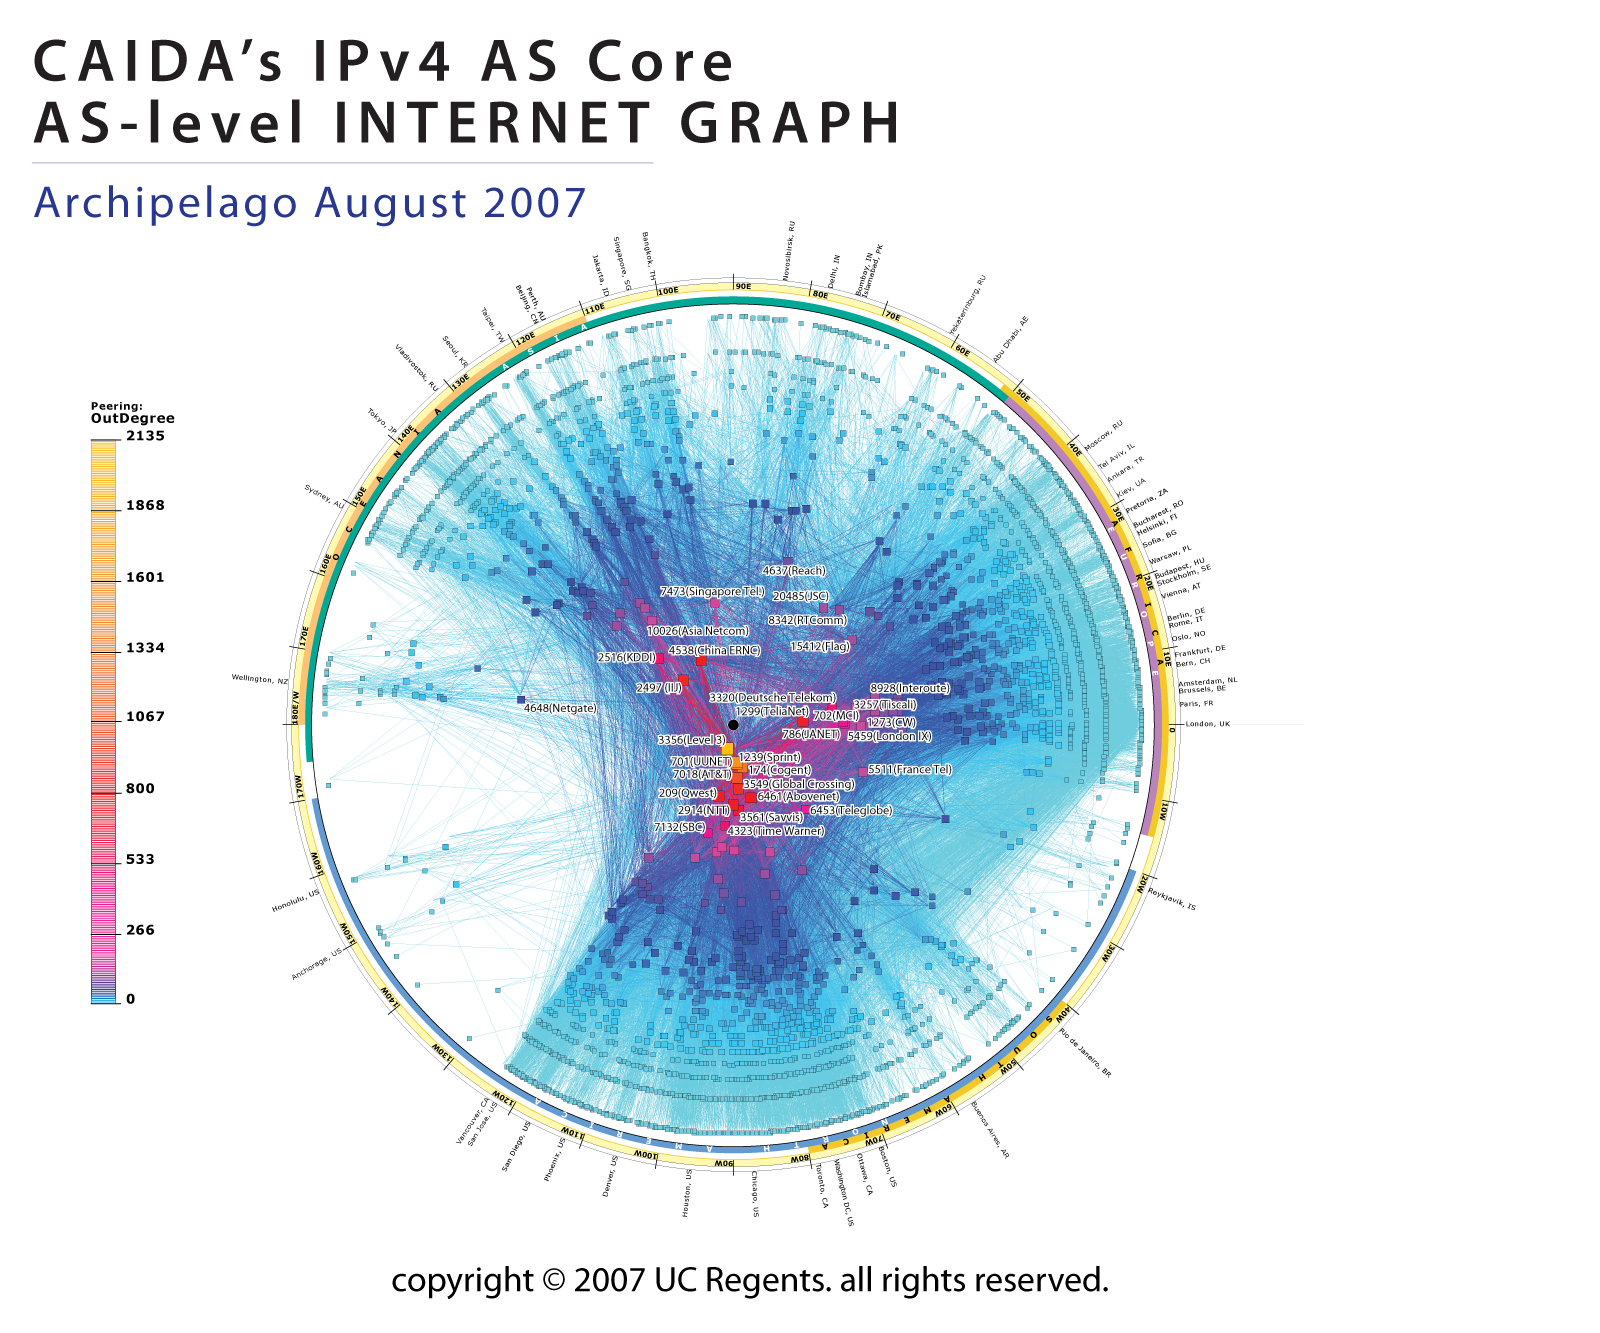
Figure 1. IPv4 AS Core August 2007.
Data Source
This visualization represents a macroscopic snapshot of the Internet for two weeks: August 1st, 2007 through August 15th, 2007. The graph reflects 760,922 IP addresses and 1,400,796 IP links (immediately adjacent addresses in a traceroute-like path) of topology data gathered from 16 measurement hosts probing approximately one million public IPv4 address destinations. These destinations spread across 62,758 (26.7% of the total) globally routable network prefixes as observed in Routeviews's August 1, 2007 BGP RIB snapshot.
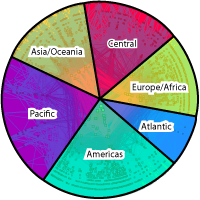
We aggregate this view of the network into a topology of Autonomous Systems (ASes), each of which approximately maps to an Internet Service Provider (ISP). We map each IP address to the AS responsible for routing it, i.e., the origin (end-of-path) AS for the best match IP prefix of this address observed in Border Gateway Protocol (BGP) routing tables. We use the largest publicly available set of core BGP routing tables, collected by the University of Oregon's RouteViews project. The abstracted graph consists of 12,465 Autonomous System (AS) nodes and 35,589 peering sessions. Given the prefixes indicated by the BGP data, we used Digital Envoy's Netacuity to map each AS to the geographic center of its announced address space. The table below shows NetAcuity's placement of the observed ASes by different geographic regions, as delineated by their longitude boundaries. Eighty percent of ASes with known locations are placed in the Americas, Europe/Africa, and Asia/Oceana.
Geographic region of ASes
For previous AS core maps, we used the geographic location of the headquarters of the AS, which yielded similar coordinates, e.g. for 60% of ASes there is less than 0.5 degree (of longitude) difference between the two methods, and for 90% of ASes, less than 14 degrees difference. Our motivation for changing the mapping was the increasing number of ASes not being mapped by our Netgeo tool (which is no longer supported). Our new method reduces the number of unknown AS locations from 1012 to 130. Only 7% of ASes with known locations in both the previous (NetGeo) and current (NetAcuity) mapping changed regions with the change in mapping technique.
 Geographic region of ASes as determined by NetAcuity | Number of ASes (average peering degree), skitter August 2007. | |||||||||||||||||
|---|---|---|---|---|---|---|---|---|---|---|---|---|---|---|---|---|---|---|
| Pacific | Americas | Atlantic | Europe/Africa | Central | Asia/Oceania | unknown | ||||||||||||
| 1.00% | 39.61% | 13.74% | 20.23% | 5.66% | 15.69% | 4.07% | ||||||||||||
| NetGeo | Pacific | 0.92% | 33 (4.7) | 0 | 1 (10.0) | 0 | 0 | 3 (6.3) | 0 | |||||||||
| Americas | 31.28% | 1 (1.0) | 1200 (16.4) | 13 (7.0) | 2 (3.0) | 0 | 8 (5.5) | 30 (2.1) | ||||||||||
| Atlantic | 11.32% | 0 | 6 (24.3) | 329 (10.7) | 90 (6.6) | 14 (18.9) | 3 (2.7) | 12 (1.1) | ||||||||||
| Europe/Africa | 13.02% | 0 | 0 | 39 (42.0) | 456 (7.1) | 14 (18.9) | 0 | 13 (1.4) | ||||||||||
| Central | 3.17% | 0 | 0 | 0 | 15 (5.5) | 106 (4.5) | 2 (1.5) | 4 (1.2) | ||||||||||
| Asia/Oceania | 15.04% | 2 (6.0) | 3 (1.0) | 1 (1.0) | 3 (1.0) | 11 (20.0) | 572 (8.7) | 11 (1.1) | ||||||||||
| unknown | 25.24% | 4 (3.8) | 379 (9.9) | 168 (7.7) | 245 (3.0) | 82 (2.4) | 41 (46.9) | 93 (1.4) | ||||||||||
| ||||||||||||||||||
Layout

Figure 2. location equation.
The position of each AS node is plotted in polar coordinates, pos(radius, angle) (pos(r,q)), where:
The outdegree of an AS node is the number of "next-hop" ASes that were observed accepting traffic from this AS, i.e., peers, according to the AS mapping described above. The link color reflects outdegree, from lowest (blue) to highest (yellow). Some ISPs toward the center have been manually labeled.Analysis
Graphing dimensions of peering richness and geographic information reveals the highly "core-centric" nature of certain ASes based in North America. While ISPs in Europe and Asia have many peering relationships with ISPs in the U.S., we observe fewer links directly between ISPs in Asia and Europe. Both technical (cabling and router placement and management) as well as policy (business cost models and geopolitical considerations) factors contribute to peering arrangements represented in this graph.
A significant observable trend is the globalization of the core, which is shifting away from the US-centric topology of a few years ago. This shift is most visible in the increased connections between and within Asia and Europe compared to visualizations from previous years.
Another significant shift since 2005 is the increased prominence of
Level3 versus its closest rival, UUnet. In 2005 (the last poster we
made), we observed 2,132 Level3 AS links and 2,244 UUnet AS links
(measuring from 24 sources to 971,072 destination IP addresses). In
2006 (we did not make a poster but we had the data) we observed 1,399
Level3 AS links and 1,672 UUnet AS links (measuring from 20 sources to
971,064 destination IP addresses). In 2007 (reflected in this poster)
we observed 1,735 Level3 AS links and 1,432 UUnet AS links from 16
sources to 971,061 destinations. Although the absolute numbers have
dropped for several reasons (loss of CAIDA monitoring locations, decay
of our destination list (both of which we are solving in 2008), and the
increased use of layer-2 peering technologies such as MPLS which we
cannot observe with our IP measurements), the relative prominence of
Level3 from having 20% fewer observable AS links than ATT to 20%
| AS | skitter | key | |||
|---|---|---|---|---|---|
| 2005/04/01 | 2006/08/01 | 2007/08/01 |
# - rank by degree the AS peering degree |
||
| Level 3 (3356) | #2 2,132 | #2 1,399 | #1 1,725 | ||
| UUNet (701) | #1 2,244 | #1 1,672 | #2 1,432 | ||
The full AS adjacencies for the 5 data sets can be found here: https://www.caida.org/projects/as-core/2007/data
The raw skitter traces can be found here: https://www.caida.org/catalog/software/skitter/research
Exploring the reversal in top two providers
We did not have an immediate explanation for this dramatic shift, nor did Level3 when we asked them. To explore whether the difference was a measurement artifact or reflecting real changes in topology of the Internet core, we examined four other sources of data: three additional sources of traceroute data (iplane with 317 source nodes and 110,022 destinations taken from a 2 Sept 2007 database snapshot, CAIDA's IPv4 Routed /24 coverage, using 8 sources and 6.5M destinations, reaching 876,131 unique IP addresses, and Netdimes (this dataset does not provide information about the number of sources or destinations), and two additional snapshots of BGP RIBs (http://www.ripe.net/projects/ris/rawdata.html RIPE's RIS with 26,092 ASes and 16 next hop ASes and Routeviews with 26,121 ASes and 38 next hop ASes, both taken January 1st, 2007.)
| AS | traceroute | BGP | key | |||||
|---|---|---|---|---|---|---|---|---|
| skitter | iplane | IPv4.allpref24 | netdimes* | routeviews | ripe |
# - rank by degree the AS peering degree |
||
| Level 3 (3356) | #1 1,725 | #1 2,141 | #1 1,342 | #1 2,942 | #5 1,449 | #5 1,427 | ||
| UUNet (701) | #2 1,432 | #2 1,512 | #2 889 | #4 2,063 | #1 2,393 | #1 2,324 | ||
*netdimes #2 Cogent (174) 2,663 and #3 AT&T (2018) 2,151.
|
B-T=in BGP, but not traceroute | ||||||
| T-B | B-T | |||||
|---|---|---|---|---|---|---|
| Level 3 (3356) | 11 | 21 | ||||
| Cogent (174) | 21 | 13 | ||||
| AT&T (7018) | 28 | 7 | ||||
| UUnet (701) | 38 | 6 | ||||
| Sprint (1239) | 26 | 9 | ||||
|
||||||
Although iplane, skitter, and CAIDA's IPv4 /24 topology data sources agree on the order of the top 5 ASes, NetDimes data disagrees below the first place, ranking two additional ASes (Cogent and ATT) ahead of UUnet. This difference is consistent with the difference in measurement architecture: iplane (run on planetlab nodes), skitter, and CAIDA measurement hosts are typically on academic networks which are commonly customers of Level 3, and thus will observe more Level 3 connectivity than the more random volunteer population of NetDimes users.
While the two BGP sources were consistent with each other in terms of relative size and order of the ASes, they did not match the four traceroute-based datasets and in particular ranked UUNet most highly connected rather than Level 3. This disagreement may be also rooted in the limitation of our measurement sources to largely academic networks, where they are likely to capture more links between Level 3 and smaller ASes then for other major ISPs.
Poster
The poster below shows CAIDA's IPv4 AS Core from data gathered in July 2007.