Animation of AS core over 18 months from July 2000 to January 2002.
Animations created by Oliver Jakubiec (CAIDA at SDSC).
Copyright UC Regents 2002.
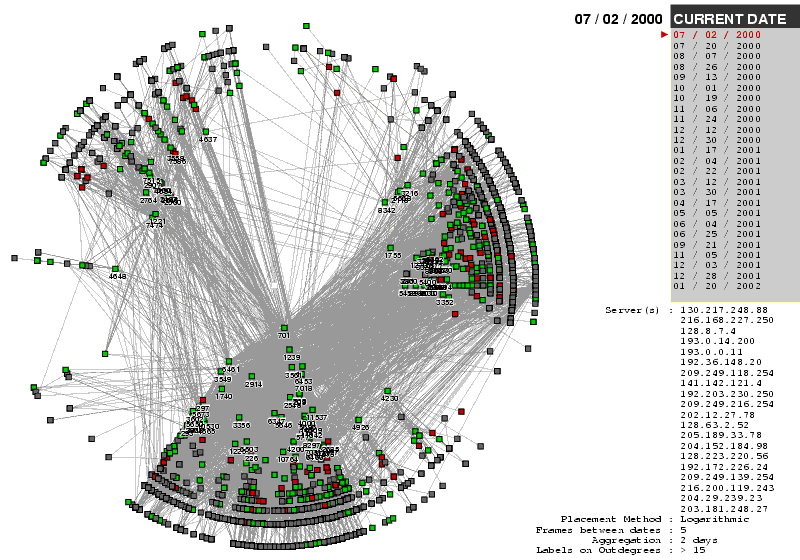
CAIDA animated its observed AS core outdegree data
between July 2000 and January 2002.
As with the still image above,
each AS represents a block of IP addresses
controlled by a single organization, and
relative outdegree reflects the richness of
the connectivity of different ASes.
Note that the large jump in connectivity
that you will observe in July 2001
was the result of a substantial increase in
sampling coverage by CAIDA monitors.
Interestingly, the relative ranking of
observed connectivity among
major ISPs remained essentially unchanged.
Data source: skitter
The animation is available in the animated WEBP format:


 Animations created by Oliver Jakubiec (CAIDA at SDSC).
Copyright UC Regents 2002.
Animations created by Oliver Jakubiec (CAIDA at SDSC).
Copyright UC Regents 2002.