

Introduction
The power of the Internet springs from its ability to route information between machines all over the world. The Internet Protocol version 4 (IPv4) numerical address represents the smallest unit of this global routing infrastructure. The IPv4 routing system requires that each address be unique. To guarantee uniqueness, a single organization, Internet Assigned Numbers Authority (IANA), was created to control and assign address blocks to interested users. As the Internet grew, the following five Regional Internet Registries (RIRs) were introduced as intermediaries [1] [2]:
AfriNIC African Network Information Centre ARIN American Registry for Internet Numbers APNIC Asia Pacific Network Information Centre LACNIC Latin American and Caribbean Internet Addresses Registry RIPE NCC Reséaux IP Européens Network Coordination Centre (RIPE NCC).
Each RIR maintains a database of address space allocations referred to as whois records. Although IANA tracks its own allocations, ARIN's historical data inherited from IANA appears to contain more accurate records for the period prior to 1993. By examining these records we can look back in time and examine the rate and behavior of these allocations. Modeling this behavior, we can then make predictions about the future.
For this study, we downloaded on Sep 14, 2005 IANA's ipv4-address-space file [3] containing the top-level allocations made by IANA to RIRs. We also downloaded the Aug 31, 2005 snapshot of the whois databases of APNIC, ARIN, LACNIC, and RIPE. We were unable to get a snapshot from AfriNIC in time for this study.
Background
Version 4 of the Internet Protocol (IP) uses a 32-bit address space, which provides for over four billion unique host identifiers (addresses for routing data packets between hosts). The IPv4 address space can be divided into 256 equal-sized pieces, each corresponding to a unique value of the leading 8 bits of the 32-bit address space. Notationally, each of these pieces is called a /8 because the leading 8 bits characterize each piece. A /8 is IANA's minimum unit of allocation, and so we use the /8 granularity for our analysis.
IPv4 exhaustion
|
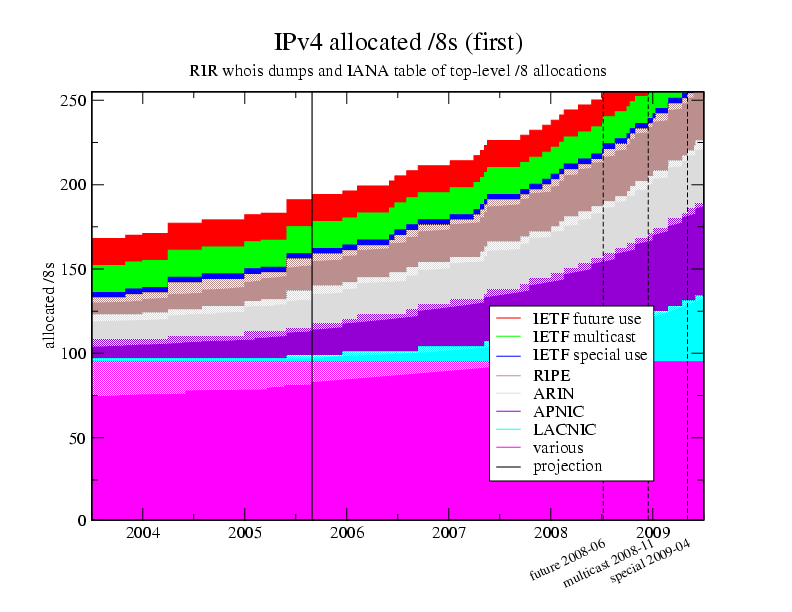
In Figure 1, the address space allocated to each RIR is shown subdivided into two adjacent areas with the same color, one area in solid color and the other filled with a checkered pattern. The checkered area represents the number of addresses allocated from IANA to an RIR, but not yet allocated to RIR member organizations, i.e., ISPs. The solid area represents the number of addresses allocated from an RIR to organizations. In addition to showing the address space allocated to RIRs, we also show the following three address regions reserved by the IETF:
- special use, such as RFC1918 addresses,
- multicast, and
- unspecified future use.
The solid vertical black line around mid-2005 is the boundary between actual data, to the left, and projected data, to the right. The dashed vertical black lines on the right third of the figure represent different dates at which IANA would run out of allocations if current consumption rates prevailed. The vertical ordering of the IETF reserved blocks reflects the likely order in which they would be reclaimed by IANA for reuse as standard address space.
If current consumption rates continue unchanged (a wholly unwarranted assumption) and little of the already allocated space is ever reclaimed (a realistic assumption), then IANA's unallocated IPv4 pool and currently reserved spaces would run dry on March 2009.
Detailed analysis can be found here: IPv4 exhaustion analysis
IPv4 concentration
We study the following questions:
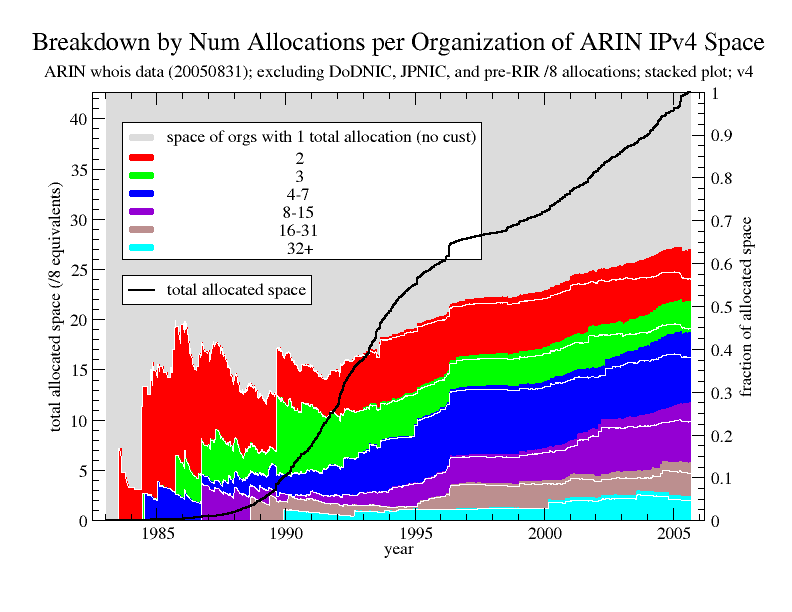
What drives the demand for IPv4 address space? Do new players (organizations that have received only 1 allocation) or old players (organizations that have received multiple allocations over time) drive the growing demand and consumption of IPv4 address space?To quantify the roles played by new players and old players in driving demand, we examine historical address allocations found in whois records and classify them by the category of organization receiving the allocations. Organizations are put into categories according to the number of allocations they have received over the total time period studied. We refine the new player/old player distinction into 7 categories based on the following ranges of allocations: 1, 2, 3, 4-7, 8-15, 16-31, and 32+. The 1 category corresponds to new players, and the remaining categories correspond to old players.
|
Figure 2 is a stacked plot showing, on the right y-axis, the fraction of allocated address space held by each category of organization over time. The figure also shows on the left y-axis the total amount of allocated space over time. Fewer than the equivalent of 5 /8's were allocated prior to 1990, and this low level of total allocation is responsible for the jagged lines in the early years. The clear trend is toward an increasing concentration of the address space in old players -- by August 2005, old players hold between 56.4% and 63.4% of the address space. This disparity is even greater than it first appears, since in terms of the number of organizations, old players make up only between 2% and 11.2%.
We also find that most organizations have relatively few allocations. Depending on the method of counting, there are between 188k and 1.07M organizations in our dataset. Of these, only 28 organizations have 32 or more allocations, and fewer than 500 organizations have 8 or more allocations. So the vast bulk of organizations have fewer than 8 allocations.
Detailed analysis can be found here: IPv4 concentration analysis