
According to the Best Available Data

The CAIDA blog — commentary and analysis of Internet measurement, infrastructure, policy, and economics, published since 2006. Formerly hosted at blog.caida.org. See About the CAIDA Blog · Categories · All entries by month · RSS feed.

AIMS 2016 workshop report

The final report for our 8th Workshop on Active Internet Measurements (AIMS-8) is available for viewing. The abstract:

On 10-12 February 2016, CAIDA hosted the eighth Workshop on Active Internet Measurements (AIMS-8) as part of our series of Internet Statistics and Metrics Analysis (ISMA) workshops. This workshop series provides a forum for stakeholders in Internet active measurement projects to communicate their interests and concerns, and explore cooperative approaches to maximizing the collective benefit of deployed infrastructure and gathered measurements. Discussion topics included: infrastructure development status and plans; experimental design, execution, and cross-validation; challenges to incentivize hosting, sharing, and using measurement infrastructure; data access, sharing, and analytics; and challenges of emerging high bandwidth network measurement infrastructure. Other recurrent topics included paths toward increased interoperability and cooperative use of infrastructures, and ethical frameworks to support active Internet measurement.

See the full workshop report at http://www.caida.org/publications/papers/2016/aims2016_report/

Slides from workshop presentations are available at http://www.caida.org/workshops/aims/1602/
CAIDA's 2015 Annual Report

[Executive summary and link below]

The CAIDA annual report summarizes CAIDA's activities for 2015, in the areas of research, infrastructure, data collection and analysis. Our research projects span Internet topology, routing, security, economics, future Internet architectures, and policy. Our infrastructure, software development, and data sharing activities support measurement-based internet research, both at CAIDA and around the world, with focus on the health and integrity of the global Internet ecosystem. The executive summary is excerpted below:

Mapping the Internet. We continued to pursue Internet cartography, improving our IPv4 and IPv6 topology mapping capabilities using our expanding and extensible Ark measurement infrastructure. We improved the accuracy and sophistication of our topology annotation capabilities, including classification of ISPs and their business relationships. Using our evolving IP address alias resolution measurement system, we collected curated, and released another Internet Topology Data Kit (ITDK). Mapping Interconnection Connectivity and Congestion. We used the Ark infrastructure to support an ambitious collaboration with MIT to map the rich mesh of interconnection in the Internet, with a focus on congestion induced by evolving peering and traffic management practices of CDNs and access ISPs, including methods to detect and localize the congestion to specific points in networks. We undertook several studies to pursue different dimensions of this challenge: identification of interconnection borders from comprehensive measurements of the global Internet topology; identification of the actual physical location (facility) of an interconnection in specific circumstances; and mapping observed evidence of congestion at points of interconnection. We continued producing other related data collection and analysis to enable evaluation of these measurements in the larger context of the evolving ecosystem: quantifying a given ISP's global routing footprint; classification of autonomous systems (ASes) according to business type; and mapping ASes to their owning organizations. In parallel, we examined the peering ecosystem from an economic perspective, exploring fundamental weaknesses and systemic problems of the currently deployed economic framework of Internet interconnection that will continue to cause peering disputes between ASes.

Monitoring Global Internet Security and Stability. We conduct other global monitoring projects, which focus on security and stability aspects of the global Internet: traffic interception events (hijacks), macroscopic outages, and network filtering of spoofed packets. Each of these projects leverages the existing Ark infrastructure, but each has also required the development of new measurement and data aggregation and analysis tools and infrastructure, now at various stages of development. We were tremendously excited to finally finish and release BGPstream, a software framework for processing large amounts of historical and live BGP measurement data. BGPstream serves as one of several data analysis components of our outage-detection monitoring infrastructure, a prototype of which was operating at the end of the year. We published four other papers that either use or leverage the results of internet scanning and other unsolicited traffic to infer macroscopic properties of the Internet.

Future Internet Architectures. The current TCP/IP architecture is showing its age, and the slow uptake of its ostensible upgrade, IPv6, has inspired NSF and other research funding agencies around the world to invest in research on entirely new Internet architectures. We continue to help launch this moonshot from several angles -- routing, security, testbed, management -- while also pursuing and publishing results of six empirical studies of IPv6 deployment and evolution.

Public Policy. Our final research thrust is public policy, an area that expanded in 2015, due to requests from policymakers for empirical research results or guidance to inform industry tussles and telecommunication policies. Most notably, the FCC and AT&T selected CAIDA to be the Independent Measurement Expert in the context of the AT&T/DirecTV merger, which turned out to be as much of a challenge as it was an honor. We also published three position papers each aimed at optimizing different public policy outcomes in the face of a rapidly evolving information and communication technology landscape. We contributed to the development of frameworks for ethical assessment of Internet measurement research methods.

Our infrastructure operations activities also grew this year. We continued to operate active and passive measurement infrastructure with visibility into global Internet behavior, and associated software tools that facilitate network research and security vulnerability analysis. In addition to BGPstream, we expanded our infrastructure activities to include a client-server system for allowing measurement of compliance with BCP38 (ingress filtering best practices) across government, research, and commercial networks, and analysis of resulting data in support of compliance efforts. Our 2014 efforts to expand our data sharing efforts by making older topology and some traffic data sets public have dramatically increased use of our data, reflected in our data sharing statistics. In addition, we were happy to help launch DHS' new IMPACT data sharing initiative toward the end of the year.

Finally, as always, we engaged in a variety of tool development, and outreach activities, including maintaining web sites, publishing 27 peer-reviewed papers, 3 technical reports, 3 workshop reports, 33 presentations, 14 blog entries, and hosting 5 workshops. This report summarizes the status of our activities; details about our research are available in papers, presentations, and interactive resources on our web sites. We also provide listings and links to software tools and data sets shared, and statistics reflecting their usage. sources. Finally, we offer a "CAIDA in numbers" section: statistics on our performance, financial reporting, and supporting resources, including visiting scholars and students, and all funding sources.

For the full 2015 annual report, see http://www.caida.org/home/about/annualreports/2015/

NDN Next Phase Annual Report (2015-2016)

The Named Data Networking project recently published the NDN-NP annual report covering activities from May 2015 through April 2016.).

V. Jacobson, J. Burke, L. Zhang, T. Abdelzaher, B. Zhang, k. claffy, P. Crowley, J. Halderman, C. Papadopoulos, and L. Wang, "Named Data Networking Next Phase (NDN-NP) Project May 2015 - April 2016 Annual Report", Tech. rep., Named Data Networking (NDN), Jun 2016.

This report summarizes our accomplishments during the second year of the Named Data Networking Next Phase (NDN-NP) project (the 5th year of the overall project. This phase of the project focuses on deploying and evaluating the NDN architecture in four environments: building automation management systems, mobile health, multimedia real-time conferencing tools, and scientific data applications. Implementation and testing of pilot applications in these network environments further demonstrated our research progress in namespace design, trust management, and encryption-based access control. Highlights from this year include:

  1. Continued evolution the NDN Forwarding Daemon (NFD), to support application-driven experimentation with new NDN protocol features.
  2. Development of an Android version of NFD to promote NDN experimentation on mobile platforms.
  3. Implementation of a new transport protocol (InfoMax) that can intelligently filter streams of information in order to reduce transmitted data volume, while minimizing loss of information.
  4. A growing portfolio of supporting software libraries, including new APIs, transport mechanisms (Sync, information maximization), and security functionality, that leverage inherent capabilities of NDN, e.g., schematized trust, name-based access control.
  5. Demonstration of extremely scalable forwarding implementation using a billion synthetic names.
  6. Implementation and evaluation of hyperbolic routing performance to understand its feasibility in supporting NDN's interdomain routing.
  7. Multi-faceted evaluation of the architecture, from instrumentation of applications on the testbed, to uses of ndnSIM and the Mini-NDN emulator environment.
  8. Continued uses of NDN in the four courses taught by principal investigators.
  9. The second annual NDN Community meeting hosted by the NDN Consortium to promote a vibrant open source ecosystem of research and experimentation around NDN.

The NDN team has made tremendous progress in the last five years, and a larger community of information-centric networking research has evolved in parallel. Our progress revealed the importance of demonstrating NDN capabilities in IoT and big data environments, and highlighted the need for accessible software platform support and emulation capabilities to facilitate R\&D on both the NDN architecture and applications that leverage it. We have received a year of supplement funding to complete four tasks: 1) completing and disseminating native NDN applications and associated design patterns, 2) demonstrating NDN scalability; 3) documenting and releasing reference implementations, and 4) documenting NDN design decisions and lessons learned.

Toward a Congestion Heatmap of the Internet

In the past year, we have made substantial progress on a system to measure congestion on interdomain links between networks. This effort is part of our NSF-funded project on measuring interdomain connectivity and congestion. The basic nugget of our technique is to send TTL-limited probes from a vantage point (VP) within a network, toward the near and the far end of an interdomain (border) link of that network, and to monitor diurnal patterns in the near and far-side time series. We refer to this method as "Time-Series Latency Probing", or TSLP. Our hypothesis is that a persistently elevated RTT to the far end of the link, but no corresponding RTT elevation to the near side, is a signal of congestion at the interdomain link.

It turns out that identifying interdomain links from a VP inside a network is surprisingly challenging, for several reasons: lack of standard IP address assignment practices for inter domain links; unadvertised address space by ISPs; and myriad things that can go wrong with traceroute measurements (third-party addresses, unresponsive routers). See our paper at the 2014 Internet Measurement Conference (IMC) for a description of these issues. To overcome those challenges and identify network borders from within a network, we have developed bdrmap, an active measurement tool to accurately identify interdomain links between networks. A paper describing the bdrmap algorithms is currently under submission to IMC 2016.

Our second major activity in the last year has been to develop a backend system that manages TSLP probing from our set of distributed vantage points, collects and organizes data, and presents that data for easy analysis and visualization. A major goal of the backend system is to be adaptive, i.e., the probing state should adapt to topological and routing changes in the network. To this end, we run the bdrmap topology discovery process continuously on each VP. Every day, we process completed bdrmap runs from each monitor and add newly discovered interdomain links or update the probing state for existing links (i.e., destinations we can use to probe those links, and the distance of those links from our VP). We then push updated probing lists to the monitor. This adaptive process ensures that we always probe a relatively current state of thousands of interdomain links visible from our VPs.

Third, we have greatly expanded the scale of our measurement system. We started this project in 2014 with an initial set of approximately ten VPs in 5-6 access networks mostly in the United States. We are now running congestion measurements from over sixty Archipelago VPs in 39 networks and 26 countries around the world. Our Ark VPs have sufficient memory and compute power to run both the border mapping process and the TSLP probing without any issues. However, when we looked into porting our measurements to other active measurement platforms such as Bismark or the FCC's measurement infrastructure operated by SamKnows, we found that the OpenWRT-based home routers were too resource-constrained to run bdrmap and TSLP directly. To overcome this challenge, we developed a method to move the bulk of the resource-intensive processing from the VPs to a central controller at CAIDA, so the VP only has to run an efficient probing engine (scamper) with a small memory footprint and low CPU usage. We have deployed a test set of 15 Bismark home routers in this type of remote configuration, with lots of help from the folks at the Bismark Project. Our next target deployment will be a set of >5000 home routers that are part of the FCC-SamKnows Measuring Broadband America infrastructure.

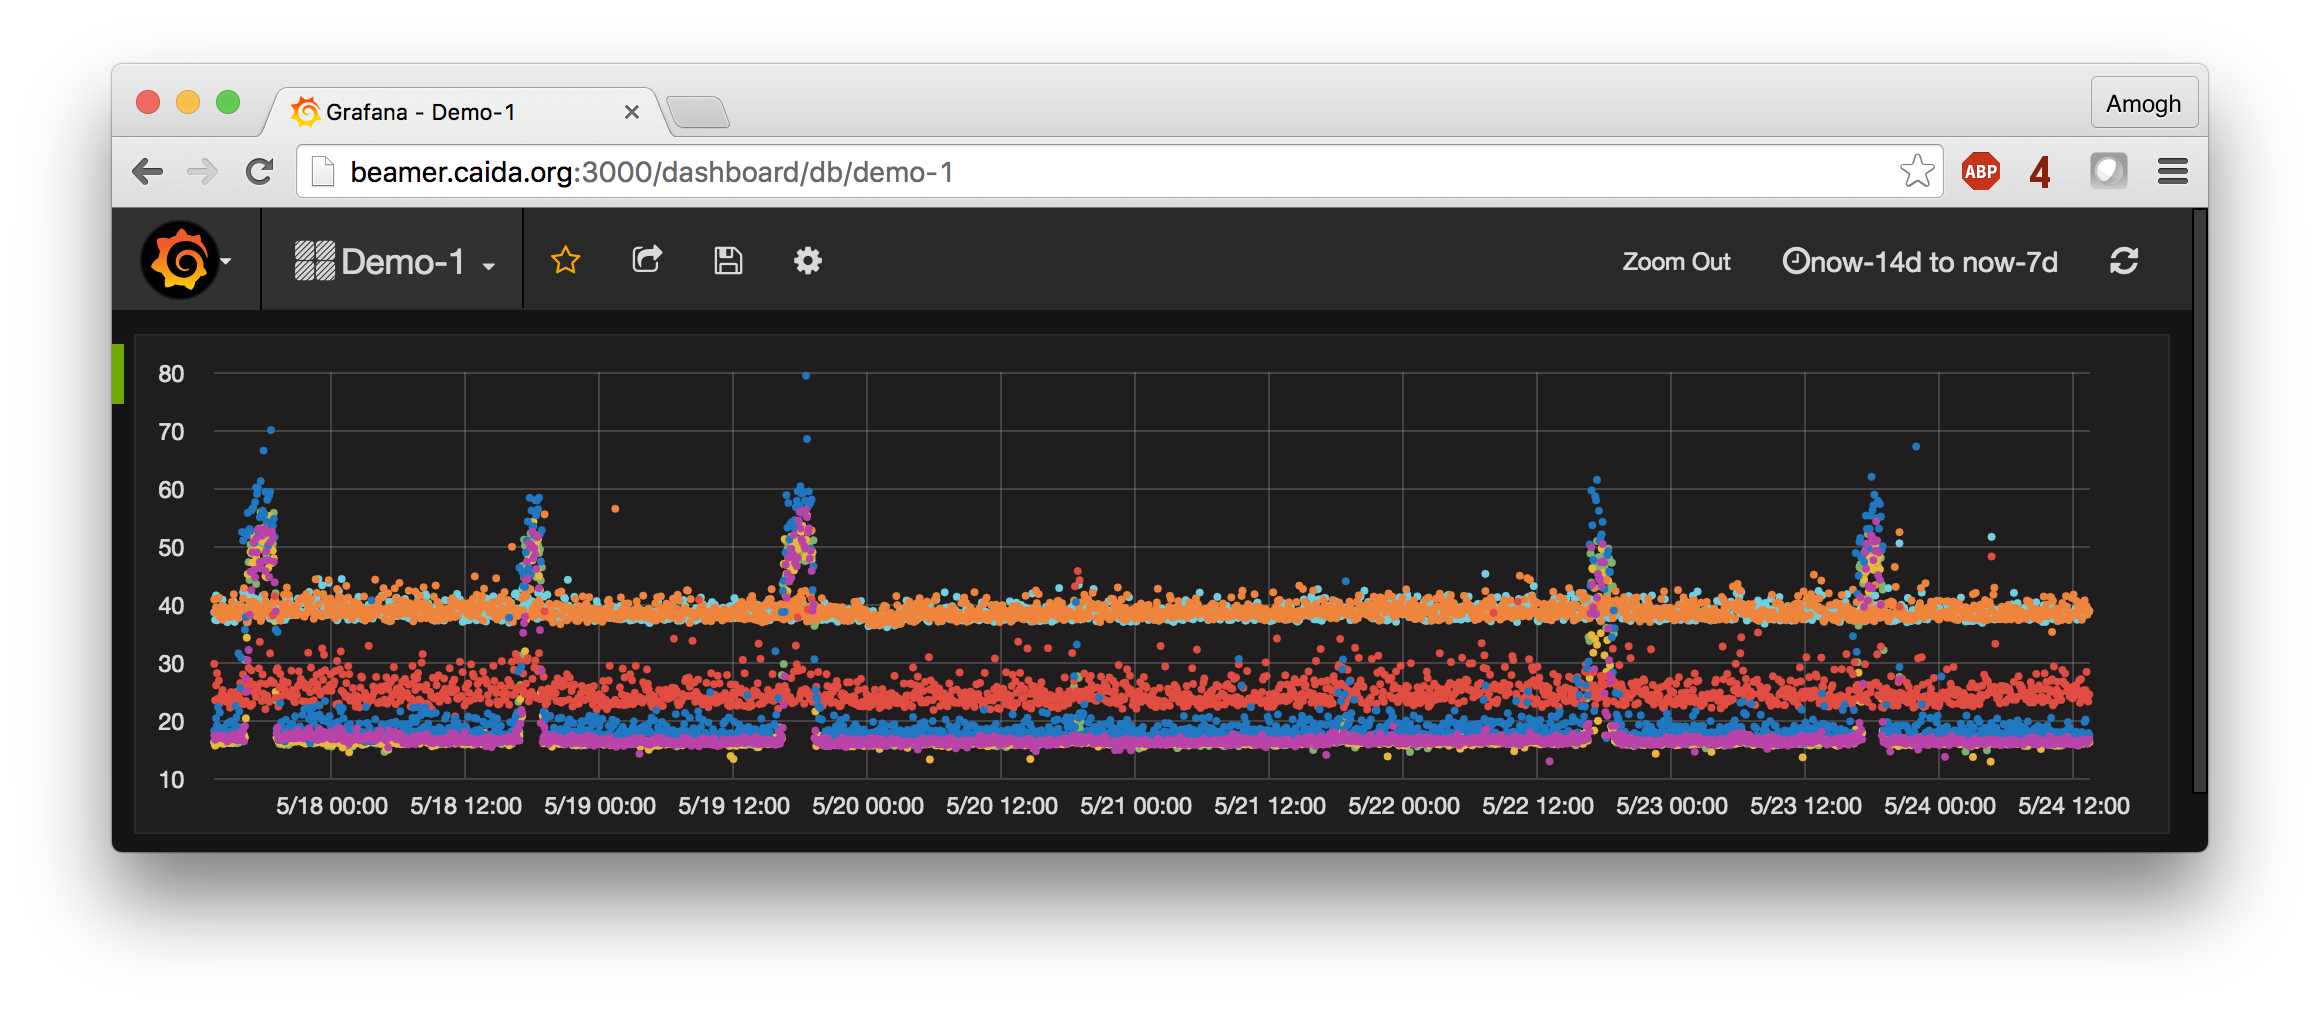
A fourth major advance we have made in the last year is in visualization and analysis of the generated time series data. We were on the lookout for a time series database to store, process and visualize the TSLP data. After some initial experimentation, we found influxDB to be well-suited to our needs, due to its ability to scale to millions of time series, scalable and usable read/write API, and SQL-like querying capability. We also discovered Grafana, a graphing frontend that integrates seamlessly with the influxDB database to provide interactive querying and graphing capability. Visualizing time series plots from a given VP to various neighbor networks and browsing hundreds of time series plots is now possible with a few mouse clicks on the Grafana UI. The figure below shows RTT data for 7 interdomain links between a U.S. access provider and a content provider over the course of a week. This graph took a few minutes to produce with influxDB and Grafana; previously this data exploration would have taken hours using data stored in standard relational databases.


dashboard_agg

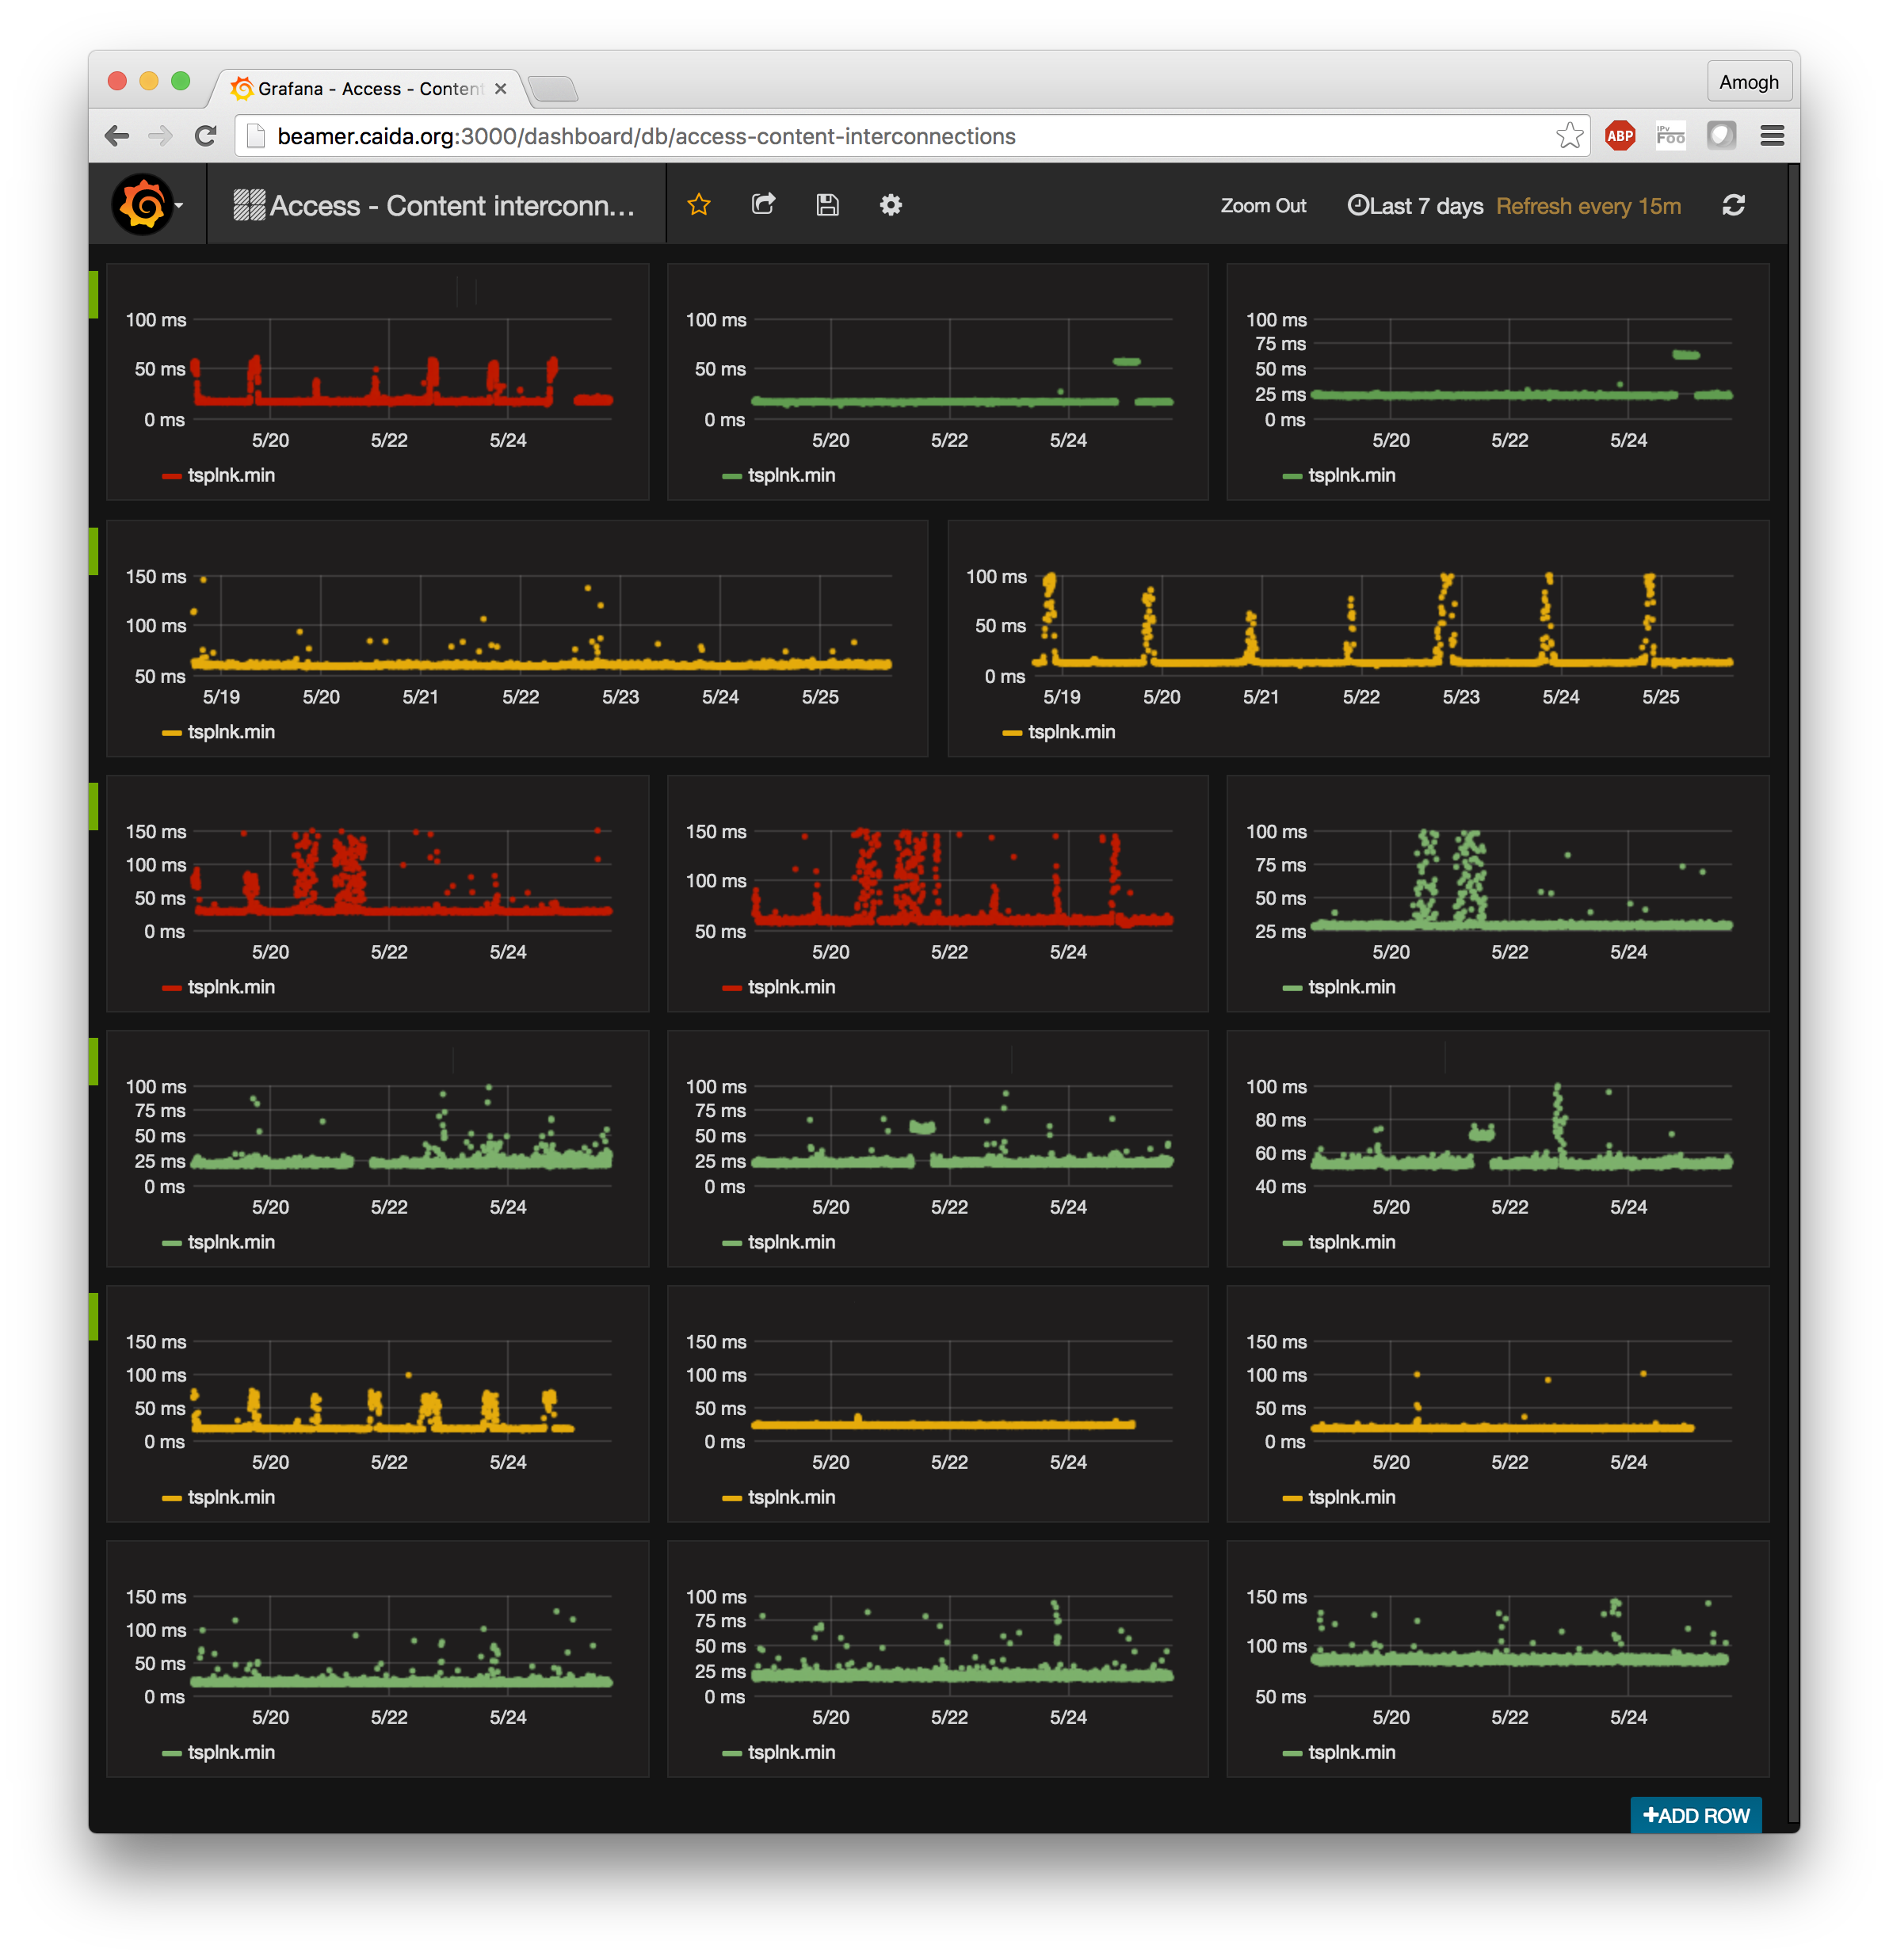
As the cherry on the cake, we have set up the entire system to provide a near real-time view of congestion events. TSLP data is pulled off our VPs and indexed into the influxDB database within 30 minutes of being generated. Grafana provides an auto-refresh mode wherein we can set up a dashboard to periodically refresh when new data is available. There is no technical barrier to shortening the 30-minute duration to an arbitrarily short duration, within reason. The figure below shows a pre-configured dashboard with the real-time congestion state of interdomain links from 5 large access networks in the US to 3 different content providers/CDNs (network names anonymized). Several graphs on that dashboard show a diurnal pattern that signals evidence of congestion on the interdomain link. While drawing pretty pictures and having everything run faster is certainly satisfying, it is neither the goal nor the most challenging aspect of this project. A visualization is only as good as the data that goes into it. Drawing graphs was the easy part; developing a sustainable and scalable system that will keep producing meaningful data was infinitely more challenging. We are delighted with where we are at the moment, and look forward to opening up the data exploration interface for external users.

dashboard-ac

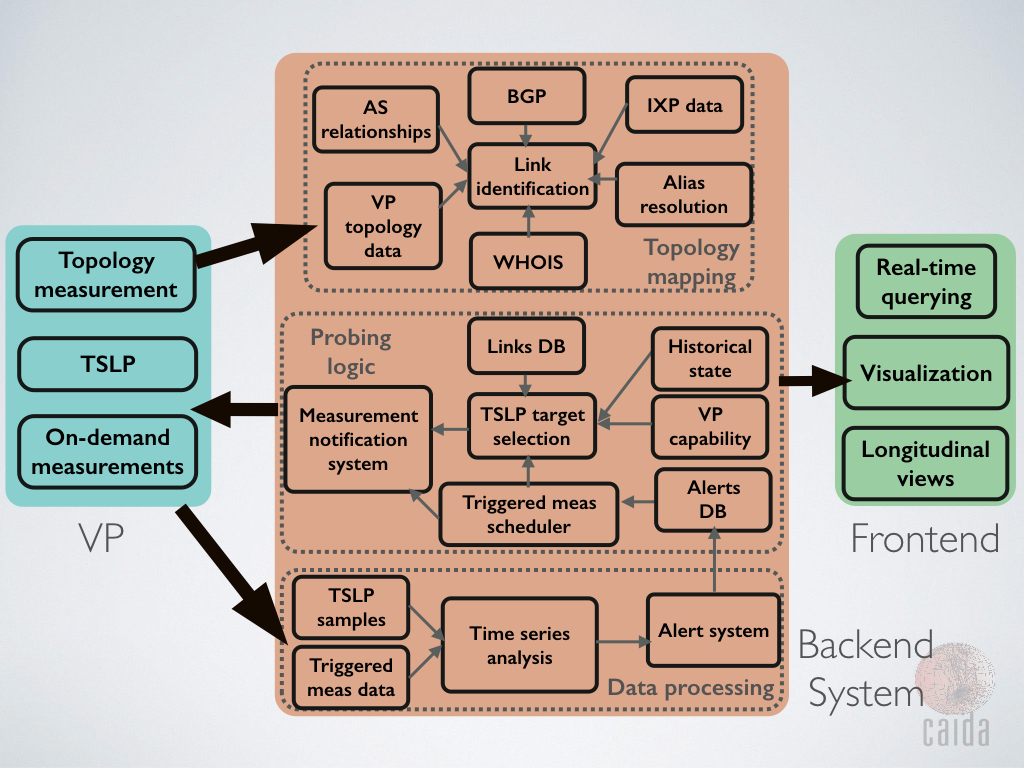
So what happens next? We are far from done here. We are currently working on data analysis modules for time series data with the goal of producing alarms, automatically and without human intervention, that indicate evidence of congestion. Those alarms will be input to a reactive measurement system that we have developed to distribute on-demand measurement tasks to VPs. We envision different types of reactive measurement tasks, e.g., confirming the latency-based evidence of congestion by launching probes to measure loss rate, estimating the impact on achievable throughput by running NDT tests, or estimating potential impacts to user Quality of Experience (QoE). The diagram below shows the various components of the measurement system we are developing. The major piece that remains is continuous analysis of the TSLP data, generating alarms, and pushing on-demand measurements to the reactive measurement system. Stay tuned!

system-diagram

The team: Amogh Dhamdhere, Matthew Luckie, Alex Gamero-Garrido, Bradley Huffaker, kc claffy, Steve Bauer, David Clark

Online course "Internet Measurements: a Hands-on Introduction"

We just learned our colleagues Timur Friedman (UPMC) and Renata Teixeira (INRIA) and Timur Friedman (UPMC) are teaching a new course: "Internet Measurements: a Hands-on Introduction." The course will be available from May 23rd to June 19th, 2016 on the platform France Université Numérique (FUN).

fun_mooc_screenshot

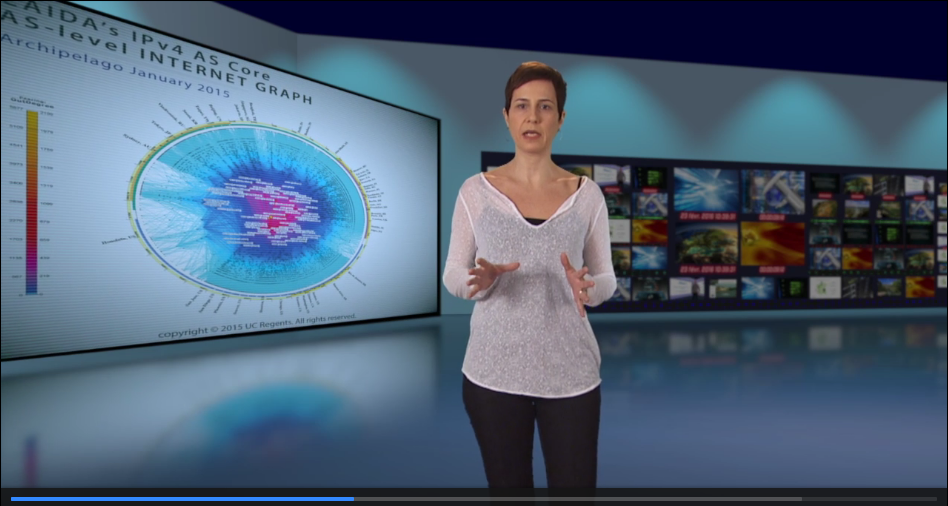
This free online course, taught in English, will cover internet measurement basics including network topology and routes; connectivity, losses, latency, and geolocation; bandwidth; and traffic measurements; with hands-on exercises on PlanetLab Europe.
Students of this course will ideally have a level of understanding of internet technology that comes from an advanced undergraduate course or a first Masters course in networking, or equivalent professional experience.

fun_mooc_screenshot2

Registration and details available at https://www.fun-mooc.fr/courses/inria/41011/session01/about

1st CAIDA BGP Hackathon brings students and community experts together

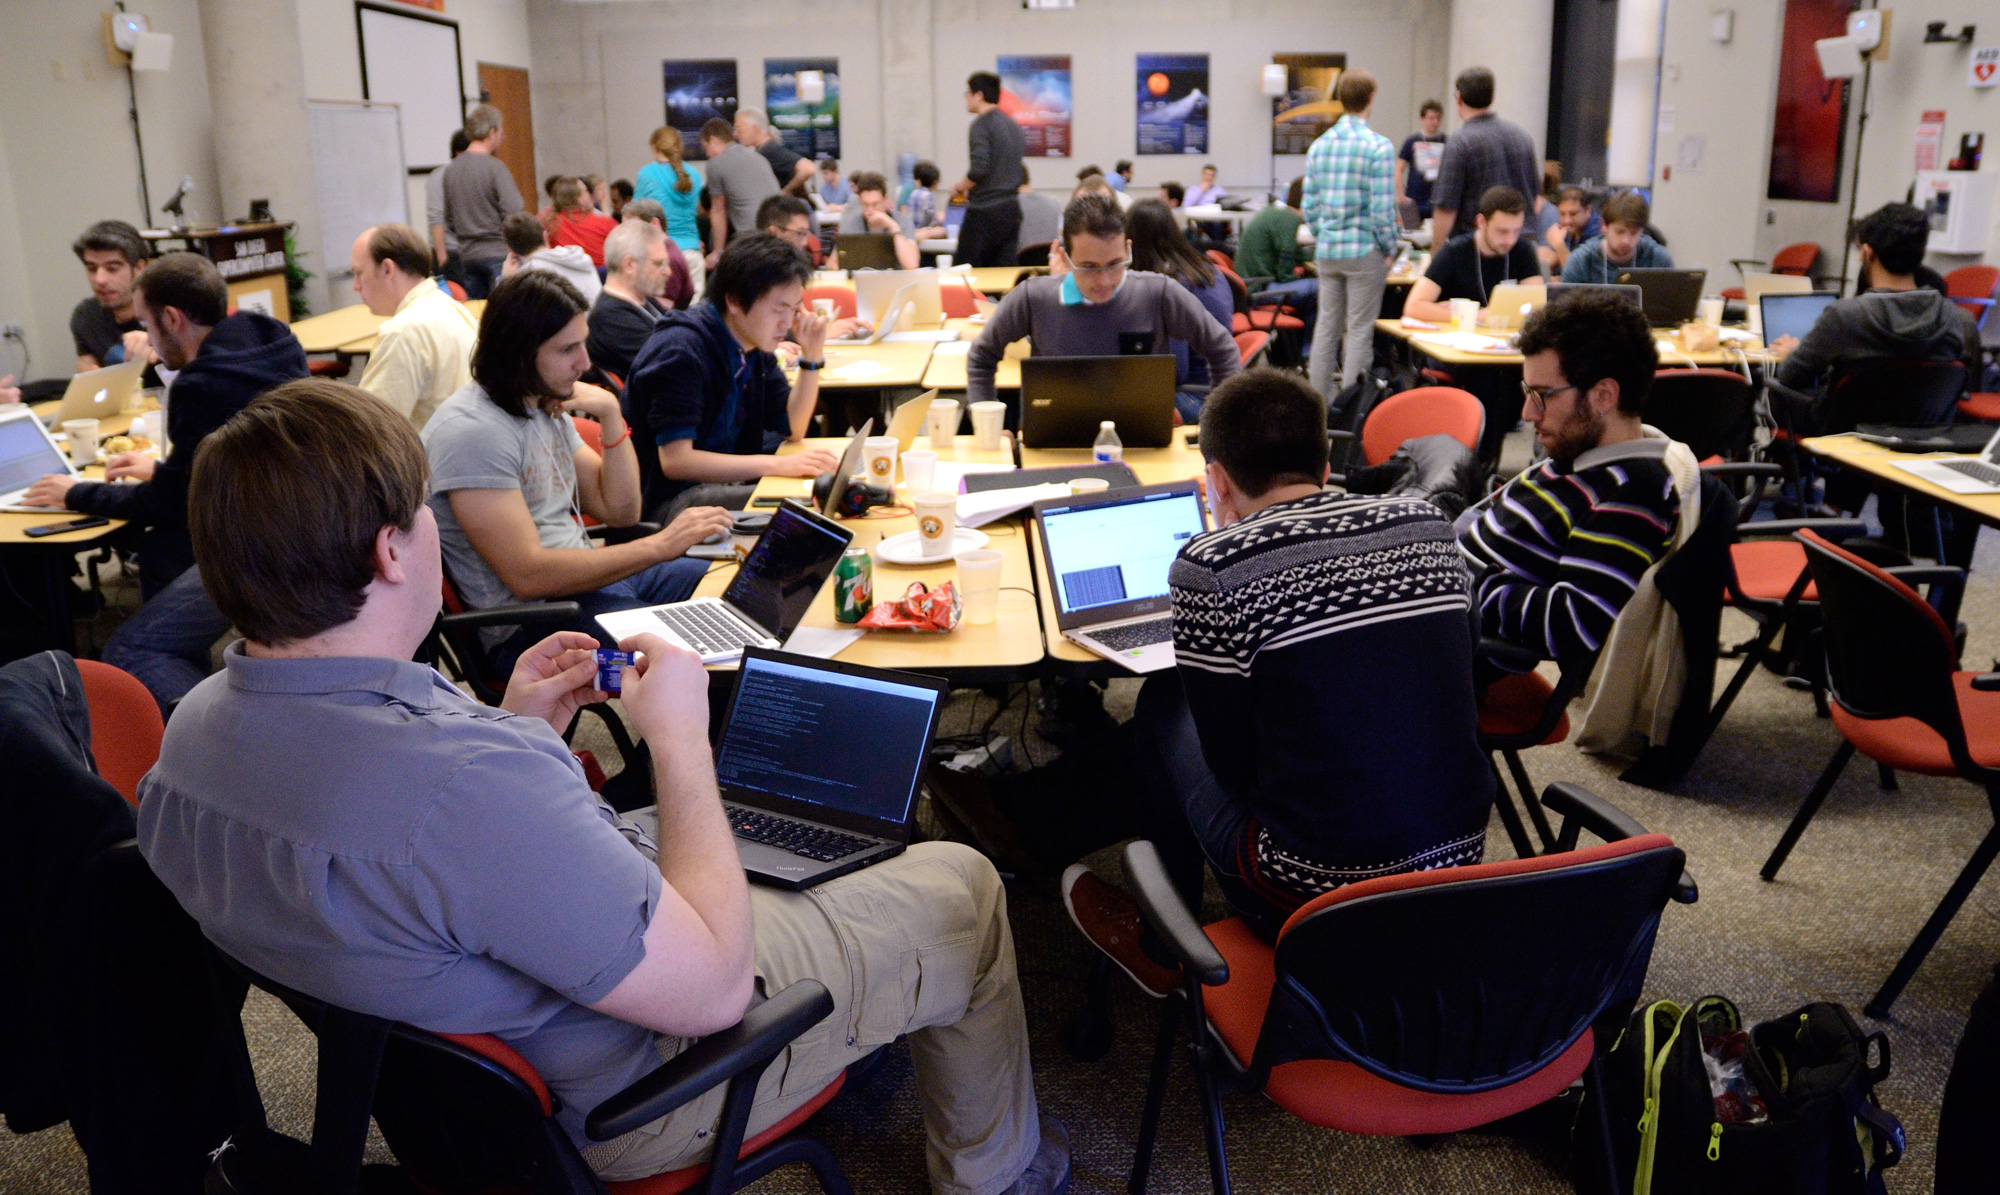
We set out to conduct a social experiment of sorts, to host a hackathon to hack streaming BGP data. We had no idea we would get such an enthusiastic reaction from the community and that we would reach capacity. We were pleasantly surprised at the response to our invitations when 25 experts came to interact with 50 researchers and practitioners (30 of whom were graduate students). We felt honored to have participants from 15 countries around the world and experts from companies such as Cisco, Comcast, Google, Facebook and NTT, who came to share their knowledge and to help guide and assist our challenge teams.

Having so many domain experts from so many institutions and companies with deep technical understanding of the BGP ecosystem together in one room greatly increased the kinetic potential for what we might accomplish over the course of our two days.

BGP Hackathon 2016

Our goal was to create a collaborative, resource rich, communal hacking facility for attendees to undertake challenges that would improve our understanding of the Internet routing infrastructure. Challenge participants, domain experts, and jurors, ninety people in total, came to the San Diego Supercomputer Center on the UC San Diego campus to take part in the first of its kind, CAIDA BGP Hackathon. The students, researchers, and experts came with a shared interest in development of tools to model, measure, and monitor the routing infrastructure of the Internet. They brought enthusiasm and a truly collaborative attitude to which we added live streaming BGP data sources and tools, HPC resources, coffee, authentic neapolitan pizza cooked on the spot and beer.

We organized the BGP Hackathon with a desire to stimulate interaction between operators and academic researchers, to build awareness and use of the publicly available platforms and new tools for analyzing BGP data (e.g.,PEERING and BGPStream), to come together as a community to share knowledge and experience and to identify important problems or impediments to improved understanding of Internet routing.

We were extremely pleased with the proposed challenges and the feedback we received from the community. Click here for the complete list of BGP-Hackathon challenges.

Congratulations to the four winning teams:

  • Ruwaifa Anwar (Stony Brook University, New York, US), Danilo Cicalese (Telecom ParisTech, FR), Nicolas Vivet (FNISA, FR), Kaname Nishizuka (NTT Communications, JP), Danilo Giordano (Politecnico di Torino, IT), Charles Brock (ICASA/NMT, US), and Bruno Machado (Universidade Federal de Minas Gerias, BR) for their work on BGP anomaly detection and event correlation.
  • Shane Alcock (University of Waikato, NZ) for his work on developing filtering capabilities for the BGPStream framework that allows an application to focus on Autonomous Systems of interest.
  • Ricardo Schmidt (University of Twente, NL), Wouter de Vries (University of Twente, NL), Azzam Alsudais (CU Boulder, US), Roya Ensafi (Princeton University, US), and Nick Wolff (OARnet, US) for their work on experiments with the PEERING testbed to better understand Anycast routing.
  • Massimo Candela (RIPE NCC, NL), Maite Gonzalez (NICLabs, Universidad de Chile, CL), Saif Hasan (Facebook, US) and Francesco Benedetto (Roma Tre University, IT) on their work to integrate BGPlay with BGPStream to enable real-time BGP monitoring services.

Other teams made progress on challenges that included: building a management interface for OpenConfig to improve network management; investigating instability between the data plane and the control plane; starting a platform for longitudinal study of propagation and deployment of RPKI based origin validation on the Internet; automating the AS Rank system from raw data retrieval; developing a per-AS Link-Rank algorithm to improve detection of route leaks or hijacks; or building a graph of the Internet topology with interactive map-like navigation functionality.

This incredible event could not have taken place without the generous support of our sponsors who enabled 33 travel grants, provided exemplary hosting facilities, added depth of expertise, and provided state-of-the-art network and computational resources in the form of SDSC's new Comet supercomputer.

  • ACM SIGCOMM
  • Cisco
  • Comcast
  • Department of Homeland Security
  • Google NetOps and Google Open Source Research Groups
  • The Internet Society
  • The National Science Foundation
  • The San Diego Supercomputer Center
  • The University of California, San Diego

A sincere thanks to all who spent time and energy to help make this first CAIDA BGP Hackathon such a success. We hope to maintain the great momentum we felt from the hackathon and look forward to similar events in the future.

So, you want to draw the Internet?

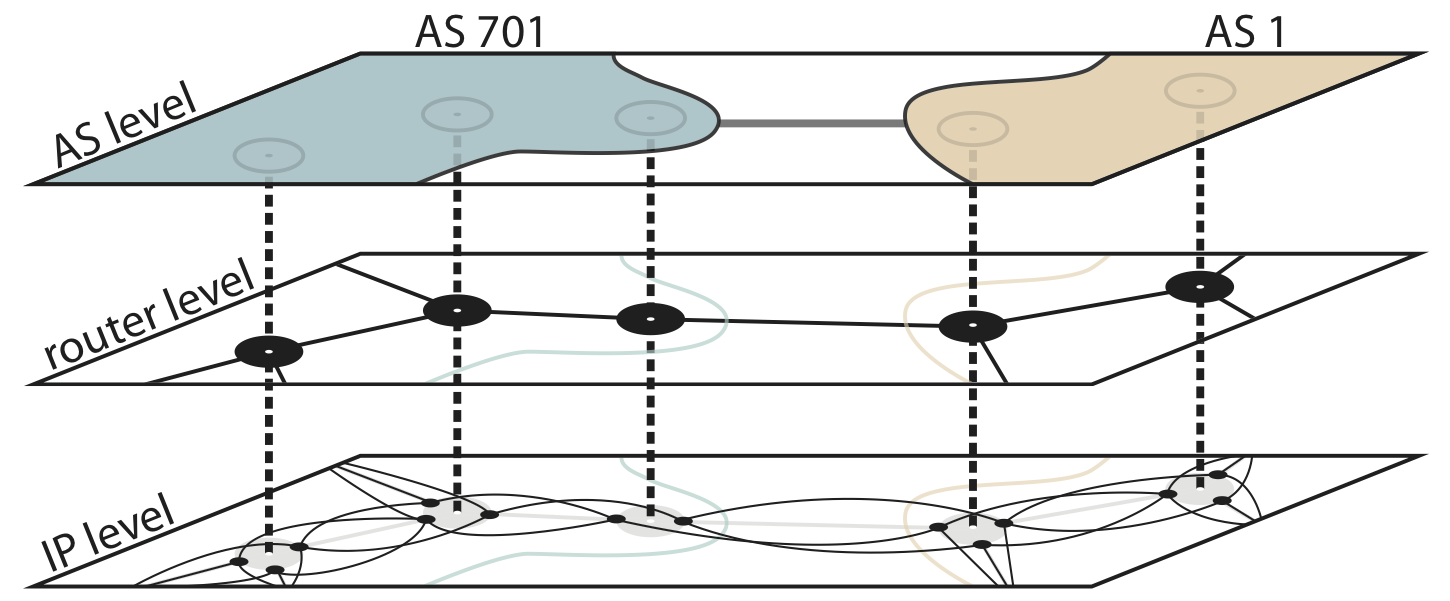
When visualizing the Internet, one can consider several different levels of abstraction, including the Internet Protocal (IP) address, router, and Autonomous System (AS) levels. IP addresses identify interfaces on devices that connect to the Internet. Routers are devices that route traffic by accepting it on one interface and forwarding it out another interface. (Routers may have many interfaces.) An Autonomous Systems (AS) is a set of IP addresses operated under a single administrative umbrella. The three granularities are illustrated below:

Internet level Abstraction

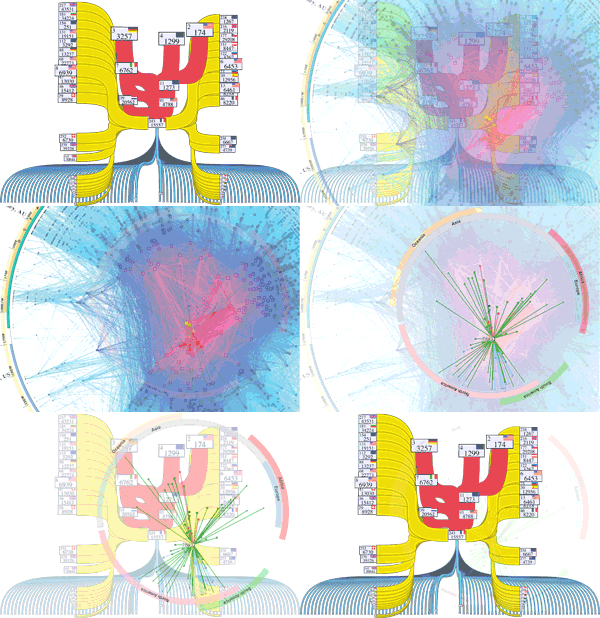
Most Internet mapping methods have focused on characterizing and modeling network structure at the level of interconnected Autonomous Systems (ASes). We have developed different ways to annotate ASes, using a variety of available datasets, to support visualizations of AS topology:
three-views.

I gave a class lecture at UCSD in January 2016 on visualizing Internet AS topology. I also prepared a supplemental data set to facilitate student exploration and experimentation. Comments and feedback welcome!

CAIDA BGP Hackathon 2016 Attendees

We are pleased to post the attendees list for the upcoming CAIDA BGP Hackathon 2016 organized jointly with Colorado State University, University of Southern California, University of Waikato, the Route Views Project, RIPE NCC, Universidade Federal de Minas Gerais and FORTH. We look forward to hosting over 80 attendees -- including more than 20 domain experts -- from over 50 organizations who will come from around the world to participate in the first CAIDA BGP Hackathon at the San Diego Supercomputer Center at UC San Diego in La Jolla, CA. The hackathon is sponsored by industry, professional organizations, and government agencies, with interest in promoting the development of tools to model, measure, and monitor the routing infrastructure of the Internet. This support allowed us to to provide 33 travel grants.

Due to the overwhelming interest in the hackathon, we have reached capacity. We are no longer accepting applications for this year's hackathon.

We would like to give special thanks to our sponsors.

  • ACM SIGCOMM
  • Cisco
  • Comcast
  • Department of Homeland Security (DHS)
  • Google NetOps and Google Open Source Research Group
  • The Internet Society (ISOC)
  • National Science Foundation (NSF)
  • San Diego Supercomputer Center

Please send any questions or media inquiries regarding the hackathon to bgp-hackathon-info at caida dot org.

Report from the 2nd NDN Community Meeting (NDNcomm 2015)

The report for the Second NDN Community Meeting (NDNcomm 2015) is available online now. The meeting, held at UCLA in Los Angeles, California on September 28-29, 2015, provided a platform for attendees from 63 institutions across 13 countries to exchange recent NDN research and development results, to debate existing and proposed functionality in NDN forwarding, routing, and security, and to provide feedback to the NDN architecture design evolution.

[The workshop was partially supported by the National Science Foundation CNS-1345286, CNS-1345318, and CNS-1457074. We thank the NDNcomm Program Committee members for their effort of putting together an excellent program. We thank all participants for their insights and feedback at the workshop.]

CAIDA releases the August 2015 Internet Topology Data Kit (ITDK 2015-08)

Nothing feels better than publishing fresh data for the research community, especially when fresh brings new features. Today, CAIDA released the August 2015 version of our popular Internet Topology Data Kit (ITDK) that includes topologies for both IPv4 and IPv6. CAIDA's ITDK provides researchers with data that describes connectivity and routing observations gathered from a large cross-section of the global Internet. This dataset enables the study of the topology of the IPv4 and IPv6 Internet at the router-level with inferences for assignments of routers to Autonomous Systems (AS). The August 2015 release of the ITDK includes two related IPv4 router-level topologies; an IPv6 router-level topology; assignments of routers to ASes; geographic locations of each router; and Domain Name Service (DNS) lookups of all observed IP addresses.

We produce the ITDKs from active measurements conducted on our Archipelago (Ark) measurement infrastructure. This release made use of 94 Ark monitors located in 36 countries to produce the IPv4 topologies and 26 monitors located in 15 countries for the IPv6 topology.

CAIDA restricts access to recent ITDKs less than two years old. CAIDA provides unrestricted public access to ITDKs older than two years.

For complete details about the ITDK collection process, data files and formats, data availability, and more, please see Macroscopic Internet Topology Data Kit (ITDK).