
According to the Best Available Data

The CAIDA blog — commentary and analysis of Internet measurement, infrastructure, policy, and economics, published since 2006. Formerly hosted at blog.caida.org. See About the CAIDA Blog · Categories · All entries by month · RSS feed.

Exhausted IPv4 address architectures

In light of available data on global IPv6 deployment, ISPs, and those who build equipment for them, have already accepted that multi-level network address translation (NAT, between IPv4 and IPv6 networks) is here for the foreseeable future, with all its limits on end-to-end reachability and application functionality, and its required unscalable per-protocol hacks. Whether "carrier-grade" NAT (CGN) technology supports a transition to IPv6 or becomes the endgame itself is irrelevant to the planning horizon of public companies, who must now develop sustainable business models that accommodate, if not support, IPv4 scarcity. I've heard a few notable predicted outcomes from engineers in the field.

  1. ISPs already offer multiple service classes to support those who want to pay more to get (more) globally unique IP addresses; typical home users will accept to be NATed in the ISP cloud in exchange for keeping their current "low" monthly fees. It is certainly bad for innovation, but the average end user does not care about innovation, they care about web and web-video, which will keep working fine with NAT in most forms.
  2. Multiple layers of NAT will hit P2P technology hard, since P2P is an inherently less attractive prospect when 90% of the peers are not contactable. But if the history of piracy/porn-driven technology is any indicator, we can safely assume that BitTorrent will hack its way through the problem eventually, perhaps unscalably. (Imagine a temporary use of a public IP to knit two NATed TCP sessions together. Shuddering optional.)
  3. Skype, however, which requires a higher level of performance and reachability, must prepare for the worst case ("Pandora") scenario, because their network needs enough publicly routable Skype users to convert into supernodes. They will at least take a profit hit when they need to run a bunch of non-revenue supernodes themselves ``in the cloud''. Or more likely do profit-sharing with ISPs to get the ISP to run supernodes for them next to their giant NAT boxes in the core, similar to today's online streaming videogame providers that put hardware close to gamers, in the ISP datacenters, and to do so they must share revenue with the ISPs. Future attempts to commercialize any P2P technology would face similar obstacles. Since the Internet architecture was designed to be a P2P architecture, admission control by gatekeepers is indeed a manipulation (violation or evolution, depending on your point of view) of the Internet architecture.

Once there are proven business models built on IPv4 scarcity, incumbent ISPs (i.e., those with IPv4 addresses) will be even more incented to invest in the failure of IPv6 than in its success. Equipment vendors already have mixed incentives, as sustaining NAT technology will only grow more complex and challenging, and complex solutions can be sold for a higher profit margin than simplicity. The RIRs are also counter-incented to make IPv6 happen, since it threatens (at best) their business model. Bureaucracies rarely advocate themselves out of existence, or even into dramatic transitions. Especially a bureaucracy composed of members of the industry it's intended to regulate.

Many have acknowledged the lasting harms expected as a result of IPv4 address exhaustion: to users and aspiring new ISP entrants, technical coordination and fault management mechanisms, and most vitally to the unique cooperative governance models. But the leading proposed transition mechanism -- IPv4 address markets -- has never been well-justified as the most obvious or effective -- or even workable -- mechanism for coordinating the distribution of IP addresses during the transition to widespread IPv6 adoption (as Tom Vest noted). On the contrary, it seems obvious that institutionalizing a valuable market in IPv4 addresses is a reliable recipe for removing any incentive for IPv4-holders to invest in upgrading to IPv6. Believing that address markets can help us steward a transition to IPv6 is as grounded in reality as (the same authors') belief that two parallel Internets are a sustainable endgame ("an IPv6 Internet, or at least enough of one to keep off address scarcity for a workable subset of the industry.'')

I'm a known skeptic regarding self-directed architectural transitions of trillion-dollar networked infrastructures with radically distributed ownership, especially accompanied by investment climates that disincent long-term investments in the common good. I also had a front row seat for the last decade, when all the now-IPv6-zealots were admitting how much of IPv6 its designers got wrong. ["They even got the main point wrong! We should have moved to variable length addresses like OSI had in the first place, precisely for the reason of extensibility!''] While running out of addresses is undoubtedly an architectural failure, I suspect we will discover a bigger failure -- of the Internet's current political economy to accommodate a network-layer "innovation" to IPv6, or to anything else. The magic of markets notwithstanding.
my second FCC TAC meeting, and its IPv6 promise

I recently remotely attended my second meeting of the FCC's Technological Advisory Council (slides but no video archives). The chairs of four working groups created at the first TAC meeting (Critical Transitions; IPv6; Broadband Infrastructure Deployment; and Sharing Opportunities) presented their interim results. The FCC then issued a set of ``TAC recommendations'' (which the TAC never saw); it is mostly a wish list from industry to the FCC. Ironically, IPv6 did not appear anywhere in the recommendations, despite being the most popular topic at the first TAC meeting last November, and despite us running out of IPv4 addresses since the last TAC meeting. But the TAC's IPv6 WG did commit to (on slide 53) delivering a report by November 2011 on what the FCC could or should do to help promote IPv6 deployment. Specifically, the WG has the following charter:

The purpose of the IPv6 Transition Working Group is to outline the issues confronting the US Internet infrastructure as it evolves to a new IPv6 addressing system, define baselines associated with the transition that can be used to more effectively gauge progress and provide comparison with other global regions, develop goals for key sectors that can be used to accelerate this transformation and identify major cost and market drivers controlling investment in this infrastructure

Members of the TAC IPv6 working group are: Charlotte Field, chair (Comcast), Nomi Bergman (Bright House Networks), Erwin Hudson (WildBlue Communications), Kevin Kahn (Intel), Hilton Nicholson (SIXNET), Jack Waters (Level3), Mark Gorenberg (Hummer Winblad), Brian Markwalter (Consumer Electronics Association), Randy Nicklas (XO Communications), myself (CAIDA/UCSD) and Walter Johnston of the FCC.

No Internet service providers want to be regulated (or have admitted so publicly), but some providers have expressed concern with the complexity of the transition to IPv6, or lack thereof -- so much concern that they are willing to consider whether the government can do anything to help. Also, many parts of the ecosystem (content providers, consumer electronics firms, infrastructure providers) have expressed interest in better understanding service provider IPv6 deployment activities to inform their own deployment plans. I was asked to gather existing, and recommend future collection of, data to inform IPv6 deployment in the United States.

The good news is that there is more IPv6 data than there used to be, especially in Europe, where they extended our ARIN-sponsored IPv6 survey work to regular reporting in Europe. The bad news is that all the available data still indicates that IPv6 growth is minimal to zero (to negative, for some recent tunneled traffic observations), and providers continue to perceive more bottlenecks than incentives.

The European and Asian RIRs continue to lead IPv6 measurement and empirical studies. RIPE is tracking the number of networks announcing IPv6 connectivity (over 9%!) and supports a tool for measuring IPv6 capabilities via web browsers and posts results from participating sites. RIPE is also participating in World IPv6 day on 8 June 2011. Geoff Huston of APNIC is also regularly reporting measurements and studies of IPv6 deployment (and failures). Tor Anderson of Norway collates links to other IPv6 data as well as providing his own dual-stack web-based measurements.

I was also asked to list what data from carriers would help track the transition, which is not too different from my recommended list of what data should be collected under the BTOP awards. Any or all of the following data would provide a richer picture of IPv6 than we have now:

  1. Peering: Terms of IPv6 interconnection agreements
  2. Purchasing: IPv6-capable hardware and software
  3. Workload: Total and peak utilization of access links (IPv6)
  4. Traffic characteristics: types of traffic using IPv6, e.g., using router flow measurements
  5. Total and peak utilization on interconnection links to other networks (IPv4 and IPv6)
  6. IPv4 and IPv6 address utilization (absolute and %), allocation, and BGP routing dates, i.e., when addresses were first announced
  7. IPv6 support strategies used (e.g., tunneling details)
  8. Topology: router connectivity and geolocation info (to compare against external reachability measurements)
  9. IPv6 DNS queries/response data


But as I said about the BTOP requirements, I did not expect the FCC or NTIA would manage to enforce anything close to them, given the industry's counterincentives to sharing data. And I found out later that none of those data requirements made it to the BTOP contracts. Some at the FCC feel that providers are more likely to volunteer data related to IPv6, I guess we'll see.

CAIDA's IPv6 measurement and analysis activities

In pursuit of more rigorous data on IPv6 deployment, CAIDA has undertaken four IPv6 measurement and analysis exercises: address allocation data; traceroute-based topology; DNS queries from root servers; and a global survey of network operators in 2008.

Address allocation

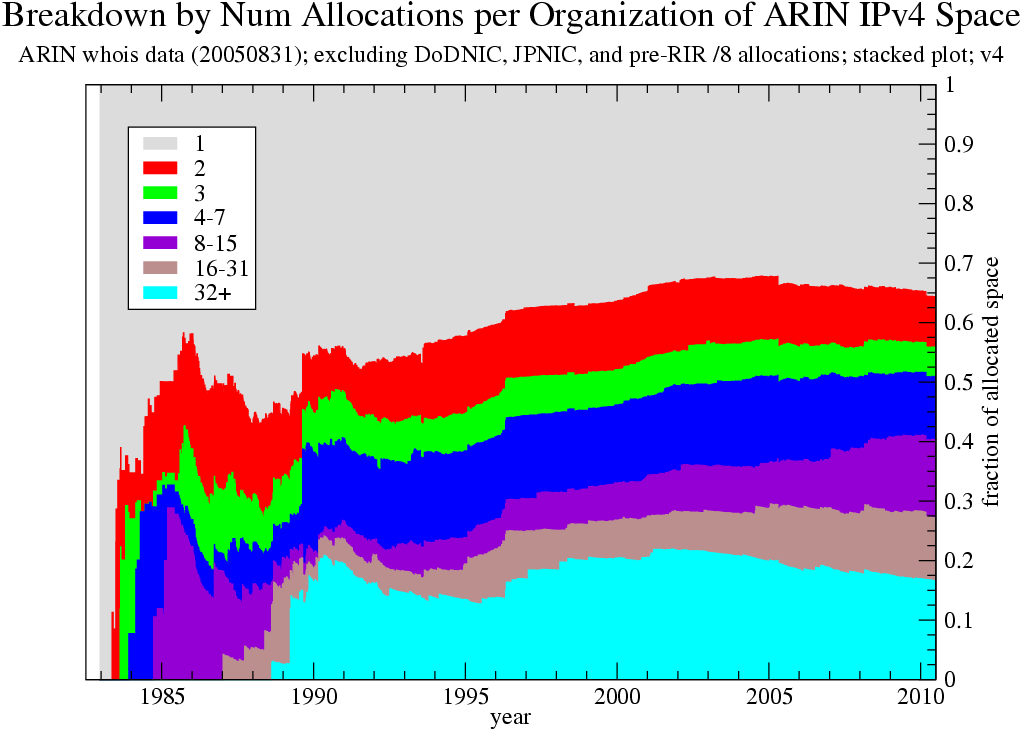
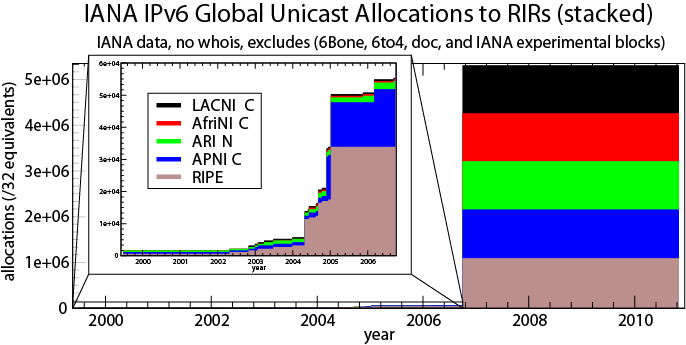
In 2005 ARIN sponsored CAIDA to analyze statistics on IPv4 and IPv6 address allocation [1], with a focus on evaluating demand drivers for address space [2][3]. Figure 1 shows the number of IPv4 prefixes allocated per organization over time, and reveals that allocations tend to go to organizations that already have allocations rather than to new entrants to the field. As of August 2005, old players constituted only between 2% and 11.2% of organizations with address space, but they held more than half of the address space. Figure 2 shows IANA's release of IPv6 space to the registries. The left plot shows a zoomed in subset of IPv6 address allocation until 2006, and indicates that the U.S. region (ARIN) has historically had significantly lower interest in IPv6 than Europe and Asia (RIPE and APNIC, correspondingly). This disparity is consistent with the U.S. holding the majority of the IPv4 space today. In October 2006 IANA implemented a radical policy shift trying to promote IPv6 deployment, giving so much IPv6 address space (a /12) to each regional Internet registry (RIR) to temporarily remove IANA from the equation [4], reflected in the plot on the right of Figure 3. Assuming everyone gives out a /48 (the typical IPv6 prefix allocation size at the time), a /12 gives each RIR an address space to allocate 16 times the size of the entire IPv4 address space. Unsurprisingly, especially in the face of low IPv6 deployment, no RIR has come back to IANA with additional IPv6 addressing needs since then.

Figure 1. Breakdown by Num Allocations per Organization of ARIN IPv4 Space ARIN whois data ; excluding DoDNIC, JPNIC, and pre-RIR /8 allocations; v4
Figure 2: IANA allocation of IPv6 address prefixes to the five regional Internet registries (RIRs) over time.
IP topology measurement

CAIDA has been measuring, analyzing, modeling, and visualizing global Internet topology for over a decade. Our newest active measurement infrastructure Archipelago (Ark) [5] currently has 54 monitors deployed in 29 countries (as of March 2011) and conducts ongoing coordinated large-scale traceroute-based topology measurements. Ark-based IPv4 topology measurements began in September 2007. In December 2008, we started measurements of IPv6 topology using six IPv6-capable monitors, now 16 of our monitors are IPv6-capable. All topology data that we collect are available to academic and government researchers by request [6][7].

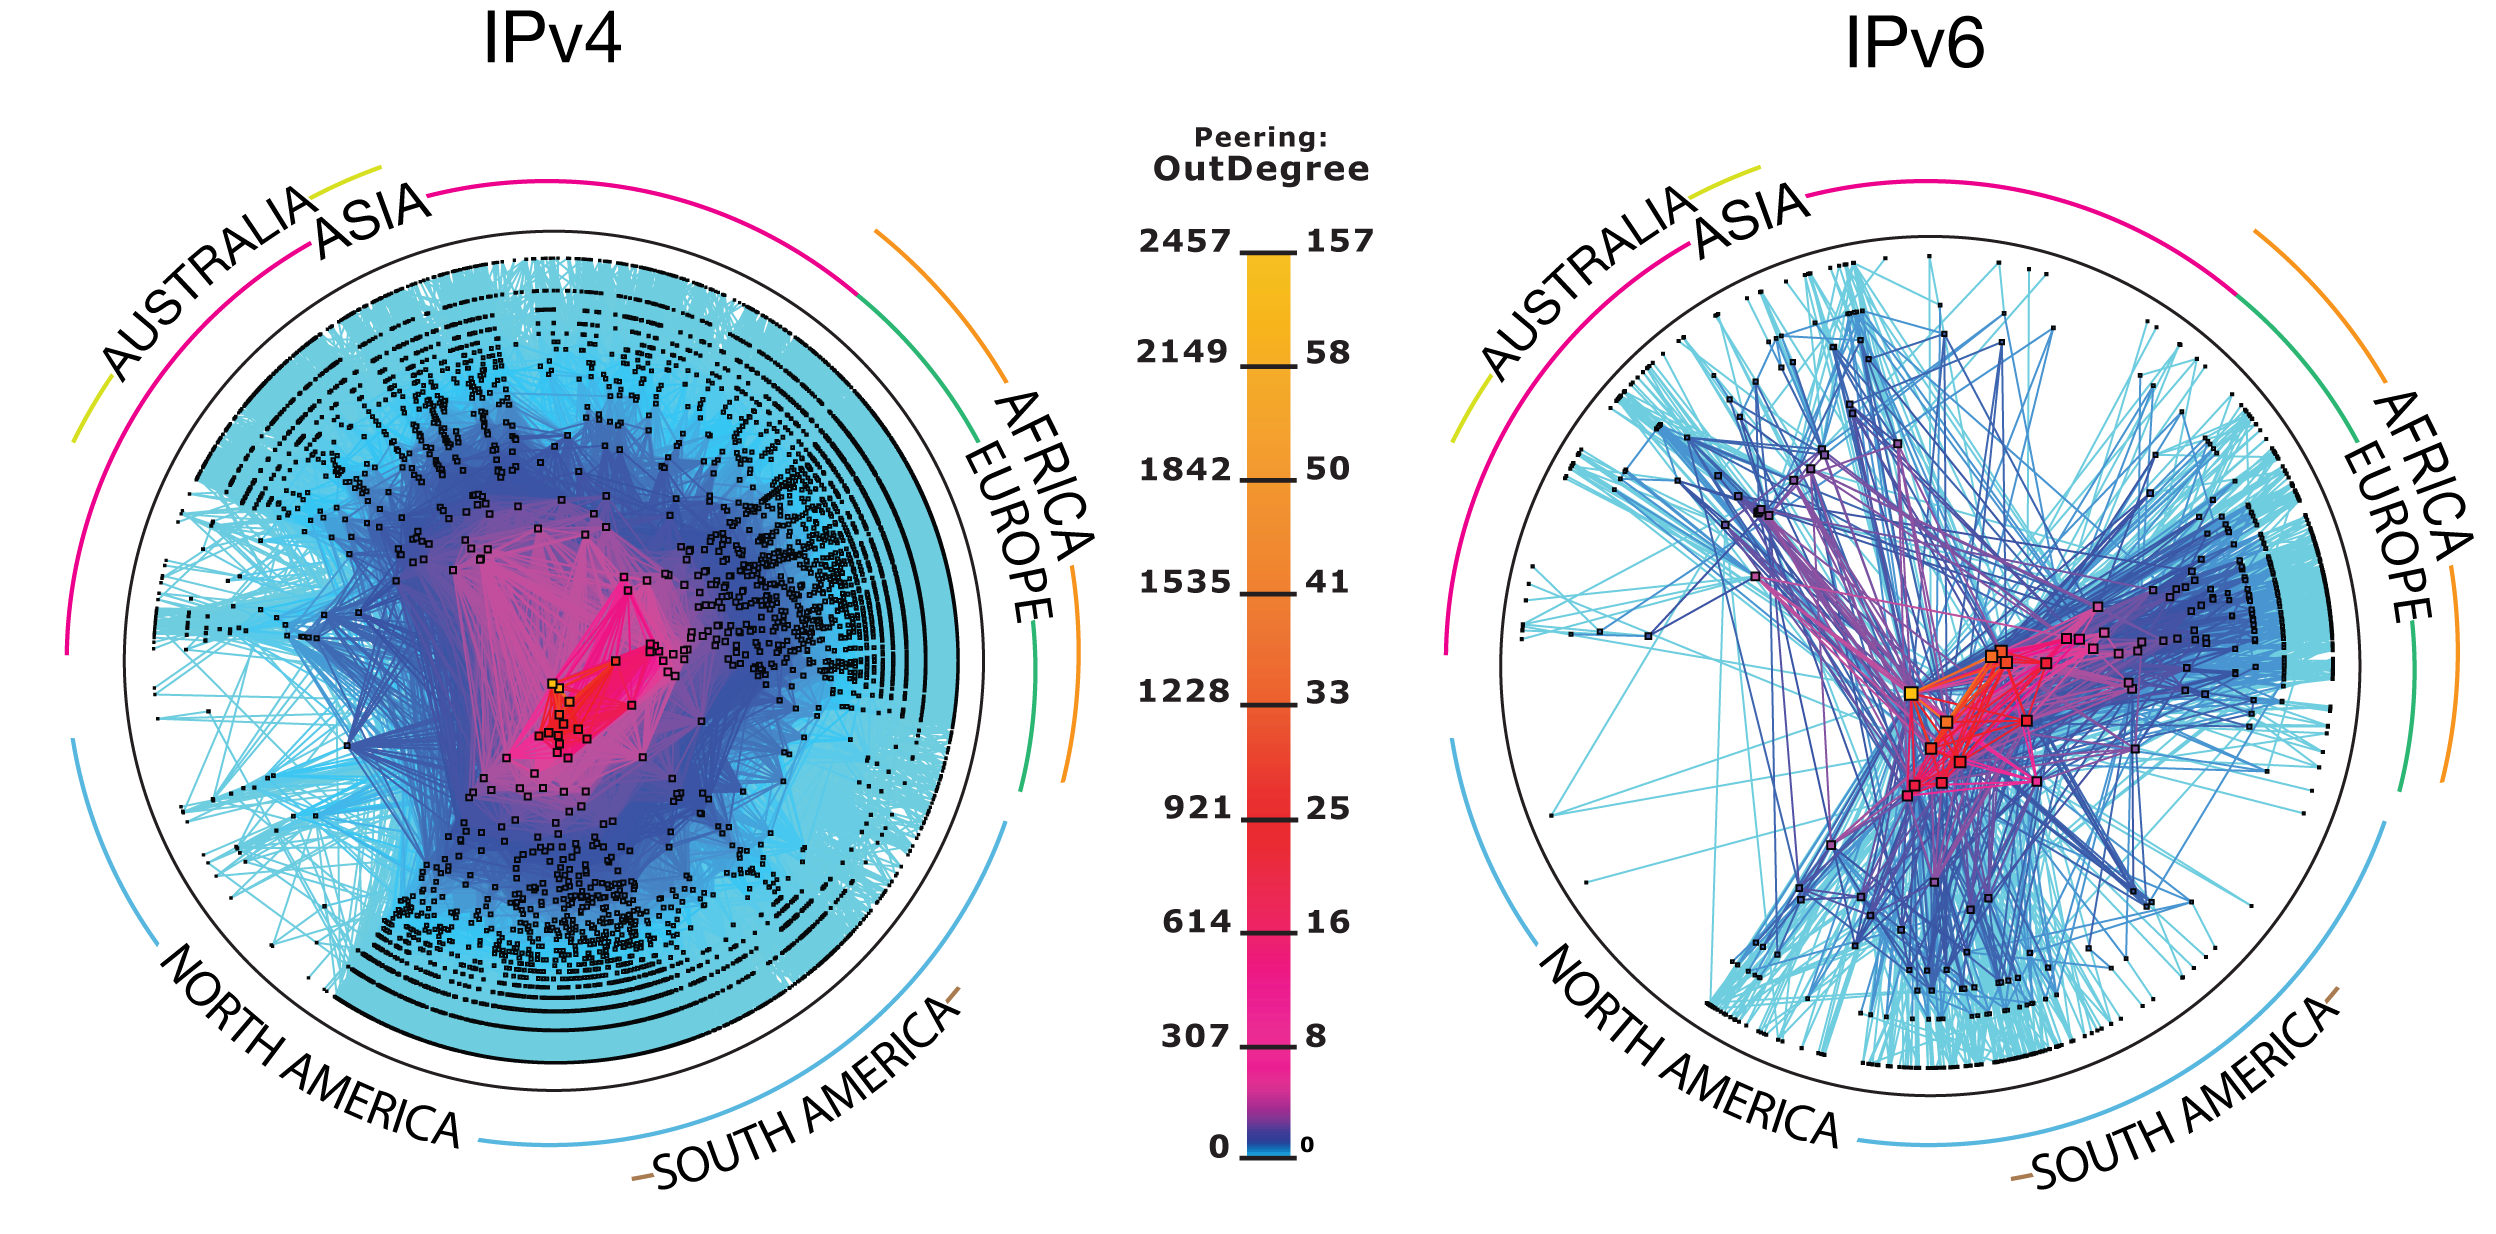
Figure 3: IPv4 and IPv6 AS Core Maps

A well-regarded application of our topology data is the AS-core map visualizing global Internet connectivity. Figure 3 exhibits IPv4 and IPv6 AS-core maps produced in August 2010. For the IPv4 map, CAIDA collected data from 45 Ark monitors located in 24 countries on 6 continents that probed paths toward 17 million /24 networks covering 96% of the routable prefixes seen in the Route Views (BGP) routing tables [8] on 1 August 2010. For the IPv6 map, CAIDA collected data from 12 Ark monitors located in 6 countries on 3 continents. This subset of monitors probed paths toward 307K destinations spread across 3302 IPv6 prefixes which represent 99.6% of the globally routed IPv6 prefixes seen in Route Views on 1 August 2010. To produce the final AS-core maps, we combine the topology view from each monitor into a topology of Autonomous Systems (ASes), which correspond to Internet Service Providers (ISPs) and other organizations participating in interdomain routing. We plot ASes and their links in polar coordinates with the radius equal to the observed outdegree of an AS and 5 allocations (/32 equivalents) allocations (/32 equivalents) the angular coordinate corresponding to the geographical location (longitude) of an AS [9].

The 2010 IPv6 AS-core map consists of 715 AS nodes and 1,672 links (inferred peering sessions) between ASes. For comparison, our previous 2008 IPv6 AS-core map[14] included 515 AS nodes and 1,175 AS-links. In neither 2009 nor 2010 are the top degree-ranked ASes the same across IPv4 and IPv6. The IPv4 core is centered primarily in the United States, while the IPv6 core includes Europe. We observed no high-degree "hub" IPv6 ASes in Asia, surprising given the reportedly large IPv6 deployment in Asia. This gap may reflect the geographic bias of our IPv6-capable monitor deployment: five in the US, four in Europe, and only one in Asia.

Though the IPv4 graph is far larger than the IPv6 graph, the two graphs share many structural properties. Although the maximum degree AS in the IPv4 graph is an order of magnitude larger than for the IPv6 graph, the graphs have similar average AS degrees (5.6 and 4.3, respectively) and average shortest AS path distances (3.5 and 3.3, respectively). The two AS graphs have exactly the same radius of 4 and diameter of 8. These similarities reflect the preference of network operators for short AS paths in both IPv4 and IPv6.

DNS data from "Day in the Life of the Internet" project

For a separate project, we collected and analyzed the largest simultaneous collection of full-payload packet traces from a core component of the global Internet infrastructure ever made available to academic researchers. This dataset consists of four large samples of global DNS traffic collected at participating DNS root servers during annual Day in the Life of the Internet (DITL) experiments conducted in January 2006, January 2007, March 2008, and March 2009 [11].

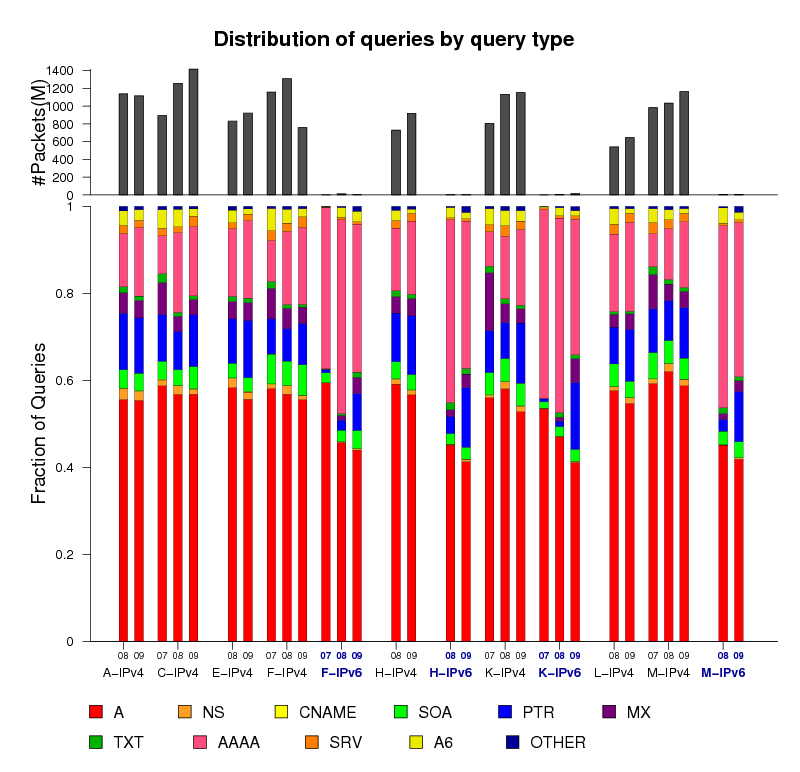
Native IPv6 traffic is still negligible at root servers who measure it, although at four root servers (C, F, K, and M) we observed a progressive yearly increase since 2007 in AAAA queries, which map a hostname to an IPv6 address, using IPv4 for transport. In 2008 we attributed this increase to more clients using operating systems with native IPv6 capabilities such as Apple's MacOSX and Microsoft's Windows Vista [11], which can launch IPv6 queries (in IPv4 packets) even if IPv6 transport is not available. The increase in 2009 is larger, from around 8% on average to 15%. Some of this increase is due to the addition of IPv6 glue records to six of the root servers in February 2008 [12], and does not necessarily reflect use of IPv6 by applications.

Figure 4: Distributions of query by query type

Figure 4 shows the distribution of queries by type observed at eight participating DNS root servers. A-type queries, used to request an IPv4 address for a given hostname, are the most common about 60% of the total, consistently across years. For the four root servers (C, F, K, and M) that have participated in DITL since 2007, Figure 4 shows a progressive yearly increase in AAAA-type queries, which map a hostname to an IPv6 address, using IPv4 for transport. In 2008 we attributed this increase to more clients using operating systems with native IPv6 capabilities such as Apple's MacOSX and Microsoft's Windows Vista [11], which can launch IPv6 queries (in IPv4 packets) even if IPv6 transport is not available. The increase in 2009 is larger, from around 8% on average to 15%. Some of this increase is due to the addition of IPv6 glue records to six of the root servers in February 2008 [12]. The far fewer queries actually carried by IPv6 transport to the root servers (columns with x-axis labels in blue) are a more reliable indication of IPv6 traffic levels and consistent with statistics shown above.

Survey of RIR members

In collaboration with ARIN, we conducted two surveys via the RIR membership email lists, inviting subscribers to fill out a web survey. Our first survey in March 2008 was constrained to the ARIN region only 347 respondents participated. In the second survey conducted in September 2008 we had 1060 survey participants from all five RIRs spanning all geographic regions [13][14]. In early 2009 the European Union decided to re-use our survey [15] to begin to establish some history on IPv6 deployment activity in the European Union; they now do the survey in all five RIR regions and present results at RIPE meetings [16].

Over 70% of survey respondents said their primary motivation for investing resources in IPv6 was "to be ahead of the game." Respondents self-classified as from educational or government organizations were almost twice as likely to have begun their transition toward IPv6 than commercial organizations. Yet, when asked about present hurdles hindering IPv6 deployment, respondents vented their frustration. Obstacles mentioned included registry policies and procedures, lack of quality support for routers, middleboxes and applications, a general lack of IPv6 expertise, and a reluctance to invest resources in the absence of an immediate profitable return -- consistent with the fact that less profit-focused or budget-constrained organizations were more likely to report some kind of IPv6 activity. However, and acknowledging the self-selection bias of the survey, nearly half of respondents answered that they do plan to make the transition to IPv6, while about a third said they were going to "wait and see". No one reported carrying significant IPv6 traffic. Perhaps most disturbing and yet least surprising, survey respondents collectively expected to need more IPv4 addresses in the next two years than remain in the unallocated pool.

Implications

The scant data available reveal two concerns: (1) architectural transitions, even those deemed not radical but critical, are slow; (2) the U.S. is behind other regions of the world, and has not thus far invested in shedding quantitative light on this problem, despite making attempts to lightly nudge the market toward IPv6 adoption.

References
[1] kc claffy, Apocalypse then: IPv4 address space depletion, Oct. 2005.
[2] B. Huffaker, Y. Hyun, and kc claffy, "IPv4 Address Space Concentration", 2008.
[3] Y. Hyun, "IPv6 Address Space Concentration", 2008.
[4] J. Sweeting, "Policy 2004-8: Allocation of ipv6 address space by the internet assigned numbers authority (iana) policy to regional internet registries", 2006.
[5] Y. Hyun and CAIDA, "Archipelago Measurement Infrastructure", 2009.
[6] CAIDA, "The IPv4 Routed /24 Topology Dataset", 2009.
[7] CAIDA, "The IPv6 Topology Dataset", 2009.
[8] D. Meyer, "University of Oregon Route Views Project".
[9] CAIDA, "Visualizing IPv4 and IPv6 Internet Topology at a Macroscopic Scale", 2009.
[10] CAIDA, "Visualizing IPv6 AS-level Internet Topology 2008", 2008.
[11] S. Castro, D. Wessels, M. Fomenkov, and k claffy, "A Day at the Root of the Internet," ACM SIGCOMM Computer Communications Review, Oct. 2008.
[12] IANA, "IPv6 Addresses for the Root Servers", 2008.
[13] kc claffy, Bradley Huffaker, Young Hyun, "ARIN and CAIDA IPv6 Survey Summary - April 2008," Apr. 2008.
[14]kc claffy and CAIDA, "ARIN and CAIDA IPv6 Survey Summary - October 2008," October 2008.
[15] M. Botterman, "EU IPv6 survey proposed to May 2009 RIPE meeting", 2009.
[16] M. Botterman, "2010 IPv6 survey results, presented at RIPE 61", 2009.

Data on current status of IPv6 deployment

[Last month, I remotely attended the second meeting of the FCC's current Technical Advisory Committee (TAC), where chairs of several working groups set up at the first meeting (in November) reported on their progress and plans. I'm a member of the FCC TAC's IPv6 working group, (more on this soon), and so far have been asked to answer two questions I've been thinking about for a couple of years: what data do we have to gauge IPv6 deployment by Internet service providers, and what data do we need? Last November I addressed the first question in a (still pending) NSF proposal to measure IPv6 deployment, with the following text. I'll post some updates shortly.]

IANA allocated the first IPv6 address in 1999. Today, estimates of IPv6 penetration span at least three orders of magnitude across different sources, which is arguably consistent with the wide range of interest (or lack of interest) in this new protocol. The U.S. federal government is again requiring IPv6 deployment within .gov networks [1][2]. Although most agencies have thus far only done the bare minimum in response to such regulations, it is still a sign that the U.S. is willing to regulate into existence a critical information technology [3][4]. Yet the economic crisis has further lowered the chance that any ISPs will voluntarily invest capital in creating and operating the parallel networks that will be required while the world transitions to IPv6.

Many attempts have been made to evaluate the status of IPv6 adoption and penetration [5][6][7][8][9][10][11][12][13][14][15][16][17]. None have found significant activity, even though IPv6 has been implemented on all major network and host operating systems. Current levels of observable IPv6 activity are well below 1% [16][13][17], although up to 7% of global Autonomous Systems announce at least one IPv6 prefix [14]. By some accounts, IPv6 development is progressing faster in Asian countries: Japan, South Korea, China [18] . Notably, the 2008 Summer Olympics was the first major world event with a presence on the IPv6 Internet [19].

Traffic data is the most accurate way to measure actual IPv6 usage, but also has the most difficult policy obstacles to access, and does not reveal preparatory activity. Arbor Networks [16] reported that observable IPv6 (6to4) traffic remained less than one twentieth of one percent (<0.05%) of traffic they observed at their sensors in October 2010, though they point out this is two orders of magnitude larger than in 2008, and is admittedly a lower bound on IPv6 traffic due to observation capability limitations. CAIDA measurements of an OC-192 commercial backbone link in April 2010 showed a similarly low IPv6 traffic level of 0.005% of packets [20].

Given the difficulty of measuring IPv6 directly, Huston and Michaelson [7] studied a range of types of data collected over four years (January 2004 to April 2008) that might reflect IPv6 activity. They analyzed inter-domain routing announcement data, access logs from www.apnic.net, and data captured from queries of reverse DNS zones that map IPv4 and IPv6 addresses back to domain names. All of their metrics show some increase in IPv6 deployment activity starting in the second half of 2006, but they emphasize that their metrics are limited in scientific integrity; most only measure some interest in IPv6 rather than usable IPv6 support.

Hurricane Electric maintains daily statistics [9] on IPv6 metrics such as domains registered with AAAA DNS records (which provide a mapping from hostnames to IPv6 addresses). Mark Prior [11] posts weekly results of testing IPv6 reachability to web, email, DNS, NTP, and jabber ports for Internet2 sites and partners. None of these sites show aggregated long term trends.

Not only do we lack data that would provide a complete picture of IPv6 deployment [5]; we do not even have consensus on the definition of IPv6 usage, much less growth. Even more challenging to policymakers, researchers, and operators are the tremendous counter-incentives to sharing data to establish empirically grounded consensus, including the time and money it takes to obtain measurements. Internet2 is an eye-opening example -- it operates the U.S. national research and education backbone, which supports IPv6, but their routers have not thus far supported IPv6 flow statistics, so we have not even been able to obtain regular data on IPv6 usage on our own national research backbone [21]. (Internet2 is working on it.)

References
[1] R. Mohan, "Will U.S. Government Directives Spur IPv6 Adoption?,", September 2010.
[2] T. Wheeler, "Launching the TAC Blog Series", November 2010.
[3] R. Broesma, DREN IPv6 implementation update, July 2008.
[4] J. Baird, The DoD HPC Modernization Program Helps Make The Transition To IPv6, 2008.
[5] H. Ringberg, C. Labovitz, D. McPherson and S. Iekel-Johnson, "A One Year Study of Internet IPv6 Traffic", 2008.
[6] L. Colitti, "Global IPv6 Statistics - Measuring the current state of IPv6 for ordinary users", 2008.
[7] G. Huston and G. Michaelson, "Measuring IPv6 Deployment", 2008.
[8] E. Karpilovsky, A. Gerber, D. Pei, J. Rexford, and A. Shaikh, "Quantifying the Extent of IPv6 Deployment", in PAM 2009, (Seoul, Korea), Apr 2009.
[9] M. Leber, Global IPv6 Deployment Progress Report, 2006.
[10] T. Kuehne, Examining Actual State of IPv6 Deployment, 2008.
[11] M. Prior, IPv6 survey, 2009.
[12] M. Abrahamsson, some real life data, 2008.
[13] E. Aben, IPv4/IPv6 measurements for: RIPE-NCC, November 2010.
[14] E. Aben, "Interesting Graph - Networks with IPv6 over Time,", November 2010.
[15] E. Aben, "Measuring IPv6 at Web Clients and Caching Resolvers,", Mar. 2010.
[16] Craig Labovitz, "IPv6 Momentum?"
[17] Roch Guerin, "IPv6 Adoption Monitor".
[18] Ma Yan, "Construction of CNGI-CERNET IPv6 CPN", 2009.
[19] Olympic Games 2008, 2008.
[20] E. Aben, M. Dusi, and kc claffy, "Packet size distribution comparison between Internet links in 1998 and 2008", 2008.
[21] J. S. Sauver, "IPv6 and The Security of Your Network and Systems", 2009. presented at April 2009 I2 member meeting,

annotated bibliography of IP geolocation papers

Many applications require the association of Internet numbering resources with an accurate geographic label at some granularity. For some applications, knowing the country of origin might be sufficient; for others a more precise indication at state, city or zip code granularity, or even a specific latitude/longitude is needed.

However, which method(s) work best? Which database sources and services are most reliable, at what geographic resolutions? If a data source provides the geographic location of the owner of an IP address, is this location the same as the location where the device is actually broadcasting and receiving packets? And, if different, can the difference be quantified?

As part of our effort to compare IP geolocation tools, we conducted a literature search and created an annotated bibliography of papers and data sets related to the field of Internet Protocol (IP) address geolocation. We include a list of useful definitions, categorized papers, and some discussion of the state-of-the-art. We are still working on a paper that quantitatively compares the granularity and agreement among several available services; we will link to the paper here when published.

Thoughts on Internet2/UCAN business models

This month Internet2's new UCAN project issued a call for white papers on how they could use their $65M BTOP grant in operationally sustainable ways, i.e., so the infrastructure they build will have a chance of surviving when the federal stimulus project money runs out.

We held a relevant workshop 5 years ago, part of which was published in CommLaw the following year. I've also written several other essays on related issues:

  • Data collection and reporting requirements for broadband stimulus recipients
  • Top ten ($7.2B) broadband stimulus: ideal conditions
  • Apostle of a new faith “whose miracles can be seen in front of people”
  • Ten Things Lawyers Should Know About the Internet
  • Internet infrastructure economics: top ten things i have learned so far
  • If You Can’t Measure It, You Can’t Manage It
  • My other high level recommendations related to the specific wording of the CFP:

    (1) You are building a utility (water, not wine), so business models should be reconceptualized as such. Replace "networks" and "services" with "sewage system" or "federal interstate system" into each of your requested bulleted paper topics, and you'll get back on the right track.

    (2) Services most needed by everyone: moving bits from end-to-end as cheaply as possible. Do not try to become an application service provider to monetize the network. Commercial providers have this line of business ``under control''; there's a reason they have not pursued it in underserved areas. BTOP was supposed to be about empowering communities to become sustainable networks themselves. Catalog and disseminate lessons learned from previous attempts at doing so; there is already a decade of history in this space.

    (3) Don't forget about -- or postpone till the network is built -- being able to study the network itself, to learn how to optimize costs as well as deal with security problems. bring a science policy team in from the beginning to help address measurement and privacy/data-sharing issues. economic transparency is as critical as it is challenging (Internet2 admits it has failed at this part..)

    Happy to discuss further, but can't make deadlines like this..,

    k (on I2 Research Advisory Council)

    [Note submitted 14 April 2011 upon UCAN Task Force request for white papers, but not posted there because it did not match their formatting requirements. Other papers linked there worth reading; if Internet2/UCAN really follows all this advice they will maximize the positive impact of this likely once-in-a-lifetime opportunity. If they follow (3) above they will even improve their performance on their network research leadership mission in the process.]

    Unsolicited Internet Traffic from Libya

    Amidst the recent political unrest in the Middle East, researchers have observed significant changes in Internet traffic and connectivity. In this article we tap into a previously unused source of data: unsolicited Internet traffic arriving from Libya. The traffic data we captured shows distinct changes in unsolicited traffic patterns since 17 February 2011.

    Most of the information already published about Internet connectivity in the Middle East has been based on four types of data:

    1. BGP
    2. Netflow data in the core
    3. Traceroute/ping latencies
    4. Search and other queries to Google

    In this article we discuss another type of Internet measurement data that can be useful in monitoring macroscopically visible Internet events:  unsolicited packets destined to unused address space. Similar to the notion of Cosmic Microwave Background Radiation, this Internet "background noise" of unsolicited packets consists of packets sent by misconfigured hosts, hosts that are scanning the network, or victims of DoS attacks with spoofed source addresses.

    On 21 November 2008, the amount of unsolicited traffic at the UCSD network telescope (described below) grew dramatically with the advent of the Conficker worm, which widely infected Windows hosts and actively scanned for hosts to infect on TCP port 445. From that point on about 60-80% of unsolicited Internet traffic is via TCP port 445. Sufficiently pervasive worms such as Conficker allow informed estimates of aggregate infection rates -- in this case of a vulnerable (ie. unpatched) Windows population -- by monitoring traffic to unassigned IP address space.

    The Conficker worm scans whenever a host is online, although its rate of scanning is higher when it detects no user activity on a machine (see this report by Symantec). So the amount of unsolicited traffic originating from Conficker's network scanning allows us to see hosts that are online, but where the user is not actively generating Internet traffic.

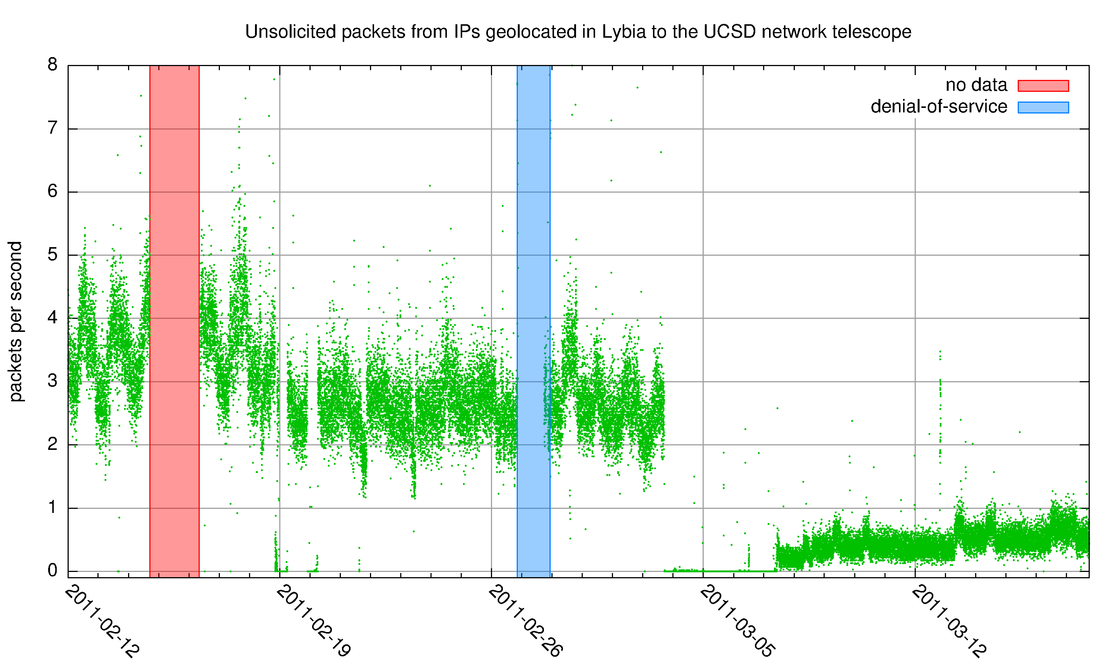
    The UCSD network telescope captures traffic destined to the unassigned address space in a /8 network, with relatively few blocks in this /8 where end hosts are active. Filtering this data for source addresses from a specific region provides an indication of host activity for that region. We used the MaxMind GeoIP Lite database, January 2011 edition, to map IP addresses to geographic regions, and recorded the per-second packet rate (averaged over 60 seconds) from address ranges that geolocated to Libya. Figure 1 shows five weeks of these packet-per-second averages, and Figures 2, 3 and 4 show the same data zoomed in to interesting 2-day, 3-day and 7-day intervals, respectively.

    Unsolicited internet traffic from Libya
    Figure 1. Five weeks of observed unsolicited Internet traffic from IP address blocks that geolocated to Libya according to MaxMind GeoIP Lite database, January 2011 edition.

    Figure 1 shows unsolicited one-way traffic for five weeks, including some "silent" gaps with absolutely no traffic, and other intervals with larger and more typical levels. During these five weeks there was an interval of about one-and-a-half days where the data collection server didn't collect data, indicated in light red with label 'no data', and for a period of about a day where traffic levels were almost always higher then 8 packets per second (pps), indicated in light blue with label 'denial-of-service'. Figure 1 also shows a number of intervals with next to no traffic, notably in the 18 - 21 February period and between 3 and 8 March. This is shown in more detail in Figure 3 and Figure 4 below. After 8 March the amount of unsolicited traffic is slowly picking up again, but not to the levels from before 3 March.

    Unsolicited internet traffic from Libya - DDoS
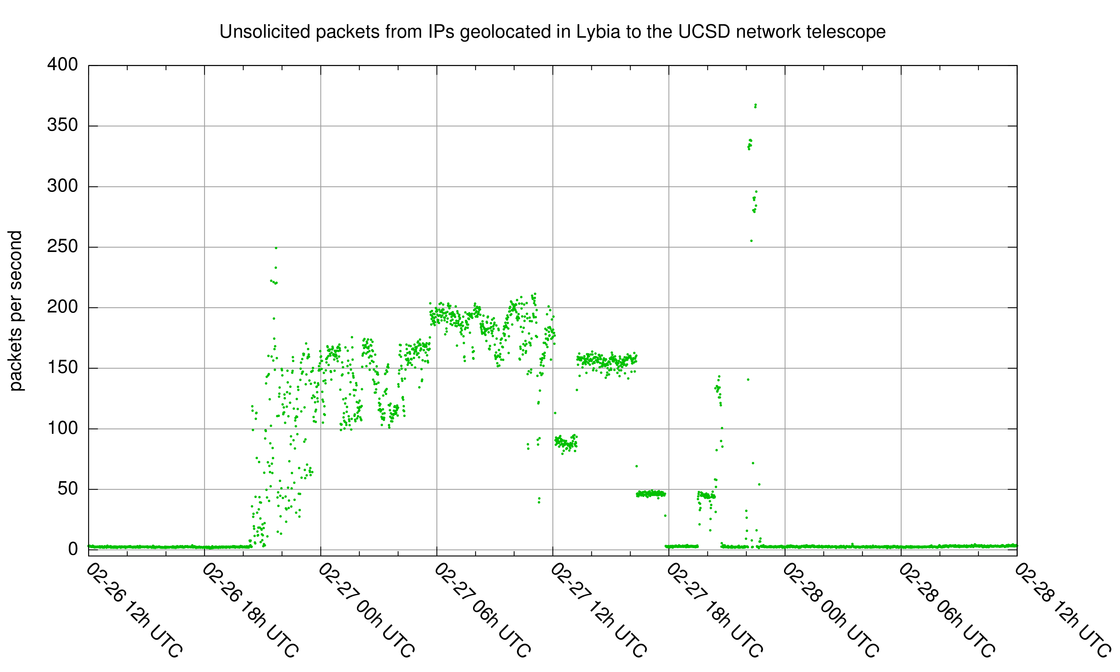
    Figure 2. Two days of observed unsolicited Internet traffic from IP address blocks that geolocated to Libya according to MaxMind GeoIP Lite database, January 2011 edition.

    Figure 2 shows a 2-day period that includes an interval of higher packet rates, labeled "denial-of-service" in Figure 1, on a different y-scale. Where outside of this period the packet rate usually is below 5 pps, during this period the packet rates received go up to 367 pps at the highest peak. While the unsolicited traffic outside this interval is dominated by traffic to TCP/445, the higher-packet rates interval is dominated by SYN/ACK packets from TCP/80 from a single source IP address to seemingly random destinations in the UCSD network telescope. This is typical "backscatter" of a denial-of-service attack, in this case of a single webserver we geolocated to Libya. There are intervals where packet rates stay around 50, 100, 150 and 200 pps, which could point at an attacker stepping their attack up and down. Note that we only saw a small fraction of the return traffic from this attack, but it looks like this attack was very modest by current standards (see for instance this news report on a tens of millons of pps attack on Wordpress).

    Unsolicited internet traffic from Libya - short outages
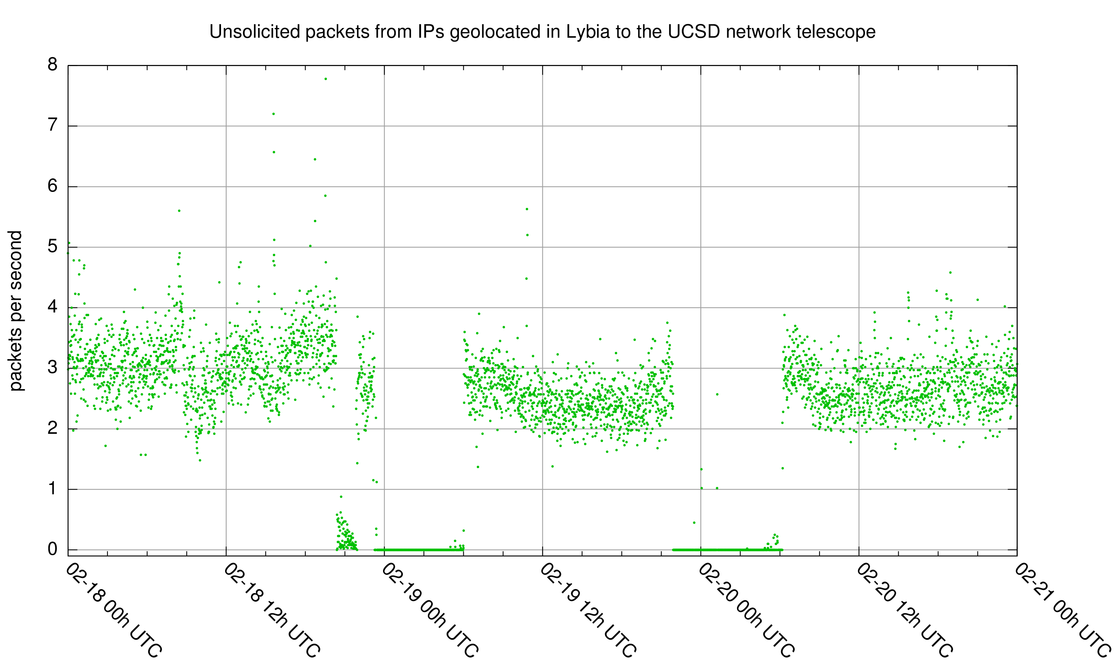
    Figure 3. Unsolicited Internet traffic during 18 - 21 February 2011 from IP address blocks that geolocated to Libya according to MaxMind GeoIP Lite database, January 2011 edition.

    Figure 3 shows two distinct overnight outages consistent with Arbor Networks's netflow measurements during the same period (18 - 21 February 2011). Interestingly in both cases, a small trickle of traffic begins right before the outage ends.  Occasional traffic is often observed during these outages, which could be an artifact of traffic with spoofed IP addresses or inaccuracy in the geolocation database we used for prefix selection.

    Unsolicited internet traffic from Libya - long outage
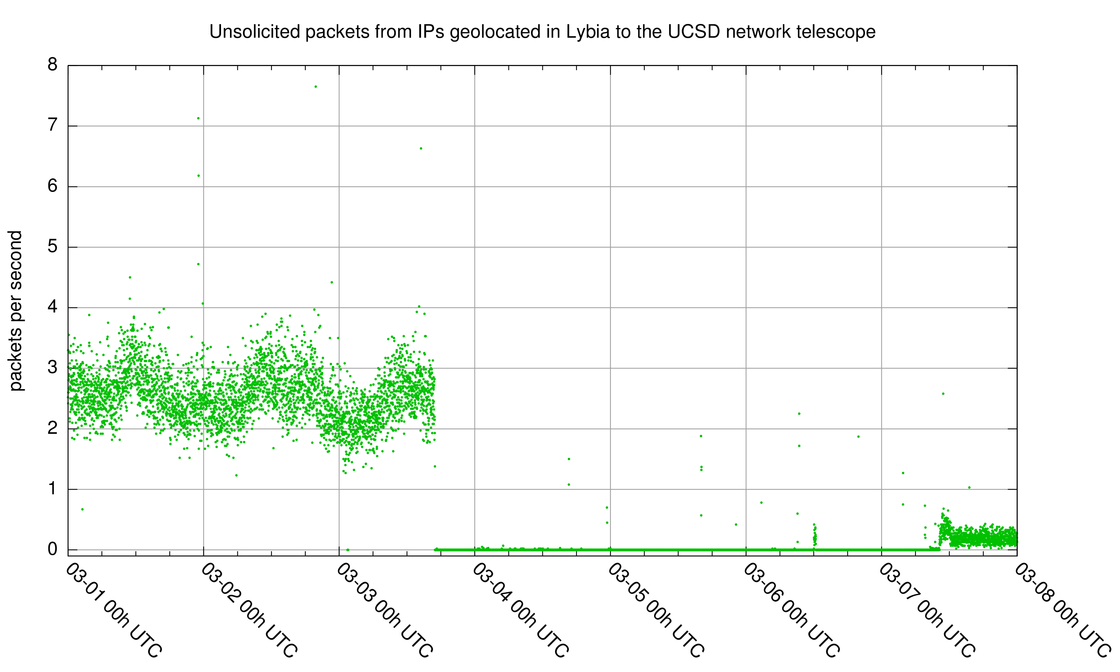
    Figure 4. Unsolicited Internet traffic during 1 - 8 March 2011 from IP address blocks that geolocated to Libya according to MaxMind GeoIP Lite database, January 2011 edition.

    Figure 4 reveals a longer outage visible from approximately 3 March 18:00 UTC to 7 March 11:00 UTC. The traffic levels after this outage were significantly lower then before. Figure 1 shows a slow subsequent increase after this outage to roughly 20% of pre-outage traffic levels. In Google's transparency index search queries are less then 5% of pre-outage levels, so it seems that the few hosts we observe sending out unsolicited traffic after this outage do significantly fewer search queries to Google than the population of hosts before the outage. It is unclear if this is due to stricter filtering of traffic to Google, and potentially other websites. A tiny spike in traffic around 12 March 19:58 UTC to pre-outage levels is visible in Figure 1, and also visible in Google's data, which could be interpreted as a temporary glitch of an Internet filter.

    Conclusion

    Ironically, the insidious pervasive reach of malware like the Conficker worm enables observation and detection of macroscopic changes in Internet behaviour.

    In this case we saw several anomalies in the amount of unsolicited traffic out of networks we geolocated to Libya over the last couple of weeks.

    CAIDA is coordinating further analysis of this data by a team of vetted researchers. Please comment below if you have any questions.

    Caidagram: visualizing geographically annotated Internet measurements

    I post this article to describe the results of my five month visit to CAIDA and UC San Diego, and to thank the organizations that collaborated to make this work possible.

    We wanted to develop a tool to visualize different classes of geographically annotated Internet data, e.g., topology, address allocation, DNS, economic. The results of my visit here include a new interactive tool -- Caidagram -- derived from a decades-old visualization technique called a cartogram, a map whose geometry is distorted to convey information. This classic example depicts the United States with geographic distance distorted as a function of population per county, colored by the results of the 2004 presidential election popular vote.

    Try Caidagram now!

    Each caidagram extends the geographic mapping metaphor to other variables, while attempting to maximize intuitiveness and readability. With time-series data we used Caidagram to create interactive animations illustrating data trends over time. We show two examples of how the Caidagram can yield insight into real Internet data.

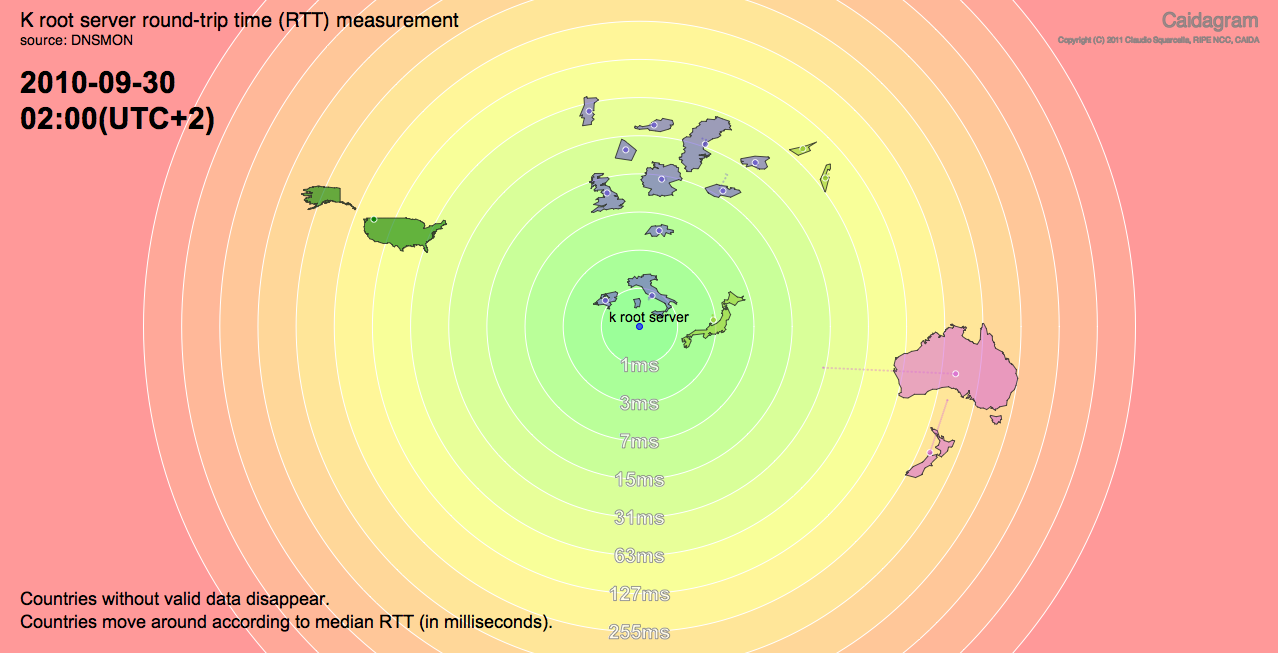
    In the first example, we consider round trip times (RTT) between different end points, including one-to-many scenarios where we want to depict RTTs from different locations to a single endpoint. We place the common endpoint in the center of concentric circles representing increasing distances. We display countries (depicted by their geographic shapes) within the concentric circle that corresponds to their aggregated RTT values, facilitating comparison of macroscopic latency statistics on a per-country level. The screenshot below is a frame of an animation of RTT values from RIPE DNSMON monitors to the root server K. The center of the circle represents K-root (all distributed anycast instances), while the countries shown are some of those hosting at least one RIPE TTM monitor: USA, Netherlands, Italy, Japan, Australia, New Zealand, Switzerland, UK, Germany, Luxembourg, Estonia, Portugal, Austria, Sweden, Czech Republic, Israel, Cyprus.

    Caidagram, DNSMON example

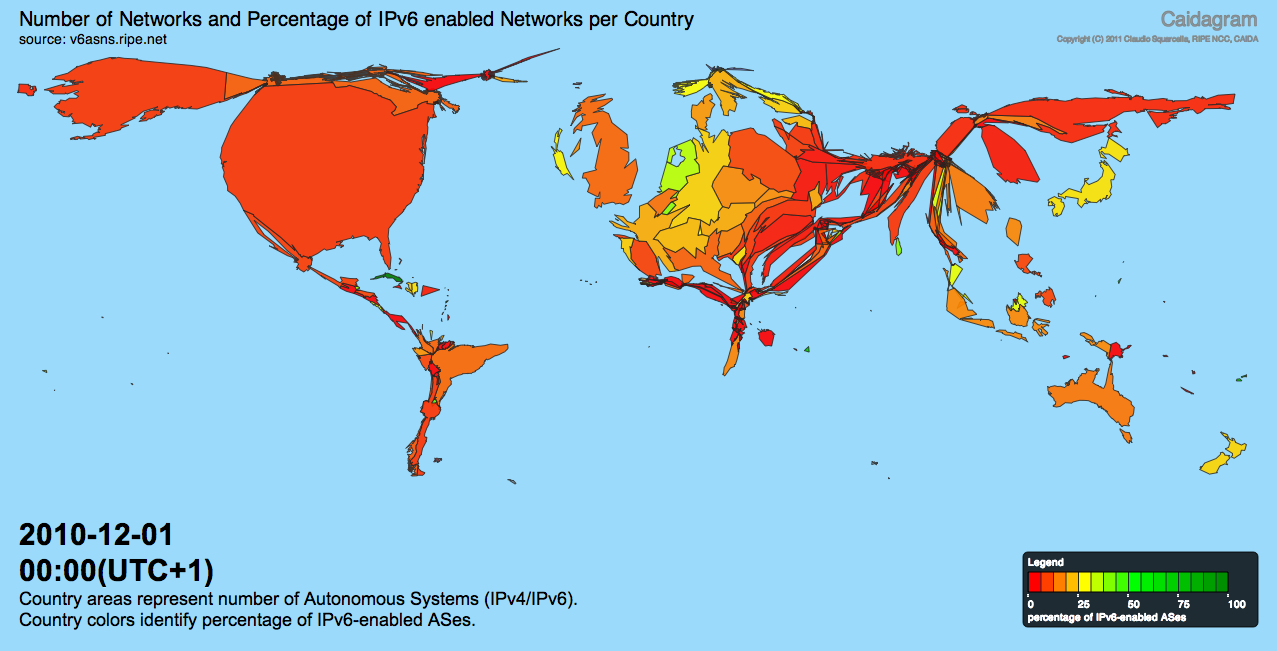
    The second example uses a more traditional cartogram technique to compare quantitative per-country Internet statistics, such as quantity of Internet addressing resources in use. The screenshot below distorts the shape of each country, either inflating or deflating its boundaries to correlate with the number of Autonomous Systems (ASes) associated with the country. At the same time, colors depend on how many ASes are IPv6 enabled in each country. The US is visibly dominant, despite its relatively small geographic area, while some European countries are more IPv6 enabled; continents like South America and Africa are virtually invisible.

    Caidagram, IPv6 enabled Networks

    I introduced Caidagram at RIPE61 in Rome. The tool is implemented with AJAX for compatibility with most modern web browsers, and uses the Google Web Toolkit and Raphaël, a Javascript library for vector graphics. The source code is available here. For a live demo visit this link.

    thoughts on ICANN's plans to expand the DNS root zone by orders of magnitude

    My recently submitted public comments on the increasingly controversial issue of ICANN's plans to expand the generic Top Level Domain namespace indefinitely:

    1. a repeat of my still unaddressed comments from the last (June 2010) economic report,
    2. an attempt to summarize some public comments to that June 2010 report,
    3. end an abbreviated historical timeline of ICANN's economic research commitment to launching new gTLDs.

    Also worth reading are Paul Tattersfield's comments (gpmgroup.com) and some of George Kirikos comments. But all the comments are worth scanning, to gain an appreciation of the unanimous public dissent to ICANN's plans to move forward with a policy that will enrich them and the industry that has captured them, at the (multi-billion-dollar) expense of the rest of Internet users.

    [ Disclosure: I serve on ICANN's Security and Stability Advisory Committee, and contributed to their Advisory Report on Root Scaling, but also had some related objections to their conclusions:

    While we agree with what the SSAC report says, we also think it doesn't go far enough. Our view, which did not achieve consensus, is that the lack of satisfying research has a simple explanation: The current models of data collection and sharing among stakeholders failed to yield enough information to allow useful realistic modeling of root zone dynamics or evolution. As such, we have no way to show that adding many thousands of TLDs would have positive rather than negative effects on the security, stability, or economics of the domain name (now critical) infrastructure and related industries. Nonetheless, ICANN is asking for a go-ahead to move forward because there is no data to show that a few thousand TLDs will seriously break anything, there are (for some, definitely for ICANN) strong political and economic incentives to move forward, and it will yield some data and some capital from which to develop better policy. Yet, both the public and private sectors should be aware of the risks of moving forward in light of all the unanswered questions: the lack of data on expected demand; the lack of metrics or models or visibility to determine whether something has gone wrong; the lack of any transparent process to back out changes if something does go wrong; and the political difficulty in denying future TLDs when some observable limit has been reached, since there will be tremendous pressure to invest our way out of any limiting factors. In this risk-seeking posture, ICANN should take seriously its responsibility to present a deep understanding of the ramifications of possibly disruptive policies in advance of launching them.

    my first "Future Internet Architecture" PI meeting

    Among the interesting meetings I attended in 2010 was the principal investigators (PI) meeting for NSF's new "Future Internet Architecture" (FIA) program. The FIA program builds on the successes of NSF's previous Future Internet Design (FIND) program, the recommendations of a review panel, and a community summit in October 2009. (The FIND program itself has been integrated into NSF's new Network Science and Engineering research program, while the four FIA teams are attempting to implement some of the ideas developed thus far.) CAIDA is participating in one of these projects -- Named Data Networking (NDN), led by Van Jacobson at Xerox Parc and Lixia Zhang at UCLA. (Background links to 2010 technical report describing the proposed architecture, Van's August 2006 video lecture and 2009 ACM Queue Q&A on NDN ideas.)

    The conversation about Future Internet research has matured over the last three years. In particular, NSF's activities have inspired cooperative international dialogue about the global Internet's problems, confronting their interdisciplinary nature while recognizing the practical problems in pursuing scientific knowledge about the Internet. Accordingly, all four projects (NDN, Mobility First, NEBULA, and eXpressive Internet Architecture (XIA)) have common themes, reflecting rough consensus on the goals of a scalable future Internet architecture, though not necessarily how to implement them: mobility, security, reliability, efficiency, sustainability. Social scientists and economists are now formally engaged in the conversation with computer and network scientists and engineers, all actively trying to learn each other's language as we evaluate the strengths and weaknesses of proposed network architectures.

    Lending further gravity and unsettling motivation to the conversation is the continued failure of (or at least grim outlook for) a relatively minor architectural innovation. Admittedly the failure of IPv6 deployment (indeed, thus far, the failure to even measure it) begs the question of how anything more radical could pass the (too often) blindingly obvious technology transition barrier. It also constitutes additional evidence that the current Internet is subject to some persistently insurmountable constraints regarding deployment of architectural innovation.

    But the plot thickens. The IETF also has no solution to the scalability problems they admit have always existed in the Internet's routing system. Their Internet routing research working group, assigned the task of developing a recommendation for future routing architecture to be pursued by the IETF, has recently closed four years of debate with a set of recommendations from the chairs (hint: ILNP) in lieu of the traditional rough consensus of the working group. If a relatively small ostensibly cooperative subset of the technical standards community cannot reach consensus on how to move forward, it is a sign further research is needed.

    Most importantly, I find the ten-site (and growing) NDN project intellectually invigorating and epistemologically gratifying. Intellectually invigorating, because it does allow us to indulge in ``clean slate'' architectural thinking, but also offers a conceivable deployment path as an overlay to the current Internet. Epistemologically gratifying, because the fundamental tenets of the architecture are based on our best empirical understanding of Internet evolution, dynamics, and usage, as well as the proven strengths and weaknesses of the current architecture. Even better, there is some running code and growing community through which some rough consensus seems likely to develop this decade.

    NSF deserves much credit for funding this initiative as the Internet infrastructure continues to embed itself in all other critical infrastructures world-wide. [Disclosure: As part of this program, CAIDA receives a modicum of support from NSF grant CNS-1039646.]