

Why should my network host an Ark Node?
This page is the text of CAIDA’s one-page flyer for networks considering hosting an Ark node. The flyer is also available as a PDF: Why should my network host an Ark Node? (PDF).
When your network hosts a measurement node that participates in CAIDA’s Archipelago (Ark) infrastructure, it broadens the view of the global Internet for the network research community. Network researchers use CAIDA topology data to conceive, develop, and test their models and methods. Participating networks agree to our Memorandum of Cooperation (MoC) [1] and install a Raspberry Pi, 1-U server, virtual server, or software container dedicated to Ark measurement.
Once deployed, the Ark node conducts continuous measurements of the routed IPv4 (and IPv6 when the hosting network supports it) address space. Ark aggregates the resulting data on a server at UC San Diego’s Supercomputer Center. Each additional node contributes to – and increases the completeness and accuracy of – data representing the topological structure of the Internet core.
CAIDA uses these continuous measurements, as well as sophisticated Internet-scale alias resolution methods developed in-house, to build the Internet Topology Data Kit (ITDK) – a heavily annotated router-level graph of the Internet to support data science on Internet topology. CAIDA further annotates each router with its inferred geolocation, and inferred operator, to support sophisticated analyses of the router-level Internet topology by the Internet research community.
As of 2024, the Ark measurement platform has supported the Internet research community for more than 15 years. Recent work has investigated the unintended consequences of submarine cable deployment on Internet routing (PAM'18), persistent interdomain congestion (SIGCOMM'18), the impact on performance and resilience of regional access network topology structure (IMC'21), and methods to automatically extract meaning from Internet router hostnames (CoNEXT'21, IMC'20, IMC'19). As of 2024, CAIDA is enhancing the infrastructure with a domain-specific language to allow researchers to quickly and correctly build and execute experiments.
This range of scientific experiments has successfully demonstrated our vision of a metaphorical distributed measurement “operating system” to support empirical Internet science.
[1] https://www.caida.org/projects/ark/moc/
If interested, please contact ark-info@caida.org
Figure 1: North America Paths routed through Africa to Brazil
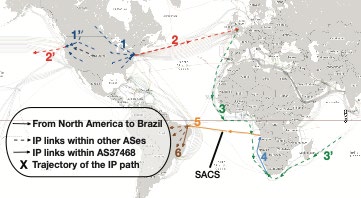
Figure 1 description: World map with numbered arrows tracing paths from North America to Brazil. Blue dashed arrows labeled 1 and 1’ run from points across the United States to its east and west coasts. A red dashed arrow labeled 2 crosses the North Atlantic from the U.S. east coast to Europe, and a red dashed arrow labeled 2’ points west from the U.S. west coast. Green dashed arrows run from Europe south along the west coast of Africa (3) and along the east coast of Africa around its southern tip (3’). A blue solid line labeled 4 runs along the southwest coast of Africa. An orange solid line labeled 5, marked SACS, crosses the South Atlantic from Angola to Brazil, and brown dashed arrows labeled 6 spread out within Brazil. Legend: solid arrow, From North America to Brazil; dashed arrow, IP links within other ASes; solid arrow, IP links within AS37468; X, Trajectory of the IP path.
Figure 2: Internet interdomain congestion
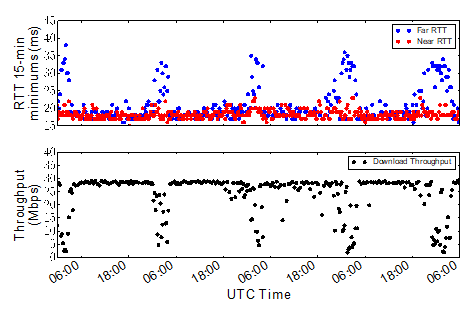
Figure 2 description: Two stacked time-series charts over about four days, with a shared horizontal axis labeled UTC Time and ticks alternating 06:00 and 18:00. Top panel: RTT 15-min minimums (ms), scale 15 to 40, with two series, Far RTT (blue dots) and Near RTT (red dots). Near RTT stays flat at about 17 to 20 ms. Far RTT matches it most of the time but rises once a day to peaks of about 30 to 38 ms. Bottom panel: Throughput (Mbps), scale 0 to 40, series Download Throughput (black dots), mostly near 28 Mbps but dropping toward 0 to 15 Mbps at the same times as the Far RTT peaks.
Figure 3: Internet router geolocation
The flyer shows twelve router hostnames in four groups (dashed boxes). Parts of some hostnames appear in green, and the string “ash” appears in red. On this page those parts are in bold, and the list after each hostname says which parts were green and which were red.
- Group 1
- xo.iad02.atlas.cogentco.com (green: iad)
- as2828.was14.ip4.gtt.net (green: was)
- te9-2-0d0.cir1.ashburn-va.us.xo.net (green: ashburn-va, us)
- Group 2
- vodafone.iad02.atlas.cogentco.com (green: iad)
- ae-0.vodafone.asbnva02.us.bb.gin.ntt.net (green: asbnva, us)
- zayo.vodafone.er2.iad10.us.zip.zayo.com (green: iad, us)
- Group 3
- usqas1-rt002i.i3d.net (green: usqas)
- interactive.edge1.washington111.level3.net (green: washington)
- ce-0-4-0-2.r05.asbnva02.us.ce.gin.ntt.net (green: asbnva, us)
- Group 4
- level3-as3356.e0-51.switch2.ash1.he.net (red: ash)
- ae-1-3510.edge1.washington111.level3.net (green: washington)
- level3.ashburn2.ash.seabone.net (green: ashburn; red: ash)
Hostnames of 4 routers located in/near Washington D.C., with router interface names assigned by nine operators. Ark enabled development of a technique to automatically learn the naming convention of each operator using the ITDK as a primary input. CAIDA provides the inferred rules, and a public API, as a service to the research community. Note that ash, in red, is an airport in Nashua, NH; the technique learns that the operators used ‘ash’ to mean Ashburn, VA.
The flyer’s header reads “ARCHIPELAGO Internet Measurement Infrastructure” above the address http://www.caida.org/projects/ark/, beside the CAIDA logo. Its footer shows the logos of the U.S. Department of Homeland Security, the National Science Foundation (NSF), UC San Diego, and SDSC, above this address: San Diego Supercomputer Center, University of California San Diego, 9500 Gilman Drive, mc0505, La Jolla, CA 92093-0505 | 858-534-5000 | www.caida.org