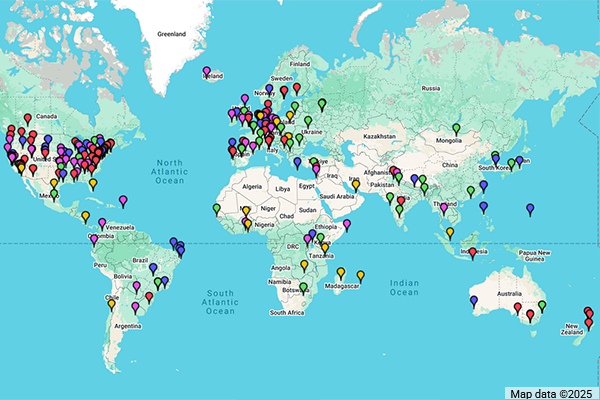
Archipelago Monitor Locations
 Archipelago (Ark): CAIDA's active measurement infrastructure serving the network research community since 2007.
This page provides an interactive map of Ark monitor locations and individual monitor attributes. For a listing of other CAIDA active and passive data monitors, see the CAIDA Data Monitors page.
Legend
This map shows current Archipelago (Ark) monitors at their approximate geographical location. The checkbox menu allows the selection of monitors shown based on several characteristics. Note that the locations are displayed at city granularity.
The "Status" menu item divides all monitors into "active" monitors, defined as a monitor that has produced data in the last recent 30 days, and "inactive" monitors that have been inactive for more than 30 days.
The "Hardware" menu item selects monitors running FreeBSD (used for the first Ark monitors), and Linux on Raspberry Pi (the current default for new monitors).
The "Activity" menu item select monitors based on the research projects that they currently support. Access to the data from IPv4 team-probing, IPv4 prefix-probing", IPv6 probing, and is provided by CAIDA to researchers on request. Spoofer investigates the Internet's susceptibility to spoofed DDoS attacks. Fireball activity refers to Ark nodes programmable via fireball portal.
The "Class" menu item selects monitors based on a classification of the hosting location. We currently differentiate between infrastructure network, educational network, research network, commercial network, business and residential deployments.
Locations
Could not load the interactive version of this Google map,
possibly due to browser settings (no javascript) or unsupported browser

The table list all monitors that match the selected criteria in the menu. The monitor attributes listed are: monitor name (the red star (★) indicates that the hardware was provided by the host), the activation date, city and country where the monitor is located, AS number (derived from the IP address), the organization of the AS (determined from AS rank), and a summary of activities on each monitor. A black star (★) in the table header indicates that the color icon links to a URL with statistics for the activity. The table can be sorted on each column by clicking a header field.


