
According to the Best Available Data

The CAIDA blog — commentary and analysis of Internet measurement, infrastructure, policy, and economics, published since 2006. Formerly hosted at blog.caida.org. See About the CAIDA Blog · Categories · All entries by month · RSS feed.

Effects of submarine cables deployment on Internet routing: CAIDA wins Best Paper at PAM 2020!

Congratulations to Roderick Fanou, Bradley Huffaker, Ricky Mok, and kc claffy, for being awarded Best Paper at the Passive and Active Network Measurement Conference PAM 2020!

The abstract from the paper, "Unintended Consequences: Effects of submarine cables deployment on Internet routing":

We use traceroute and BGP data from globally distributed Internet measurement infrastructures to study the impact of a noteworthy submarine cable launch connecting Africa to South America. We leverage archived data from RIPE Atlas and CAIDA Ark platforms, as well as custom measurements from strategic vantage points, to quantify the differences in end-to-end latency and path lengths before and after deployment of this new South-Atlantic cable. We find that ASes operating in South America significantly benefit from this new cable, with reduced latency to all measured African countries. More surprising is that end-to-end latency to/from some regions of the world, including intra-African paths towards Angola, increased after switching to the cable. We track these unintended consequences to suboptimally circuitous IP paths that traveled from Africa to Europe, possibly North America, and South America before traveling back to Africa over the cable. Although some suboptimalities are expected given the lack of peering among neighboring ASes in the developing world, we found two other causes: (i) problematic intra-domain routing within a single Angolese network, and (ii) suboptimal routing/traffic engineering by its BGP neighbors. After notifying the operating AS of our results, we found that most of these suboptimalities were subsequently resolved. We designed our method to generalize to the study of other cable deployments or outages and share our code to promote reproducibility and extension of our work

The study presents a reproducible method to investigate the impact of a cable deployment on the macroscopic Internet topology and end-to-end performance. We then applied our methodology to the case of SACS (South-Atlantic Cable System), the first South-Atlantic cable from South America to Africa, using historical traceroutes from both Archipelago (Ark) and RIPE Atlas measurement platforms, BGP data, etc.
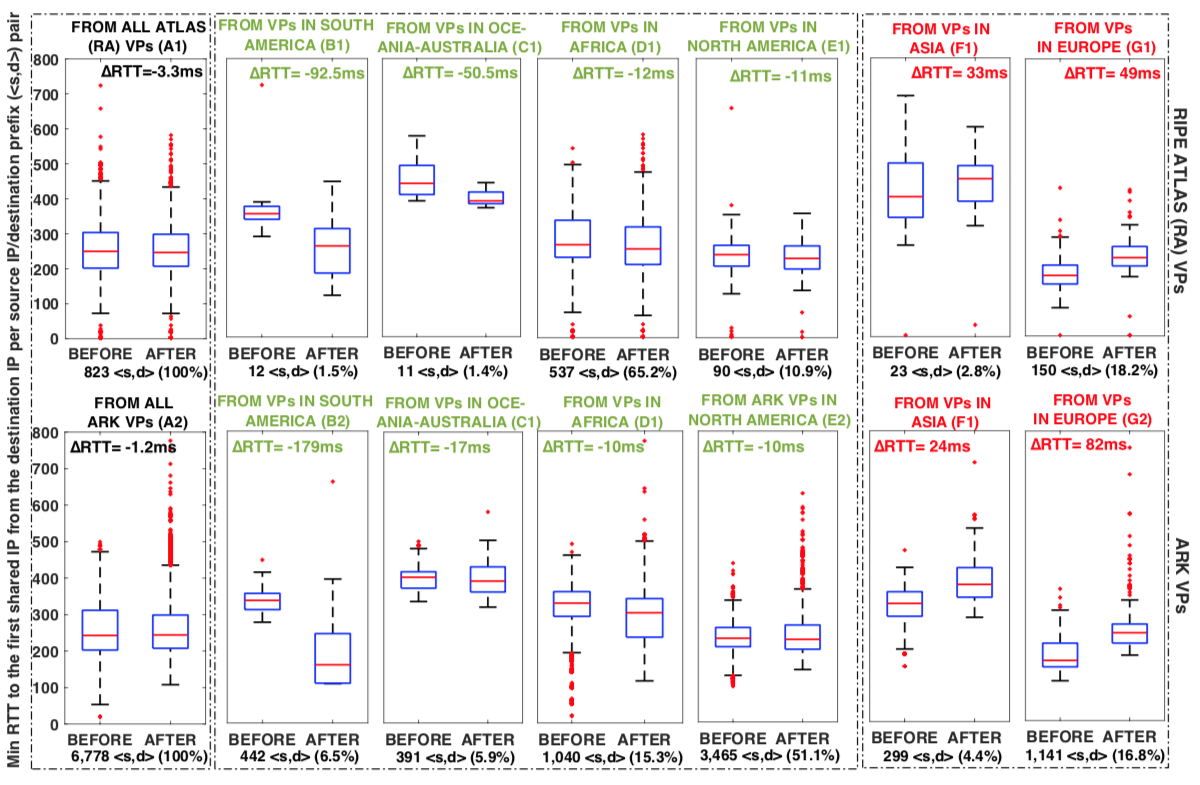
Boxplots of minimum RTTs from Ark and Atlas Vantage Points to the common IP hops closest to the destination IPs. Sets BEFORE and AFTER correspond to periods pre and post-SACS deployment. We present ∆RTT (AFTER minus BEFORE) per sub-figure. RTT changes are similar across measurement platforms. Paths from South America experienced a median RTT decrease of 38%, those from Oceania-Australia a smaller decrease of 8%, while those from Africa and North America, roughly 3%. Conversely, paths from Europe and Asia that crossed SACS after its deployment experienced an average RTT increase of 40% and 9%, respectively.

As shown in the above figure, our findings included:

  • the median RTT decrease from Africa to Brazil was roughly a third of that from South America to Angola
  • surprising performance degradations to/from some regions worldwide, e.g., Asia and Europe.

We also offered suggestions for how to avoid suboptimal routing that gives rise to such performance degradations post-activation of cables in the future. They could:

  • Inform their BGP neighbours to allow time for changes
  • Ensure optimal iBGP configs post-activation
  • Use measurements platforms to verify path optimality

To enable reproducibility of this work, we made our tools and publicly accessible on GitHub.

Read the full paper on the CAIDA website or watch the PAM presentation video on YouTube.

AS Rank v2 (GraphQL)

ASRankv2(GraphQL)

The new AS Rank APIv2 is ready for use. This new version reflects a move from a RESTful (v1) API to a GraphQL (v2) API. This will allow clients to create queries that specify which values they require and contain multiple resources. GraphQL, as a strongly-typed language, allows clients to know what data is available, in what format, and verify responses.

The User Interface (UI) can be found at http://asrank.caida.org. The Application Programming Interface (APIv2) serves at https://api.asrank.caida.org/v2/graphql and GraphiQL interface can be found at https://api.asrank.caida.org/docs.

We will be operating AS Rank APIv1 (http://as-rank.caida.org/api/v1) until March 1st, 2020, but it will no longer be updated. Current users should migrate to the v2 API before this date. Contact asrank-info@caida.org for migration assistance.

For those unfamiliar with GraphQL, it is a bit of a paradigm shift from the use of a RESTful API, in that GraphQL requires the client to specify precisely which values it needs. In the following example, the client wants to know an ASN's transit degree. With a normal RESTful API, the client must retrieve the full record and extract the information it wants. A GraphQL API client must specify that it wants the ASN's transit degree.

GraphQLRESTFUL
# request ASN 3356's degree
query={
   asn(asn:"3356") {
      asnDegree {
         transit
      }
   }
}
        
data={
   "asn": {
      "asnDegree": {
         "transit": 5255
    }
}
# request ASN 3356's record
/asns/3356?populate=1
                
data={ "clique": "true", "source": "ARIN", "org": { "name": "Level 3 Parent, LLC", "id": "LPL-141-ARIN" }, "cone": { "prefixes": 516117, "addresses": 1293145968, "asns": 36019 }, "latitude": "36.0978209554736", "rank": "1", "country": "US", "name": "LEVEL3", "country_name": "United States", "degree": { "peers": 95, "globals": 5178, "siblings": 9, "customers": 5083, "transits": 5177 }, "longitude": "-91.335620170744", "id": "3356" }

GraphQL supports mixed record queries. The same query can include different record types, and can specify bindings ("joins") between those resources. This approach reduces the number of API queries needed to retrieve related resources.

GraphQL
mixed types mixed and joined types
# request ASN 3356's asnName and 
# organization LPL-141-ARIN's rank.

query={
   asn(asn:"3356") {
      asnName
      organization {
        orgId
      }
   }
   organization(orgId:"LPL-141-ARIN") {
      rank
   }
}
        
# request ASN 3356's asnName and 
# it's organization's rank.

query={
   asn(asn:"3356") {
      asnName
      organization {
         rank
      }
   }
}
        
data={
    "asn": {
      "asnName": "LEVEL3"
      "organization": {
         "orgId": "LPL-141-ARIN" 
      }
    },
    "organization": {
      "rank": 1,
    }
}
        
data={
    "asn": {
      "asnName": "LEVEL3",
      "organization": {
        "rank": 1
      }
    }
  }
}
        
RESTFUL
two separate queries
# request ASN 3356's record
/asns/3356?populate=1
                 
data={
  "name": "LEVEL3",
  "org": {
    "id": "LPL-141-ARIN",
    "name": "Level 3 Parent, LLC"
  },
  "clique": "true",
  "source": "ARIN",
  "cone": {
     ...                
# request Org LPL-141-ARIN's record /orgs/LPL-141-ARIN?populate=1
data={
    "name": "Level 3 Parent, LLC",
    "rank": "1",
    "degree": {
      "asn": {
        "transit": 6999,
        "global": 7024
      },
      "org": {
        ....
                    

CAIDA PhD student receives Microsoft Dissertation Grant for "Inferring Country-Level Transit Influence of Autonomous Systems"

CAIDA intern Alex Gamero-Garrido, a PhD student in Computer Science and Engineering at UC San Diego, was selected as one of eleven recipients of the 2019 Microsoft Research Dissertation Grants. Each dissertation grant provides funding to doctoral students at North American universities who are underrepresented in the field of computing. This is the third year Microsoft Research has offered these research grants. Microsoft Research scientists with expertise in the students’ topic areas reviewed the more than 200 proposals submitted and identified students pursuing technically excellent and societally impactful research.

Alex Gamero-Garrido’s dissertation, "Inferring Country-Level Transit Influence of Autonomous Systems" may be of interest to networking and cybersecurity researchers, policy makers and operators:

Our work explores the country-level influence exerted by transit providers, a set of networking organizations that often have less direct contact with users, but who are nonetheless responsible for delivering an important fraction of transnational traffic into and out of many countries, and who may have the capability to observe, manipulate, or disrupt some of that traffic. For instance, an accidental misconfiguration or a state-ordered disconnection implemented by one of these operators may render popular services delivered on the Internet (such as email or social media) unreachable in entire regions. These concerns are not abstract, as previous instances of state-ordered disconnections have propagated to other countries and temporarily disabled some of the world’s most popular services there. By studying the ways in which these operators (Autonomous Systems) connect to one another and to the rest of the Internet, we aim to highlight each country’s relative risk exposure.

Congratulations, Alex G!

Originally announced on the Microsoft Research Blog.

Benin: Social media blocking and Internet blackout amid 2019 elections

In late April 2019, social media was reportedly blocked and access to the Internet was shutdown in Benin during its 2019 parliamentary elections.

In this report, the Open Observatory of Network Interference (OONI) and the Center for Applied Internet Data Analysis (CAIDA) teams share OONI, IODA, and RIPE Atlas network measurement data that corroborate and provide insight into these recent censorship events in Benin.

Background

On 28th April 2019, the West African country Republic of Benin, although known as one of Africa’s most stable democracies since 1990, had parliamentary elections with no opposition candidates.

Last month, the electoral authorities, namely the Autonomous National Electoral Commission (CENA), ruled that only two parties out of seven (Le Bloc Republicain - BR - and Union Progressiste - UP) were eligible - both loyal to President Talon. Despite several attempts for dialogue, a crackdown on protests (followed by a wave of arrests) and calls to stop the electoral process, electoral authorities moved forward (with the support of the government and that of the presidents of local institutions) and Benin voters went to the polls in an election with only one choice.

In the early hours of the election day, on 28th April 2019, access to social media was reportedly blocked in the country. A few hours later, there was reportedly a complete Internet blackout. Benin thus joined the group of African countries in which the Internet was reportedly shutdown on an election day (such as Uganda and The Gambia).

In the following sections of this report, we share OONI and IODA network measurement data on the blocking of social media in Benin and the subsequent Internet outage. We augment these timely results with those of publicly available RIPE Atlas measurements launched during the first hours of the election day and continuously conducted by RIPE Atlas probes previously hosted in local networks.

Social media blocking

OONI measurements

OONI measurements, testing the accessibility of websites and apps, have been collected from multiple networks in Benin since 2017. OONI’s Web Connectivity test is designed to measure the TCP/IP, HTTP, and DNS blocking of websites, while OONI’s WhatsApp, Facebook Messenger, and Telegram tests are designed to measure the reachability of those apps from local vantage points.

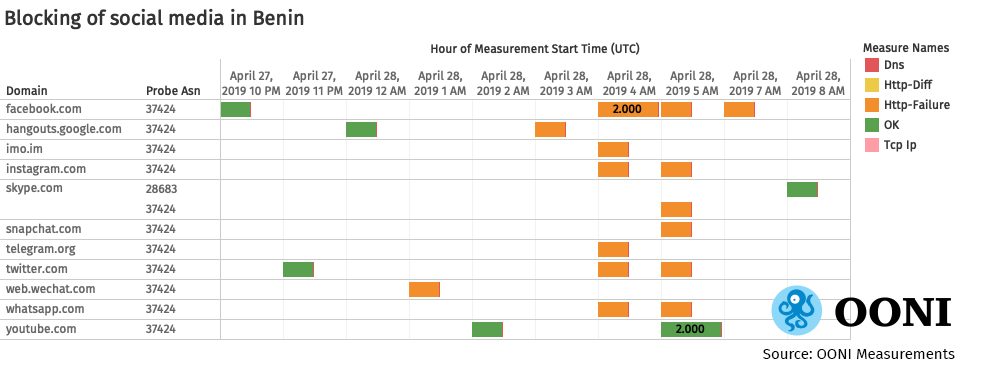
The following chart, based on OONI data collected from Benin, illustrates the blocking of social media sites on 28th April 2019, amid Benin’s 2019 parliamentary elections.

Figure 1:Blocking of social media in Benin, Open Observatory of Network Interference (OONI) measurements, Benin

Figure 1: Blocking of social media in Benin, Open Observatory of Network Interference (OONI) measurements, Benin: https://explorer.ooni.io/country/BJ

Most measurements were collected from the mobile operator Spacetel (AS37424), locally known as MTN Benin, and consistently showed that the testing of the following social media sites presented HTTP failures: facebook.com, whatsapp.com, telegram.org, twitter.com, instagram.com, skype.com, snapchat.com, imo.im, hangouts.google.com, web.wechat.com. Youtube though remained accessible throughout the elections.

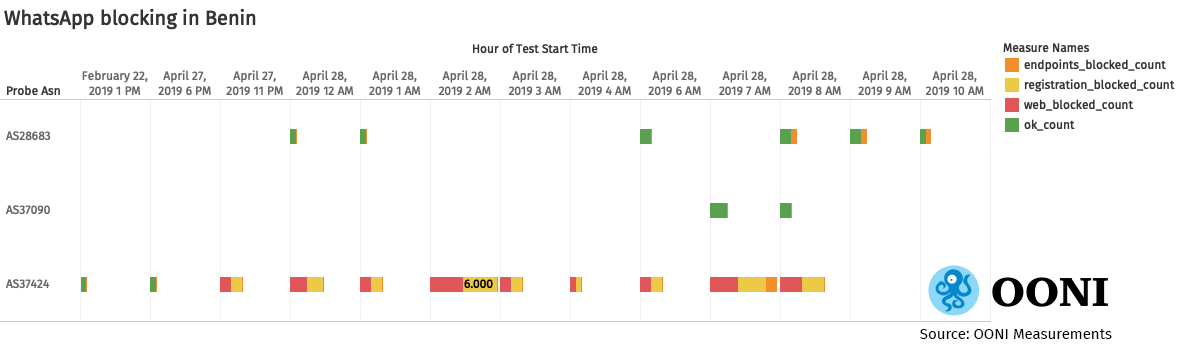
The blocking of WhatsApp was also detected through OONI’s WhatsApp test, which attempts to perform an HTTP GET request, TCP connection, and DNS lookup to WhatsApp’s endpoints, registration service, and web version over the vantage point of the user.

The following chart illustrates the blocking of WhatsApp on MTN (AS37424) in Benin.

 Figure 2:WhatsApp blocking in Benin, Open Observatory of Network Interference (OONI) measurements, BeninFigure 2: WhatsApp blocking in Benin, Open Observatory of Network Interference (OONI) measurements, Benin: https://explorer.ooni.io/country/BJ

Both WhatsApp’s web version (web.whatsapp.com) and the registration server used by WhatsApp’s mobile app appear to have been blocked on MTN Benin by midnight, 28th April 2019 (local time). Throughout the day, all measurements collected from this network consistently showed that attempts to establish TCP connections to WhatsApp’s registration service failed, while HTTP requests to web.whatsapp.com rendered HTTP failures, with connections being reset. MTN Benin though did not block access to the addresses used by the WhatsApp application, but limited the block to merely the registration service.

It’s worth noting though that WhatsApp was accessible on two other networks: ISOCEL (AS37090) and OPT Benin (AS28683), known as Benin Telecom. Some measurements collected from Benin Telecom (AS28683) suggest “endpoint blocking”, but those are false positives due to DNS based load balancing (for example, 169.54.55.206 belongs to WhatsApp Inc.).

Unlike WhatsApp, Facebook Messenger appears to have been accessible on MTN Benin (AS37424) on 28th April 2019, even though access to facebook.com was blocked.

The following chart shows that Facebook Messenger was accessible in Benin on three different networks during the elections.

Figure 3:Facebook Messenger testing in Benin, Open Observatory of Network Interference (OONI) measurements, BeninFigure 3: Facebook Messenger testing in Benin, Open Observatory of Network Interference (OONI) measurements, Benin: https://explorer.ooni.io/country/BJ

All measurements show that TCP connections to Facebook’s endpoints succeeded (the few DNS anomalies were false positives), suggesting that Facebook Messenger worked while facebook.com was blocked.

Quite similarly, measurements collected through OONI’s Telegram test show that MTN Benin blocked telegram.org, but they did not block access to the Telegram mobile app. This is illustrated through the following chart, which also shows that Telegram’s web version seemed mostly accessible on other networks.

Figure 4:Telegram blocking in Benin, Open Observatory of Network Interference (OONI) measurements, BeninFigure 4: Telegram blocking in Benin, Open Observatory of Network Interference (OONI) measurements, Benin: https://explorer.ooni.io/country/BJ

Several circumvention tool sites, such as purevpn.fr, betternet.co, and tigervpn.com, presented HTTP failures. However, these failures are likely false positives, particularly given the fact that more popular circumvention tool sites, such as psiphon.ca, were accessible. The testing of openvpn.com presented an anomaly, but this was triggered by a cloudflare captcha page (i.e., the site was accessible in Benin during the elections).

RIPE Atlas measurements

As of 29th April 2019, the RIPE Atlas measurements platform contains 10,458 probes deployed worldwide for the purpose of measuring the Internet. The RIPE Atlas probes can run pings, traceroutes, DNS, HTTP, SSL measurements, etc. Five of them were previously deployed within local networks in Benin. Among them, two were online on 28th April 2019, hosted in JENY-SAS-AS (AS328098)(whose provider is Spacetel, AS37424) and ISOCEL Telecom (AS37090).

Since HTTP queries are only enabled on RIPE Atlas anchors (none of which are hosted in Benin), we launched traceroutes from all online RIPE Atlas probes in the country towards the landing webpages of social media, such as whatsapp.com, instagram.com, wechat.com, messenger.com, facebook.com. The measurements cover the period April 28, 2019 at 07:04 UTC to April 30, 2019 at 05:19 UTC. The results of these measurements reflect the connectivity on the IP/network layer (and not on the application layer) from the host Autonomous System (AS).

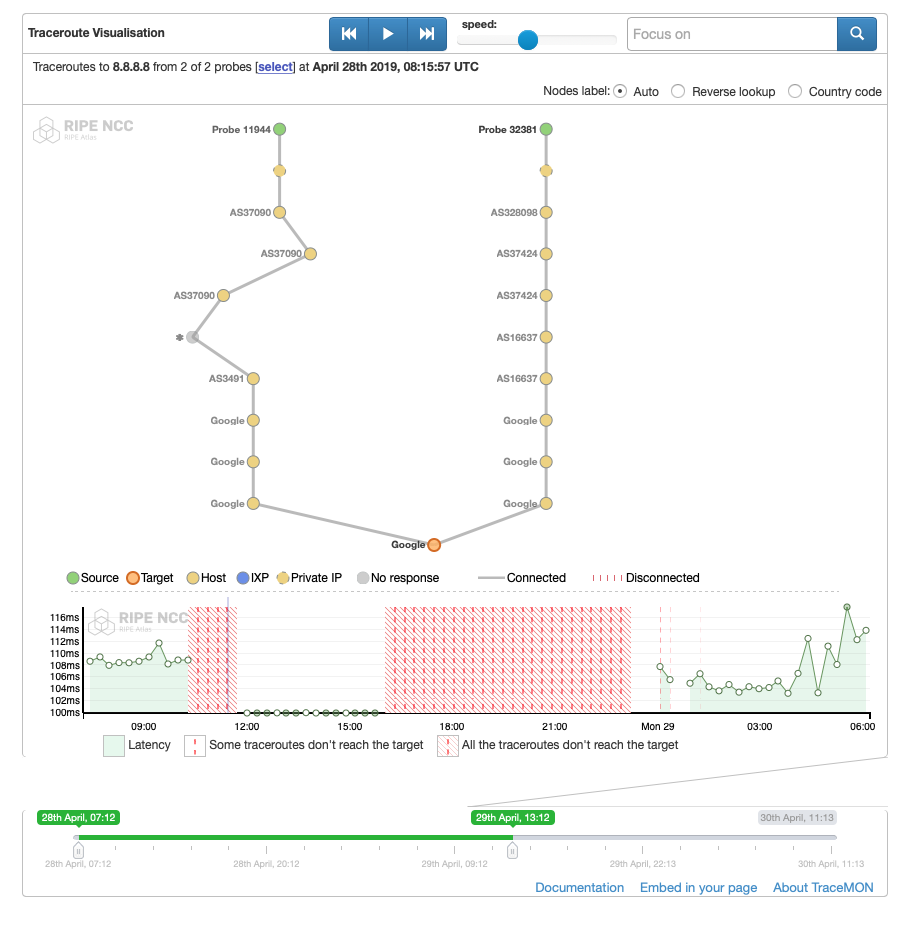
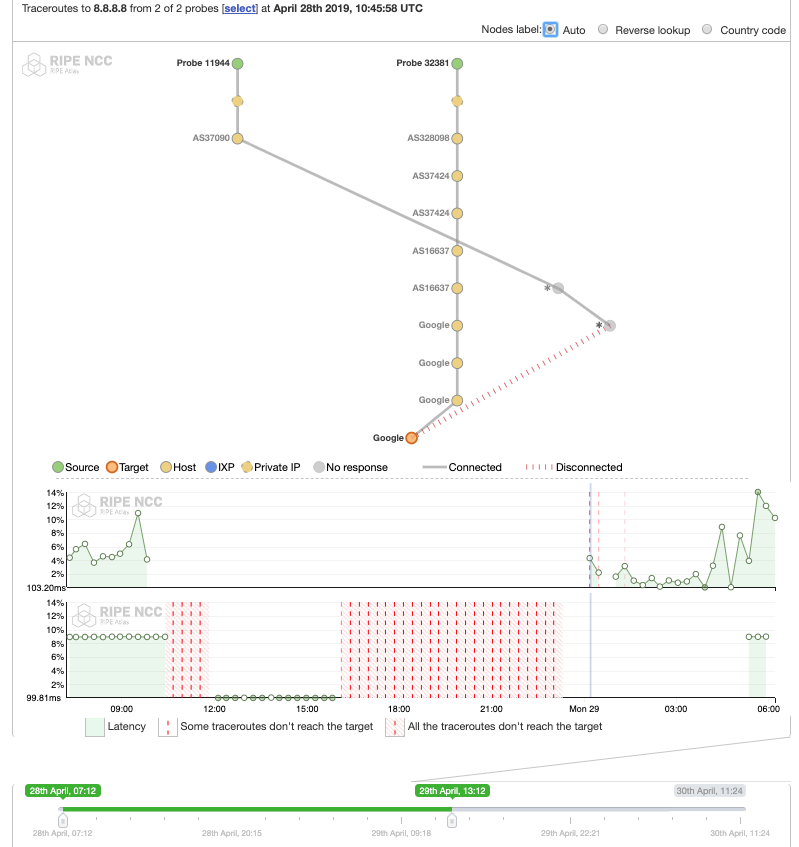
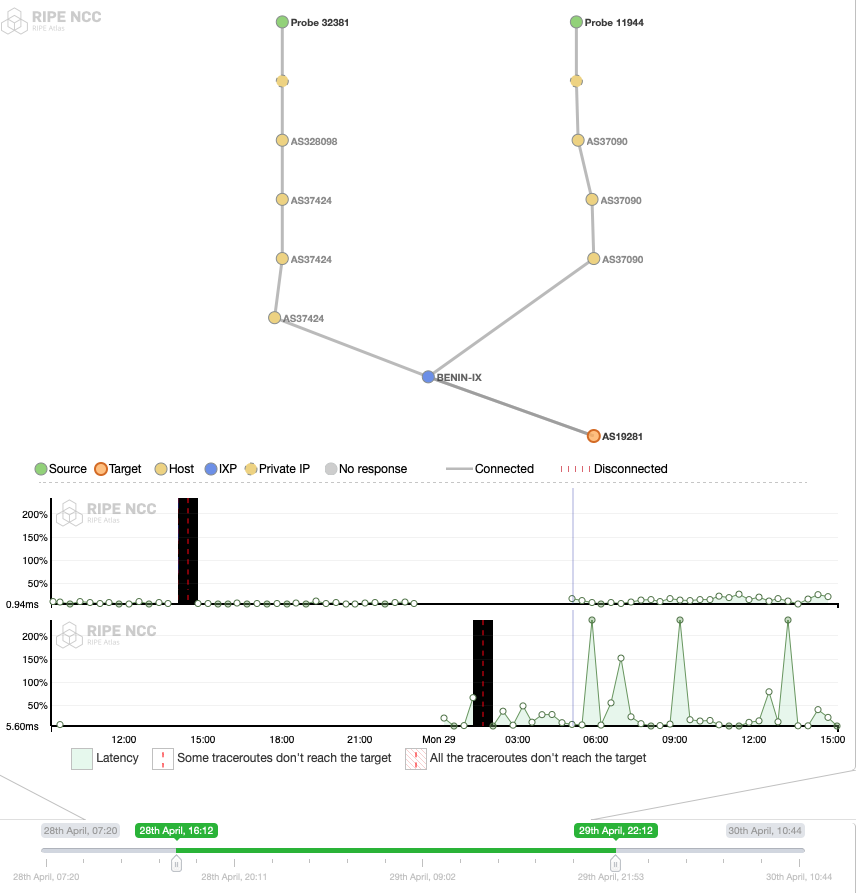
Figures 5, 6, 7, 8, and 9 display for each probe the evolution of the RTT from the source IP to their different destination IPs (y-axis) over the period of the measurements campaign (x-axis). Figure 10, 11, and 12 present not only the RTTs to the destination IPs, but also the inferred AS paths at key moments of the said campaign. We analyze and compare those figures in the next paragraphs, highlighting the insights they provide.

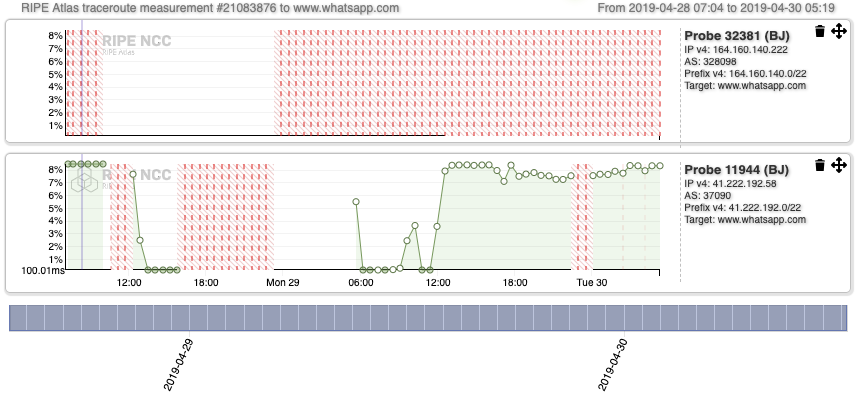
For whatsapp.com, we could not collect any successful measurement outputs from Probe 32381 (top graph in Figure 5) until the end of that period (name resolution failed on the node). By contrast, the results from Probe 11944, hosted in AS37090, were successful (with a median of 113.45 ms) from April 28, 2019 at 7:12 to 10:11 UTC but stopped reaching the target from 10:11 UTC to 12:04 UTC, suggesting that the blocking affected the network layer.

Then followed a period (12:04 UTC to 15:13 UTC) during which RTTs to the same destination gradually decreased from 107.72 ms to 0 ms, indicating that during a short period packets could be transmitted. From April 28, 2019 at 15:13 UTC to April 29, 2019 at 05: 04 UTC, the probe could not reach the destination IP or was fully disconnected again on the IP layer. This corresponds to the biggest period of the blackout (presented in the following Internet blackout section). Traceroutes were only successful again starting from April 29, 2019 at 05:04 UTC.

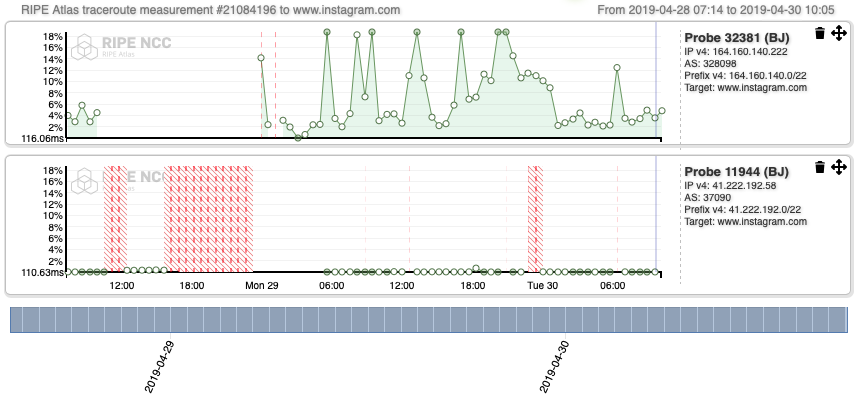
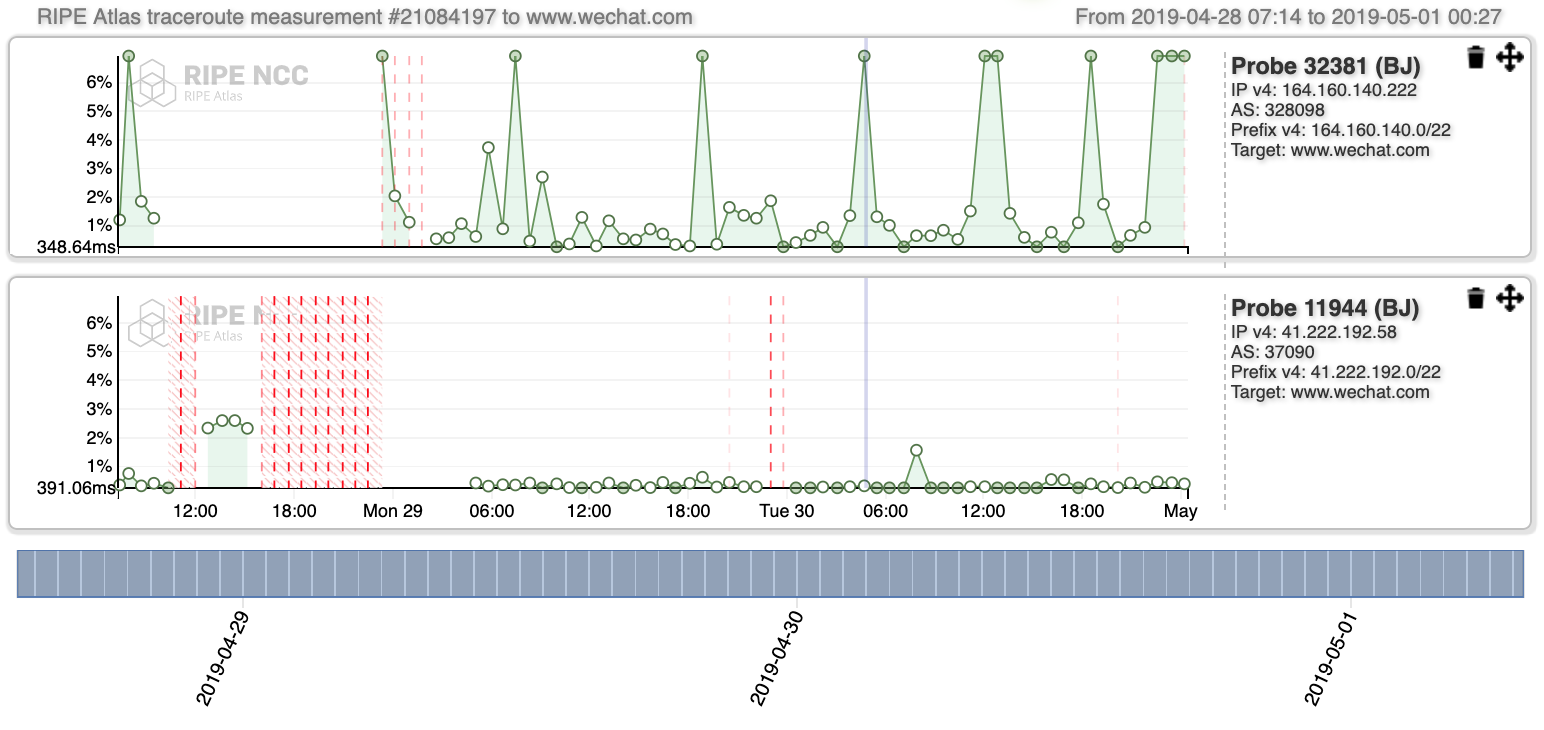
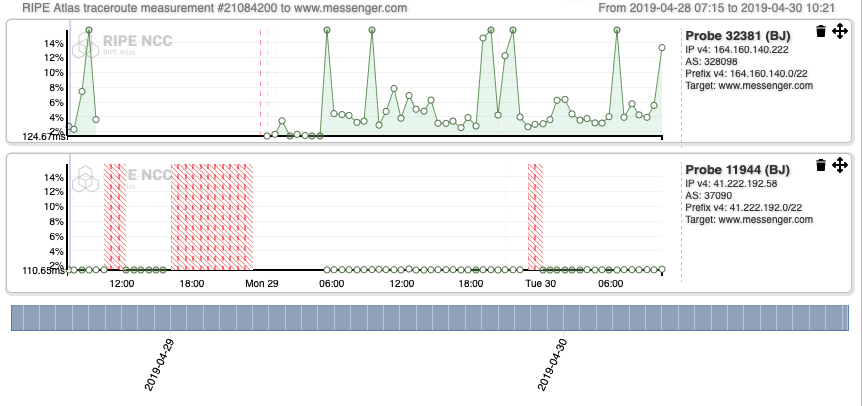
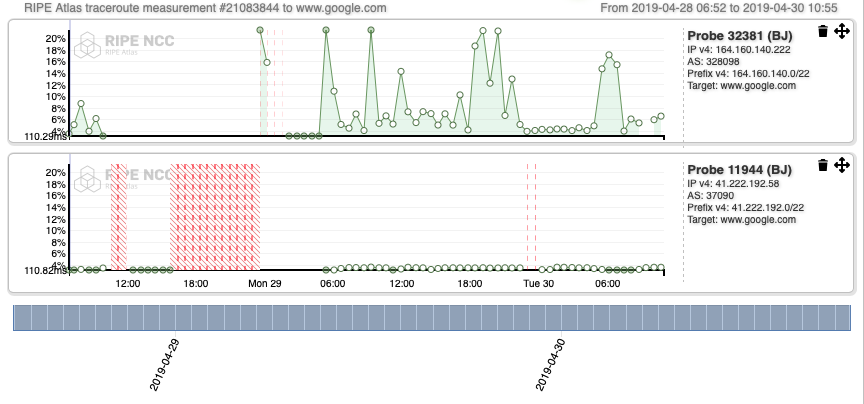
Interestingly, the patterns registered for Probe 11944 when it comes to traceroutes towards the landing webpages of instagram.com (Figure 6), wechat.com (Figure 7), www.messenger.com (Figure 8), www.google.com (Figure 9), Google DNS (Figure 10 and 11), show that the Internet outage is experienced by the source AS (ISOCEL).

Figure 5:RIPE Atlas measurement, Recurring IPv4 traceroute measurement from all probes online in Benin to www.whatsapp.com. The red pattern is registered for Probe 32381 because the probe could not resolve the URL www.whatsapp.com.Figure 5: RIPE Atlas measurement, Recurring IPv4 traceroute measurement from all probes online in Benin to www.whatsapp.com, https://atlas.ripe.net/measurements/21083876/, April 28, 2019. The red pattern is registered for Probe 32381 because the probe could not resolve the URL www.whatsapp.com.


Figure 6:RIPE Atlas measurement, Recurring IPv4 traceroute measurement from all probes online in Benin to www.instagram.comFigure 6: RIPE Atlas measurement, Recurring IPv4 traceroute measurement from all probes online  in Benin to www.instagram.com, https://atlas.ripe.net/measurements/21084196/, April 28, 2019

Figure 7:RIPE Atlas measurement, Recurring IPv4 traceroute measurement from all probes online in Benin to www.wechat.comFigure 7: RIPE Atlas measurement, Recurring IPv4 traceroute measurement from all probes online in Benin to www.wechat.com, https://atlas.ripe.net/measurements/21084197/, April 28, 2019

Figure 8:RIPE Atlas measurement, Recurring IPv4 traceroute measurement from all probes online in Benin to www.messenger.comFigure 8: RIPE Atlas measurement, Recurring IPv4 traceroute measurement from all probes online in Benin to www.messenger.com, https://atlas.ripe.net/measurements/21084200/, April 28, 2019

Figure 9:RIPE Atlas measurement, Recurring IPv4 traceroute measurement from all probes online in Benin to www.google.comFigure 9: RIPE Atlas measurement, Recurring IPv4 traceroute measurement from all probes online in Benin to www.google.com, https://atlas.ripe.net/measurements/21083844/, April 28, 2019

Compared to those of Probe 32381, they are mostly consistent, except for the interval of time between ~12:00 UTC - 00:00 UTC, which is the time during which there was an Internet outage. These results are confirmed by in-depth inspection carried out on AS paths inferred from the traceroute outputs. They suggest that ASes ISOCEL on one side, JENY-AS and Spacetel experience the shutdown differently.

Measurements from Probe 11944, which are gathered from AS37090, are consistent with OONI Probe measurements in the previous section, confirming the accessibility of these services on ISOCEL Telecom.

Figure 10:RIPE Atlas measurement, Recurring IPv4 traceroute measurement from all probes online in Benin to Google DNS (8.8.8.8), (AS paths inferences before the shutdown)Figure 10: RIPE Atlas measurement, Recurring IPv4 traceroute measurement from all probes online in Benin to Google DNS (8.8.8.8), https://atlas.ripe.net/measurements/21083844/ (AS paths inferences before the shutdown), April 28, 2019

Figure 11:RIPE Atlas measurement, Recurring IPv4 traceroute measurement from all probes online in Benin to Google DNS (8.8.8.8), (AS paths inferences during the shutdown)Figure 11: RIPE Atlas measurement, Recurring IPv4 traceroute measurement from all probes online in Benin to Google DNS (8.8.8.8), https://atlas.ripe.net/measurements/21083844/ (AS paths inferences during the shutdown), April 28, 2019

Figure 12: RIPE Atlas measurement, Recurring IPv4 traceroute measurement from all probes online in Benin to 9.9.9.9 (Quad9) depicting that BENIN-IX was mostly UP on election day and that the shutdown did not occur there and proving that each network implemented/suffered from the blackout differently.Figure 12: RIPE Atlas measurement, Recurring IPv4 traceroute measurement from all probes online in Benin to 9.9.9.9 (Quad9) depicting that BENIN-IX was mostly UP on election day and that the shutdown did not occur there and proving that each network implemented/suffered from the blackout differently.  https://atlas.ripe.net/measurements/21084227/, April 28, 2019

We can deduce the following from comparing these figures:

  1. ISOCEL end-users clearly suffered a shutdown on election day, because its network did.
  2. Meanwhile, the destinations of our measurements were all reachable from JENY-AS and Spacetel Benin: MTNNS-AS (AS16637), the sibling of Spacetel was reachable from both ASes on the IP layer, while landing webpages from social media were not.
  3. There was a period (00:00 UTC to 06:00 UTC) during which ISOCEL was experiencing a blackout on the IP layer, while Spacetel was not.
  4. Both networks have been reconnected to the Internet since early April 29, 2019 roughly at 06:00 UTC.
  5. The Internet Exchange point switch was UP during the whole period of the blocking campaign (Figure 12).

Internet blackout

IODA detected significant Internet blackouts affecting Benin on 28th and 29th April 2019. IODA’s data sources further show that these blackouts were not limited to a single AS; instead, many large ASes in Benin experienced blackouts.

About IODA

The Center for Applied Internet Data Analysis (CAIDA) runs a project called IODA (short for Internet Outage Detection and Analysis), which monitors the Internet, in near-realtime, to identify macroscopic Internet outages, affecting the edge of the network (i.e. significantly impacting an AS or a large fraction of a country). IODA does so using three complementary data sources:

  • Global Internet routing (BGP): Using data from ~500 monitors participating in the RouteViews and RIPE RIS projects to establish which network blocks are reachable based on the Internet control plane.
  • Active probing: Continuously probing a large fraction of the (routable) IPv4 address space using a methodology developed by the University of Southern California to infer when a /24 block is affected by a network outage.
  • Internet Background Radiation: Processing unsolicited traffic reaching the UCSD Network Telescope monitoring an unutilized /8 address block.

Data from IODA provides insight into Internet disruptions affecting entire countries, as well as the granularity required for identifying disruptions only affecting certain networks or regions within countries.

Internet blackout in Benin

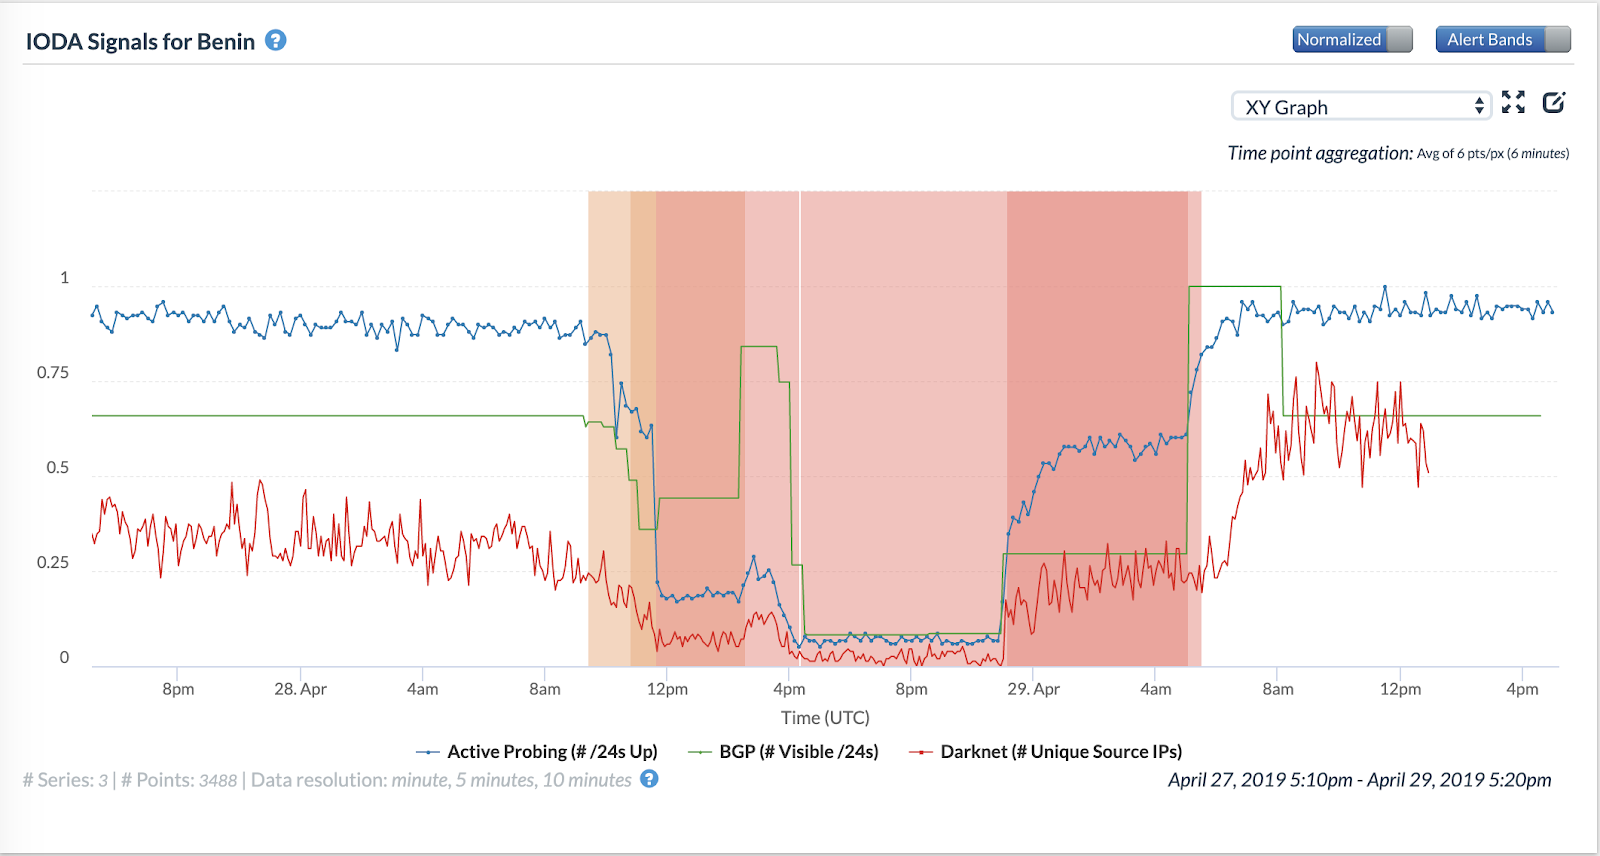
IODA data shows that an Internet blackout occurred in Benin during the elections, on 28th April 2019.

The following figures show the time series for the three data sources that IODA monitors for IP addresses belonging to different aggregates of addresses in Benin.

Figure 13: Internet Outage Detection and Analysis (IODA), BeninFigure 13: Internet Outage Detection and Analysis (IODA), Benin: https://ioda.caida.org

In Figure 13, all three time series indicate the occurrence of a significant Internet blackout. The figure shows that the outage began at around 10 AM UTC on 28th April 2019 (the day of the election). By around 6 AM UTC on the next day, 29th April 2019, the time series for all data sources suggest that the Internet blackout in Benin ended.

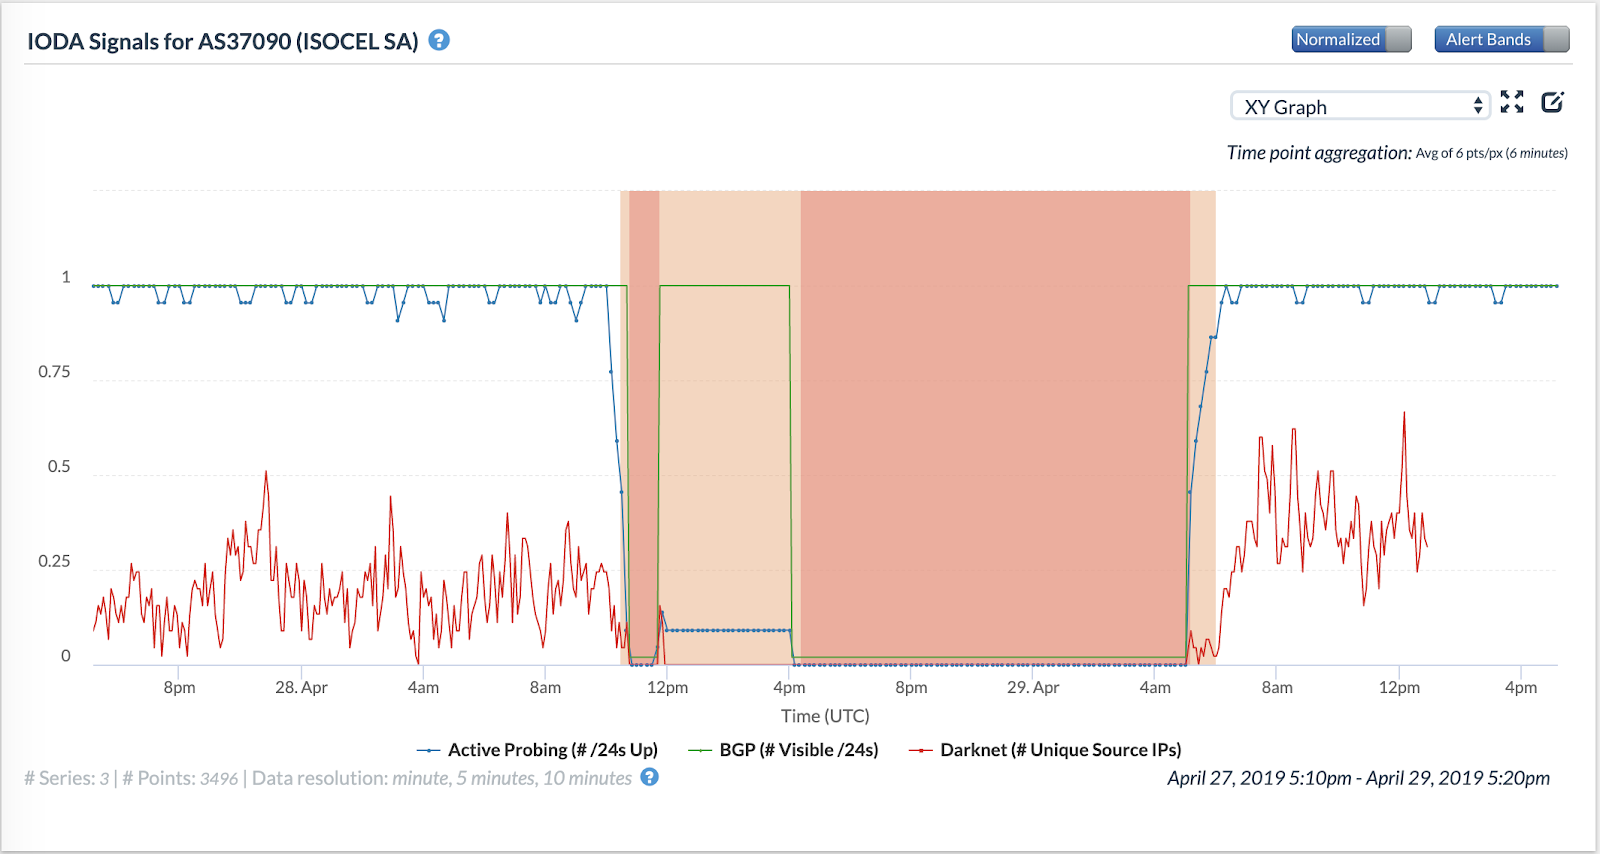
Figures 14, 15, 16 and 17 below show the occurrences of Internet blackout events in four large ASes in Benin.

Figure 14: Internet Outage Detection and Analysis (IODA), AS37090Figure 14: Internet Outage Detection and Analysis (IODA), AS37090: https://ioda.caida.org

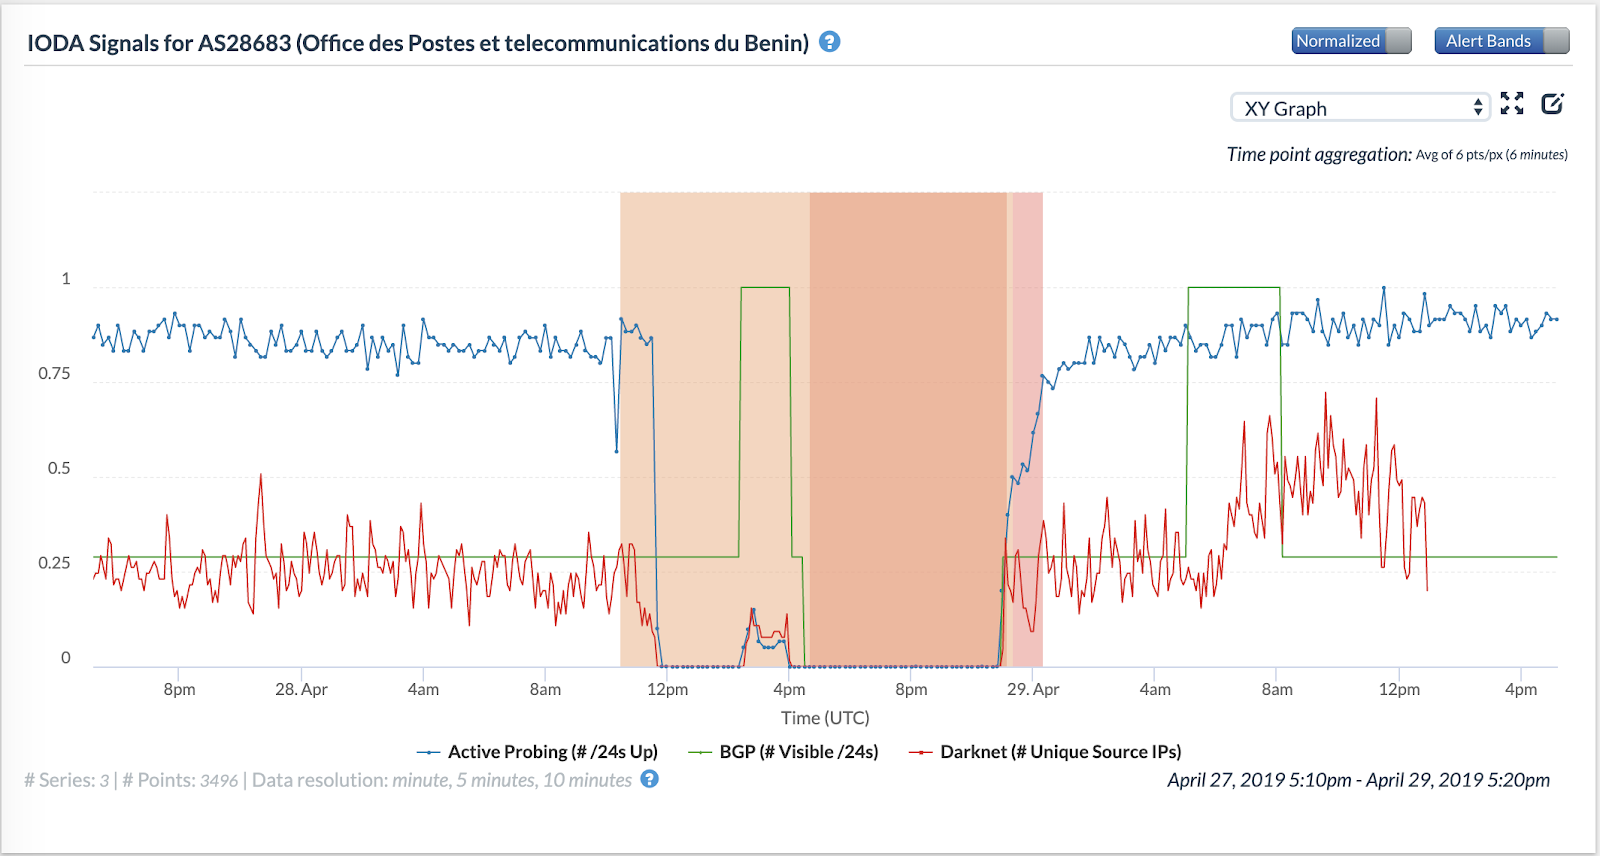
Figure 15: Internet Outage Detection and Analysis (IODA), AS28683Figure 15:  Internet Outage Detection and Analysis (IODA), AS28683: https://ioda.caida.org

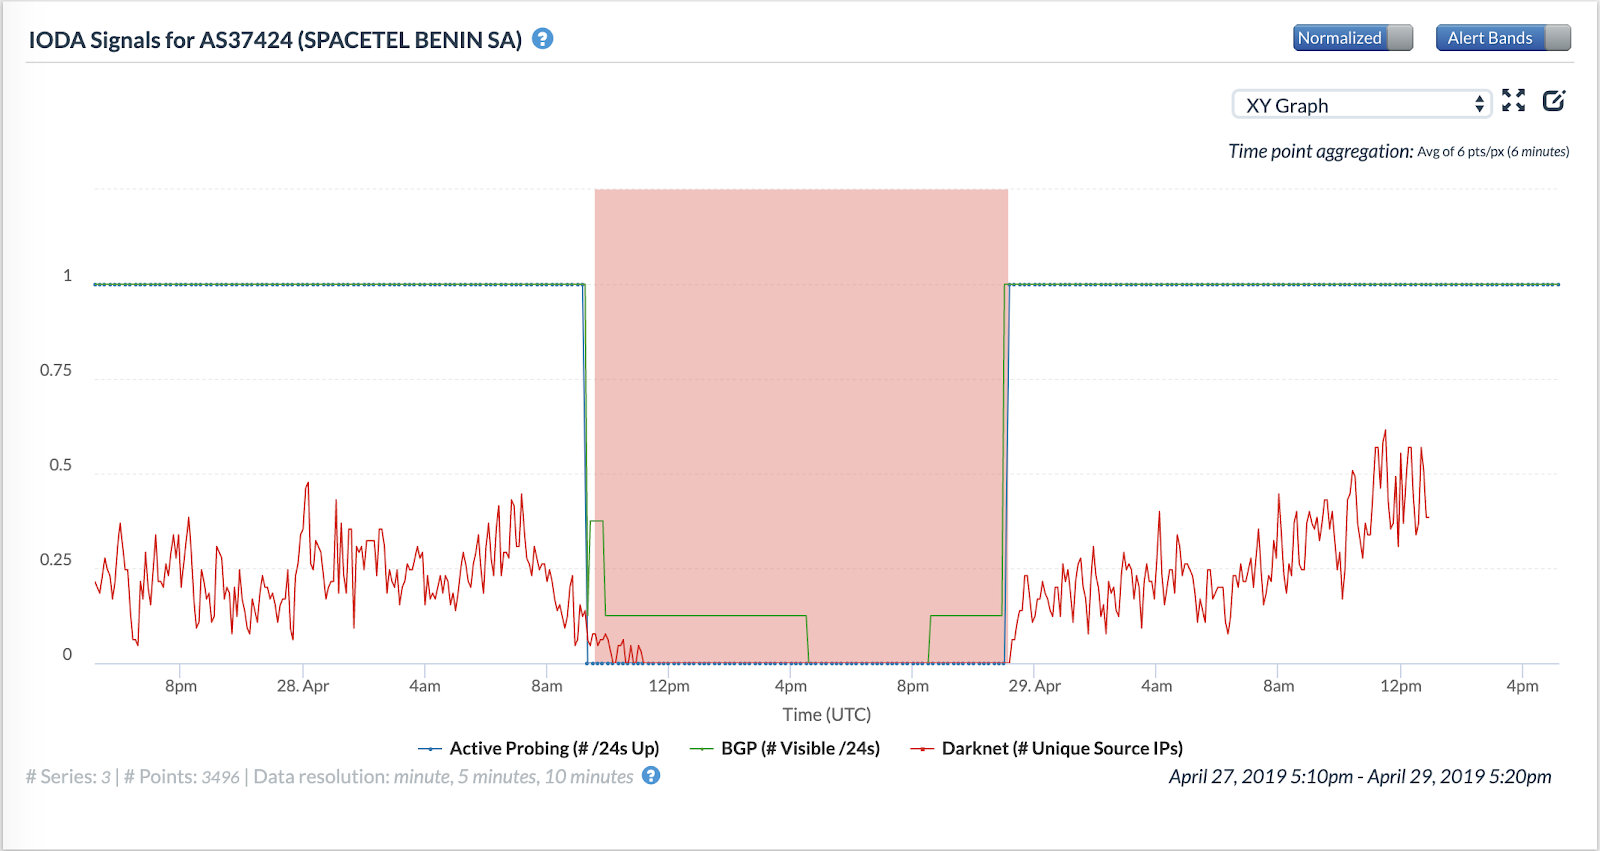
Figure 16: Internet Outage Detection and Analysis (IODA), AS37424Figure 16: Internet Outage Detection and Analysis (IODA), AS37424: https://ioda.caida.org

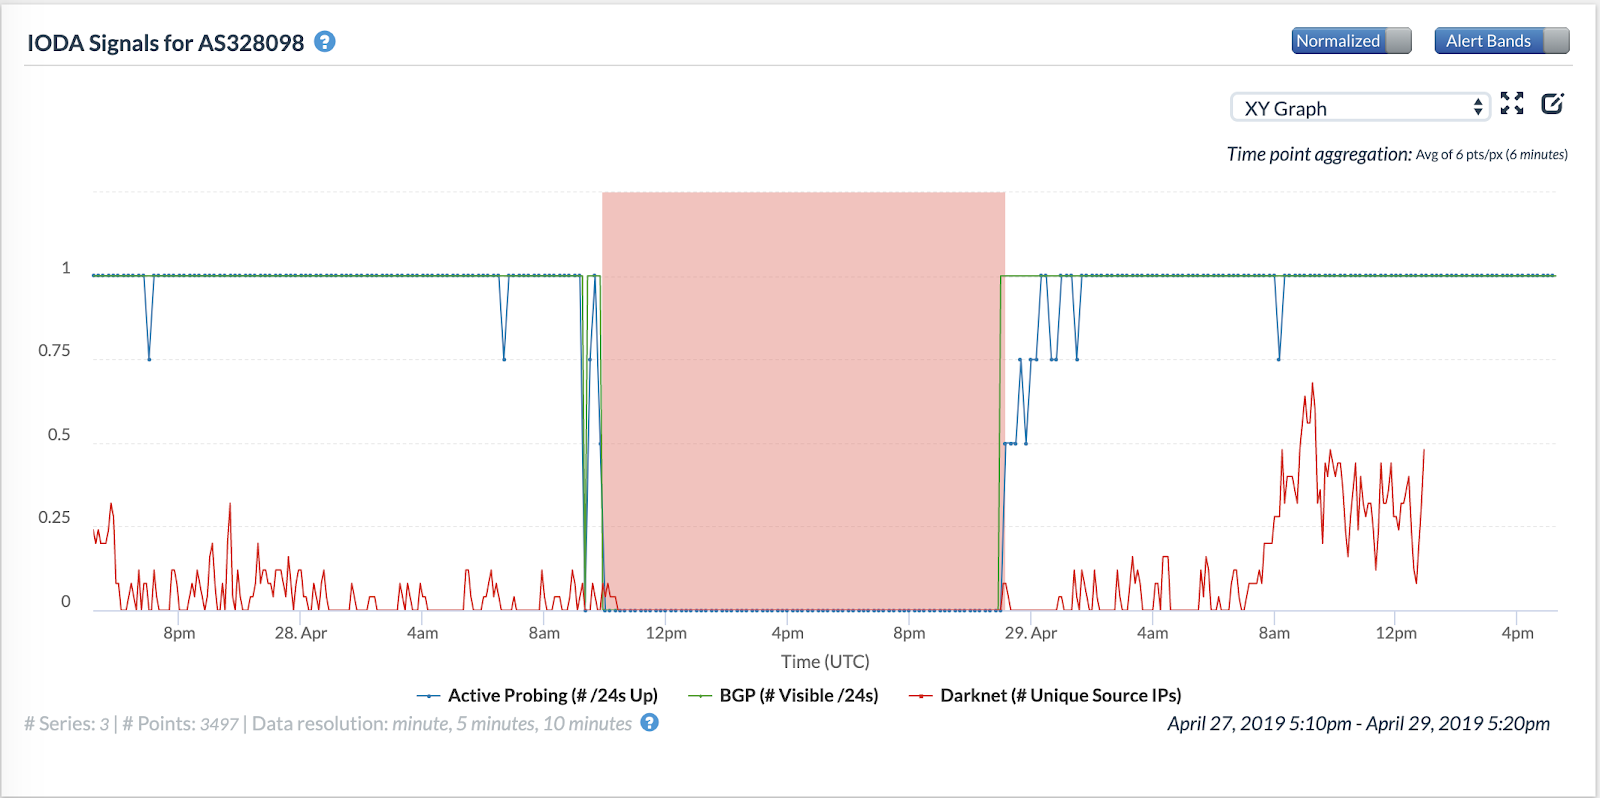
Figure 17: Internet Outage Detection and Analysis (IODA), AS328098Figure 17: Internet Outage Detection and Analysis (IODA), AS328098: https://ioda.caida.org

The figures show that the blackout events began at roughly the same time (around 10 AM UTC) in all the four ASes. However, one of them seems to have recovered connectivity few hours later than the others, suggesting that individual ASes might have implemented shutdowns in their networks independently of each other.

Figures 11 and 12 show that the blackout ended in AS28683 and AS37424 before midnight UTC on 29th April 2019, whereas the blackout ended in AS37090 at around 6 AM UTC. We also observe differences in how the blackout events manifest in IODA’s data sources. AS37090 and AS37424 see a significant drop in BGP-visible /24 blocks at the beginning of the outage. However, AS37090’s visible /24 blocks curve briefly reattains prior values before dropping again. AS28683, on the other hand, experiences only a drop in its active-probing curve initially.

In summary:

  • Four different large ASes in Benin had blackouts. These blackouts were not limited to a single AS; instead, many large ASes in Benin experienced blackouts.
  • The blackouts begin at roughly the same time, but end at different times; it is, therefore, possible that ASes implemented them independently.
  • Each AS’s blackout has a different signature in IODA’s data sources; for some, the blackout is visible in the BGP data source first whereas for others, the blackout is visible in the active probing data source first.

MTN Benin (AS37424) acknowledged the Internet disruptions on 28th April 2019, but declined all responsibility, promising to reimburse its clients.

This post is reposted from the April 30th, 2019 OONI blog at https://ooni.io/post/2019-benin-social-media-blocking/ by Roderick Fanou (CAIDA, UC San Diego), Ramakrishna Padmanabhan (CAIDA, UC San Diego), Arturo Filastò (OONI), and Maria Xynou (OONI).

CAIDA’s Annual Report for 2018

The CAIDA annual report summarizes CAIDA's activities for 2018, in the areas of research, infrastructure, data collection and analysis. Our research projects span Internet topology, routing, security, economics, future Internet architectures, and policy. Our infrastructure, software development, and data sharing activities support measurement-based internet research, both at CAIDA and around the world, with focus on the health and integrity of the global Internet ecosystem. The executive summary is excerpted below:

This annual report summarizes CAIDA's activities for 2018 in the areas of research, infrastructure, data collection and analysis. Our research projects span Internet cartography, security and stability studies (of outages, performance, and vulnerabilities), economics, and policy. Our infrastructure, software development, and data sharing activities support measurement-based internet research, both at CAIDA and around the world, with focus on the health and integrity of the global Internet ecosystem.

Internet Mapping and Performance Measurement. Most notably, we completed our NSF-funded study of interconnection congestion, which required maintaining significant software, hardware, and data processing infrastructure for years to observe, calibrate and analyze trends. We also undertook several research efforts in how to identify and characterize different types of congestion and effects on quality of experience. Our original motivation for this work was an increase in heated peering disputes between powerful players in the U.S. which raised questions about intentional degradation of performance as a business strategy to obtain (or avoid) interconnection fees. The prevalence of these public disputes dropped around the time of the FCCs 2015 Open Internet Order, in which the FCC asserted authority over interconnection, sending a signal to industry to resolve disputes or trigger regulatory oversight. However, our measurements reveal indications of persistently congested transit links, which regardless of cause implies clear motivation for large players to engage in direct peering negotiations. The most important contribution of this work was addressing this decades-long gap in an objective third-party's ability to study peering disputes in an open, objective, scientifically validated way. Especially in today's deregulatory political climate, we consider such measurement to be the most promising strategy for incentivizing good ISP behavior. Other Internet cartography studies we undertook included: extending our ability to identify interconnection boundaries; revealing the load-balancing behavior of YouTube traffic on interdomain links; tracking the topological evolution of content providers in the Internet core; analyzing the African web ecosystem; and inferring carrier-grade NAT deployment without access to a vantage point behind the NAT.

Monitoring Global Internet Security and Stability. Our activities in Internet security and stability monitoring included: surveying network operators on BGP prefix hijacking and developing approaches to quickly neutralize this threat; characterizing the Denial-of-Service ecosystems, and attempts to mitigate DoS attacks via BGP blackholing; and devising metrics to infer the influence of specific Autonomous Systems (ASes) on country-level Internet connectivity. We also continued support for the Spoofer project, including supporting the existing Spoofer measurement platform as well as developing and applying new methods to expand visibility of compliance with source address validation best practices.

Economics and Policy. We published a study on the policy implications of our interconnection measurements, which included attempts to visualize the data in ways we considered most informative to policymakers. We published a study of a game-theoretic approach to interconnection modeling. Finally, we held another lively workshop on Internet economics, where we continued the discussion on what a future Internet regulatory framework should look like. The likelihood of federal regulation is increasing, if only to mitigate the risk of dealing with a patchwork of statelaws related to network management or piracy. There is an expanding awareness that if policymakers hope to rely on academic or scientific research toinform policy, there will need to be increased accuracy and disclosure of data relevant to a given question. As the ecosystem evolves, required measurements/reporting could span from metrics such as se-curity incidents; outages; broadband availability, cost, and pricing; cloud computing capacity and traffic; consumer usage patterns; how various parties in the ecosystem use consumer data. Policymakers and academics must tie the need for these measurements to concrete harms that they would support monitoring. There is also an increasing need to identify sustainable sources of funding for independent, open, trusted measurement of the Internet, and its communication to users and policy makers.

Infrastructure Operations. We continued to operate active and passive measurement infrastructure to provide visibility into global Internet behavior, and associated software tools that facilitate network research and security vulnerability analysis for the community. We made progress on our new project to integrate and increase the accessibility of several of our data collection platforms, starting with improving AS Rank and MANIC (Measurement and Analysis of Interdomain Congestion), and creating APIs for these and other platforms. We also maintained data analytics platforms for Internet Outage Detection and Analysis (IODA) and BGP data analytics (BGPStream).

As always, we engaged in a variety of tool development, and outreach activities, including maintaining web sites, publishing 15 peer-reviewed papers, 1 technical reports, 2 workshop reports, 30 presentations, 9 blog entries. This report summarizes the status of our activities; details about our research are available in papers, presentations, and interactive resources on our web sites. We provide listings and links to software tools and data sets shared, and statistics reflecting their usage. Finally, we offer a "CAIDA in numbers" section: statistics on our performance, financial reporting, and supporting resources, including visiting scholars and students, and all funding sources.

CAIDA's program plan for 2018-2021 is available at at www.caida.org/home/about/progplan/progplan2018/. Please feel free to send comments or questions to info at caida dot org.

For the full 2018 annual report, see http://www.caida.org/home/about/annualreports/2018/

Technological Developments in Broadband Networking at March FTC Hearing

(Forgot to post this earlier, this is old news by now but fwiw..)
I presented at the 10th FTC Hearing on Competition and Consumer Protection in the 21st century this March, held in Washington D.C., giving a talk about Technological Developments in Broadband Networking which aims to address this question: Which (recent and expected) technological developments, or lack thereof, are important for understanding the competitiveness of the industry or impacts on the public interest?

A webcast of the presentation (my talk begins at 10m30s) is available. I also participated in a discussion panel, also webcast.

9th Workshop on Internet Economics

On December 12-13, 2018, CAIDA and the Massachusetts Institute of Technology (MIT) hosted the (invitation-only) 9th interdisciplinary Workshop on Internet Economics (WIE) at the University of California San Diego in La Jolla, CA.

The goal of this workshop series is to provide a forum for researchers, commercial Internet facilities and service providers, technologists, economists, theorists, policy makers, and other stakeholders to empirically inform emerging Internet regulatory and policy debates.

Presenters were asked to write talk abstracts on their presented topics, addressing four questions:

  1. What is the policy goal or fear you're addressing?
  2. What data is needed to measure progress toward/away from this goal fear?
  3. What methods do you propose (or are) being used to gather such data?
  4. Who/how should such methods be executed, and the data shared, or not shared?

With a specific focus on measurement challenges, the topics we discussed included: analyzing the evolution of the Internet in a layered-platform context to gain new insights; measurement and analysis of economic impacts of new technologies using old tools; security and trustworthiness, reach (universal service) and reachability, sustainability of investment into public Internet infrastructure, as well as infrastructure to measure the public Internet.

Some of the takeaways from the workshop included:

  1. There is an expanding awareness that if policymakers hope to rely on academic or scientific research to inform policy, there will need to be increased accuracy and disclosure of data relevant to a given question. As the ecosystem evolves, required measurements/reporting could span from metrics such as security incidents; outages; broadband availability, cost, and pricing; cloud computing capacity and traffic; consumer usage patterns; how various parties in the ecosystem are using consumer data. Policymakers and academics must tie the need for these measurements to concrete harms that they would supporting monitoring or avoiding. There is also an increasing need to identify sustainable sources of funding for independent, open, trusted measurement of the Internet, and its communication to users and policy makers.
  2. One repeated "low fruit" suggestion was to require a programmatic API for accessing basic broadband service tier information, which would facilitate use of FCC MBA data, and also stimulate innovation of other measurement technology.
  3. The current theories and practices to deal with market concentration and antitrust are arguably failing to support the public policy needs of the IT space. The Internet ecosystem is distinctive with respect to speed of growth, mutation, amplification, prevalence of multi-sided markets, and network effects. Decisions about mergers and market concentration in multi-sided platform economics cannot rely on single-market metrics for evaluation.
  4. Increased data mining of consumers that allows perfect price discrimination may have the unintended effect of eroding the operation of capitalist markets, which depend on a degree of information symmetry.
  5. An important higher-level question is the character of the public space that is the Internet, how it is changing, and which actors have the power to influence that change. This is more important, but much more challenging to measure, than specific mechanisms such as routing or peering.
  6. The likelihood of federal regulation is increasing if only to mitigate the risk of dealing with a patchwork of state laws related to network management or piracy. The research community is in a position to inform regulation, and hopefully prevent poor regulations, as well as measure the impact of regulation (or at least what happens after regulation, since causation is difficult to establish). Measurement should be the foundation for a discourse about what would define good regulation. Actual data may be the best antidote to the current partisan divisiveness.

Geoff Huston (APNIC) wrote a commentary about the WIE workshop in his blog, the ISP Column: Internet Economics.

The final report on the WIE 2018 workshop is available online.

Announcing public access to CAIDA's platform for Measurement and Analysis of Interdomain Congestion (MANIC)

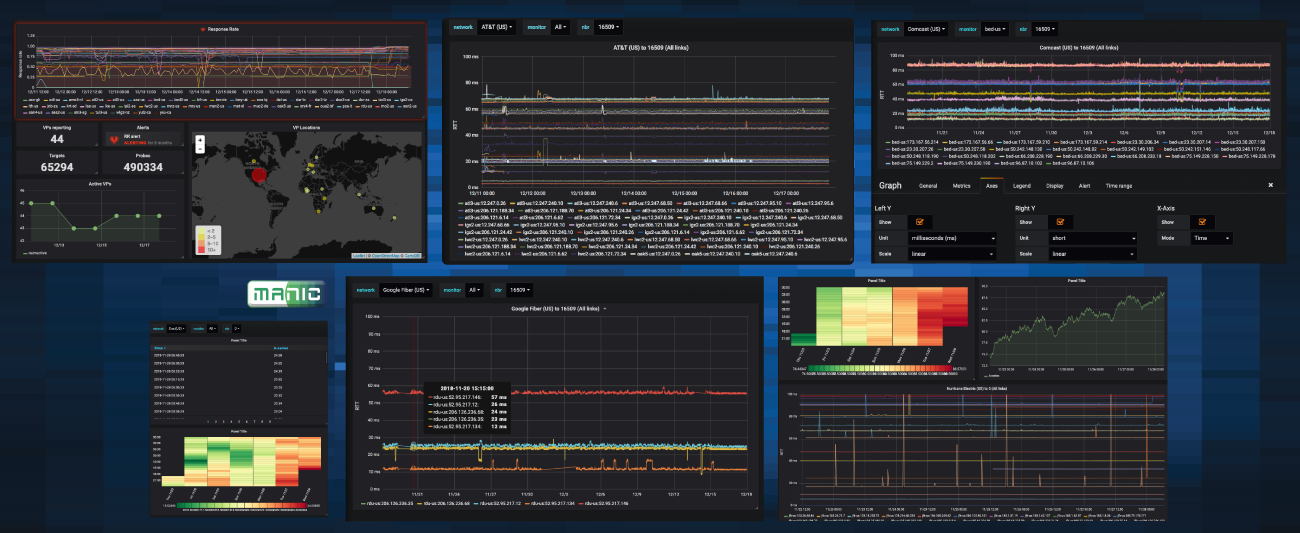
Presented at our 10th AIMS Workshop earlier this year, the MANIC project resulted in a prototype system to monitor interdomain links and their congestion state to support inference of persistent interdomain congestion. We announce the release of web and API-based methods to access the data. MANIC provides both a graphical user interface for conducting queries and visualizing results and programmatic access to the measurements via a queryable API. We used this MANIC infrastructure and data in our recent publication of "Inferring Persistent Interdomain Congestion", which won the best paper award at ACM SIGCOMM 2018.

                                                       MANIC dashboard screenshot examples.

Excerpted from the paper:

"(4) We are publicly releasing our analysis scripts, and the underlying datasets via an interactive visualization interface and query API to encourage reproducibility of our results. Our data management system, based on the InfluxDB time-series database and Grafana visualization front-end, allows interactive data exploration, near real-time views of interdomain links, and longitudinal views. While this paper focuses on data from U.S. broadband access providers, we are publicly releasing measurements from VPs outside the U.S. as well."

For access to the MANIC dashboard, or questions about the publicly accessible API, please contact manic-info@caida.org. (It is a beta prototype, in progress!)


Support for this work is provided by the National Science Foundation (NSF) grants NSF CNS-1414177, NSF OAC-1724853, NSF CNS-1513283, and Department of Homeland Security S&T HHSP 233201600012C and FA8750-18-2-0049.


CAIDA wins Best Paper at ACM SIGCOMM 2018!

Congratulations to Amogh Dhamdhere, David Clark, Alexander Gamero-Garrido, Matthew Luckie, Ricky K.P. Mok, Gautam Akiwate, Kabir Gogia, Vaibhav Bajpai, Alex Snoeren, and kc claffy, for being awarded Best Paper at SIGCOMM 2018!

The abstract from the paper, "Inferring Persistent Interdomain Congestion":

There is significant interest in the technical and policy communities regarding the extent,scope, and consumer harm of persistent interdomain congestion. We provide empirical grounding for discussions of interdomain congestion by developing a system and method to measure congestion on thousands of interdomain links without direct access to them. We implement a system based on the Time Series Latency Probes (TSLP) technique that identifies links with evidence of recurring congestion suggestive of an under-provisioned link. We deploy our system at 86 vantage points worldwide and show that congestion inferred using our lightweight TSLP method correlates with other metrics of interconnection performance impairment. We use our method to study interdomain links of eight large U.S. broadband access providers from March 2016 to December 2017, and validate our inferences against ground-truth traffic statistics from two of the providers. For the period of time over which we gathered measurements, we did not find evidence of widespread endemic congestion on interdomain links between access ISPs and directly connected transit and content providers, although some such links exhibited recurring congestion patterns. We describe limitations, open challenges, and a path toward the use of this method for large-scale third-party monitoring of the Internet interconnection ecosystem.

Read the full paper on the CAIDA website.

IODA is now on Twitter

Detecting Internet outages world-wide and in real-time is no small feat. It requires distributed measurement infrastructure, tools and processing power to analyze the resulting data, plenty of storage to save it, and a powerful user interface to visualize the data. IODA (short for Internet Outage Detection and Analysis) is CAIDA's solution to this problem.

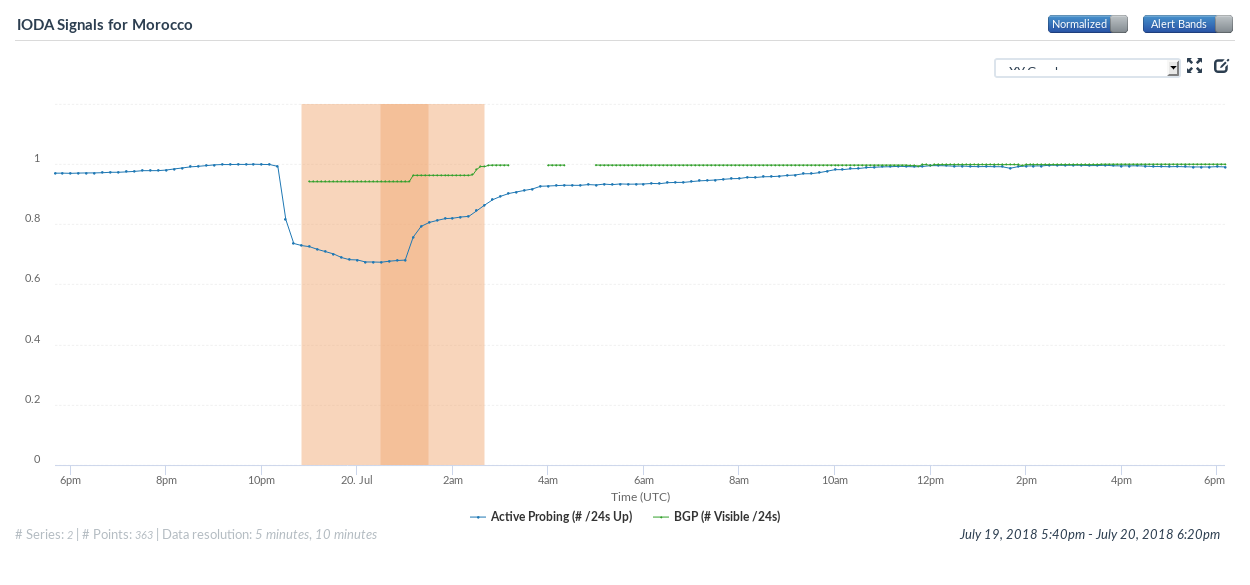
In an attempt to make IODA more useful, we just launched @caida_ioda, a Twitter account to bring attention to select Internet outages. We inaugurated this account by revealing an outage that took place in Morocco, on July 19, from 11:30 pm to 3:50 am local time. The visualization below illustrates this outage. The blue time series represents our active probing data. This data comes from a cluster of twenty software instances, located at SDSC in San Diego, that repeatedly ping active hosts in the IPv4 address space. Each data point of the time series captures the normalized number of /24 network blocks in Morocco that responded to these pings. The data is normalized with respect to the maximum value observed in the inspected time interval. Starting at 10:20 pm UTC, this fraction dropped significantly (from ~19,700 /24 network blocks to as low as ~13,400) and slowly started to recover after a few hours. The green time series exhibits a drop at the same time—it represents the normalized number of /24 network blocks that are reachable according to BGP, and geolocated to Morocco. The gaps in the BGP time series are due to missing data points caused by temporary issues with our infrastructure. You can use our interactive dashboard to investigate this outage yourself.

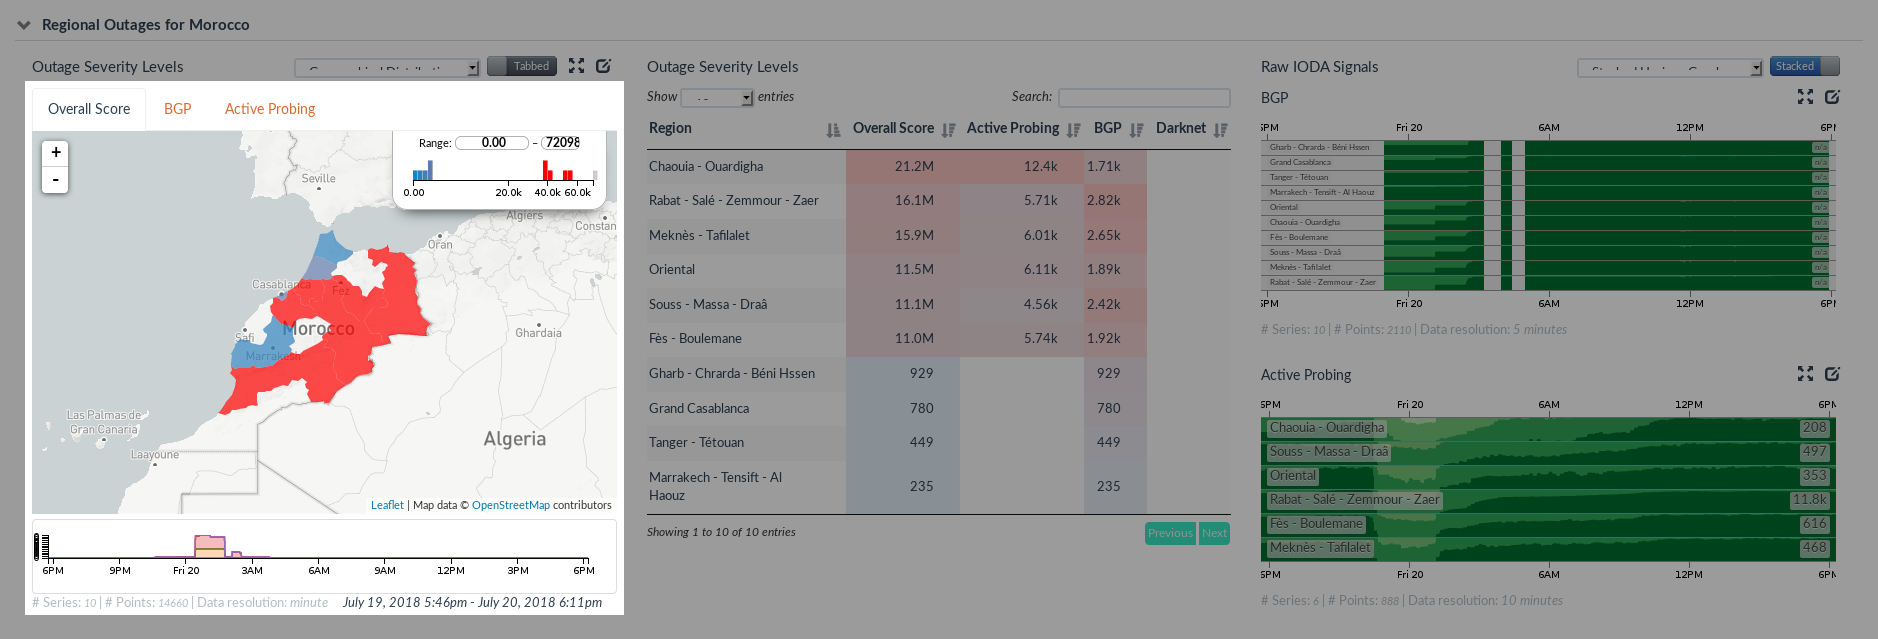
Internet outages do not always affect entire countries; their scope is frequently limited to regions or autonomous systems (ASes). IODA can detect such sub-national outages and, coming back to our example, did so for Morocco. The map below suggests that not all of the country's regions were affected equally. Note, however, that IP address geolocation (that is, the mapping from IP address to geographical location) is far from perfect, so take this information with a grain of salt.

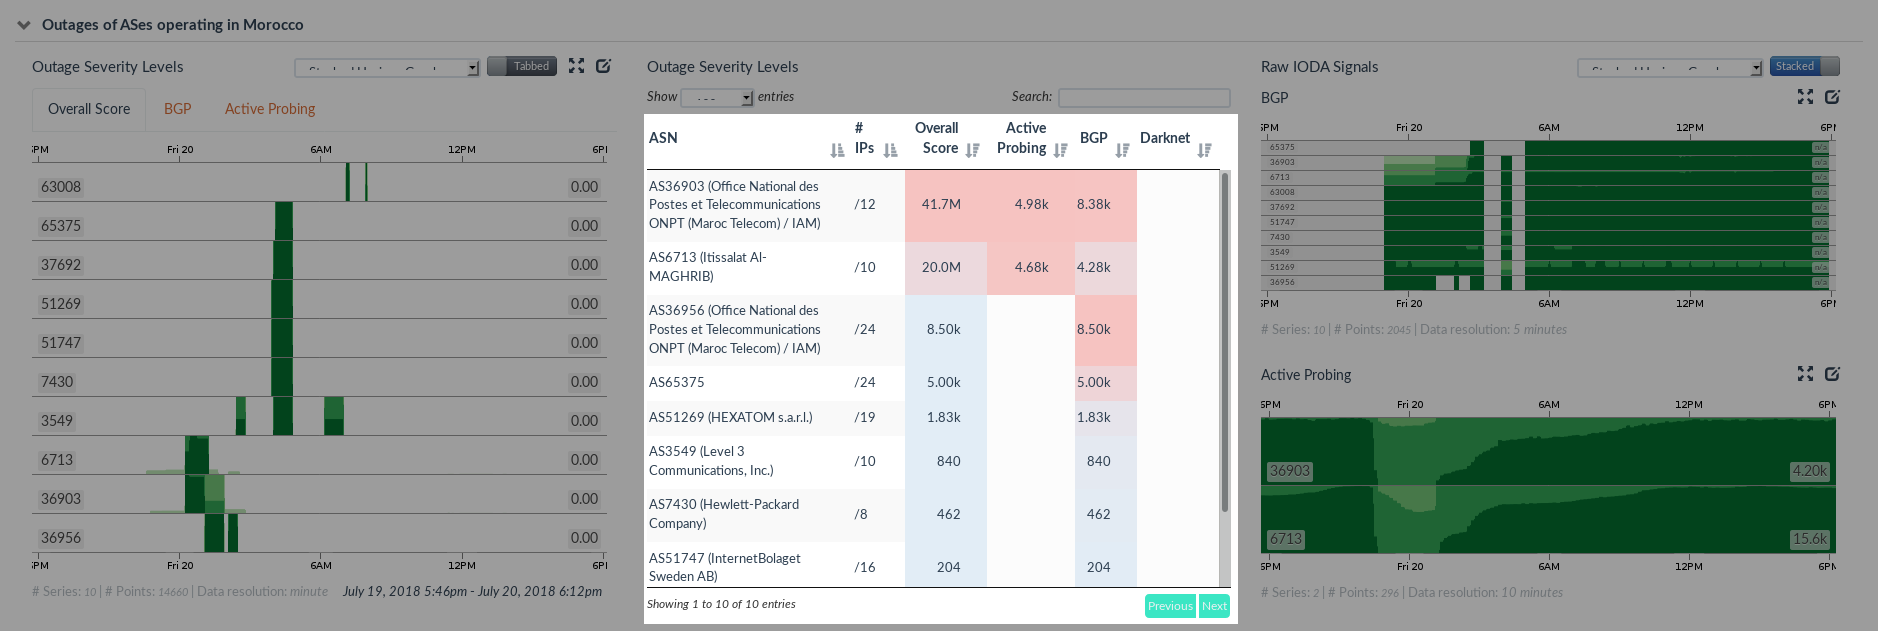
IODA determines an anomaly score for each outage that it detects. Our help page provides more details on how we determine this score but in essence it's a number that captures the severity of the outage. A look at IODA's AS-level breakdown confirms that Maroc Telecom was affected the most—the ISP's overall anomaly score is more than twice that of Itissalat Al-Maghrib, the ISP that ranked second.

So, what happened? IODA reveals where Internet outages happen but it cannot tell us why. Understanding an outage's root cause still requires a human in the loop; mostly to read news reports and social media postings that mention the outage. In our example, a search of the Arabic-speaking part of the Internet for "morocco internet" led us to Maroc Telecom's Facebook page, which cited a power outage as the cause:

The time span quoted by Maroc Telecom roughly confirms what IODA saw but our data suggests that the outage began earlier—our active probers first saw a decline in connectivity at 11:30 pm—about half an hour before the alleged start of the outage.

We are supporting public access to IODA's dashboard for exploration of this and other outages; please use it and send feedback to ioda-info AT caida DOT org.