
According to the Best Available Data

The CAIDA blog — commentary and analysis of Internet measurement, infrastructure, policy, and economics, published since 2006. Formerly hosted at blog.caida.org. See About the CAIDA Blog · Categories · All entries by month · RSS feed.

CAIDA's 2021 Annual Report

The CAIDA annual report summarizes CAIDA's activities for 2021 in the areas of research, infrastructure, data collection and analysis. Our research projects span: Internet cartography and performance; security, stability, and resilience studies; economics; and policy. Our infrastructure, software development, and data sharing activities support measurement-based Internet research, both at CAIDA and around the world, with focus on the health and integrity of the global Internet ecosystem.
The executive summary is excerpted below:

Internet Mapping. We continued to pioneer methods and tools for Internet cartography, including for identifying and geolocating cloud interconnections, and inferring regional access topologies of Internet Service Providers. We extended our efforts from last year in automated learning of semantic structure in router hostnames, to include extraction of geographic and network ownership information. We also developed a methodology to identify state-owned Internet operators in observed network level (BGP) topology data. These building blocks will enable creation of macroscopic Internet topology maps of unprecedented richness and fidelity.

Performance Measurement. We designed and implemented a system to leverage thousands of public speedtests servers to comprehensively measure performance from the public clouds to other networks. In collaborate with U. Twente, we built on our anycast census work from last year to characterize the growing adoption of anycast in DNS authoritative infrastructure, and its implications.

Security, Stability, and Resilience (SSR) of the Internet’s addressing, routing, and naming systems. We completed five technical and two policy studies on vulnerabilities of the subsystems that constitute the Internet’s fundamental plumbing: IP addressing, DNS, and BGP routing. Each of these systems was characterized by critical flaws that continue to leave the Internet ecosystem vulnerable to a variety of attacks. Our published studies in 2021 included: analyzing the (in)accuracy of the existing Internet Routing Registry (IRR) databases as the emerging Resource Public Key Infrastructure gains traction; comparing the administrative (observable in Regional Internet Registry (RIR) data) vs operational properties (observable in BGP data) of autonomous systems; IPv6 privacy mechanism vulnerabilities; and risks exposed by DNS registrar name management practices. Our collaboration with MIT Lincoln Labs continued as they used the UCSD Telescope data to study security-relevant scaling characteristics of darkspace traffic.

Economics and Policy. Our final research thrust focuses on the implications of empirical studies of the Internet on public policy. KC completed participation in ICANN’s Second Security, Stability, and Resiliency (SSR2) Review Team, and continues to serve as a shepherd to support ICANN’s processing of the recommendations. We supported economists at Harvard in using our topology data to study the impact of GDPR on the interconnection ecosystem. Finally, we described data-driven approaches to improve the security of the Internet infrastructure.

Infrastructure Operations. Our continuing NSF and new DARPA support allowed us to make progress on almost all infrastructure components that create data products in the most demand by the community, including Ark, AS Rank, AS-to-Org mapping, BGPStream, Periscope, Spoofer, and the UCSD Network Telescope. We reached milestones with new infrastructure components: a new DNZ TLD zone database, an IP address metadata software library; a new BGPView data processing pipeline component of BGPStream, and the FANTAIL project for processing and querying terabytes of traceroute data, and our rich-context Resource Catalog for CAIDA Internet Data Science Resources.

New Infrastructure Awards. In collaboration with U. Oregon’s Network Startup Resource Center (NSRC) and MIT, we received two large National Science Foundation (NSF) infrastructure grants that started in October 2021. The first was Integrated Laboratory for Advancing Network Data Science (ILANDS), which will support enhancements to our infrastructure to handle 100GB packet rates, and projected routing table growth, including deploying enhanced storage and compute resources to support long-term use of the data. The second is our largest award to date: a Mid-scale Research Infrastructure Design Project to build a Global Measurement Infrastructure. We are grateful for this project which offers a potential path to put CAIDA’s activities on a sustainable footing. It will support our design and prototyping of a new highly distributed network measurement platform capable of capturing several types of data relevant to security research, as well as hosting new vetted experiments. We will have more to report on these projects next year.

Community Service. At NSF’s invitation/request, we had the honor of co-organizing the first NSF-sponsored Workshop on Overcoming Measurement Barriers to Internet Research in early 2021, and posted a report that was cited in NSF’s new Internet Measurement Research solicitation, the first U.S.-government solicitation ever focused on Internet measurement research. Progress!

Everything Else. As always, we engaged in a variety of tool development, data sharing, and outreach activities, including updating our web site, and publishing 13 peer-reviewed papers, 2 workshop reports, 9 presentations, and 2 blog entries. This report summarizes the status of our activities. Details about our research are available in papers, presentations, and interactive resources on our web sites. We provide listings and links to software tools and data sets shared, and statistics reflecting their usage. Finally, we offer a “CAIDA in numbers” section: statistics on our performance, financial reporting, and supporting resources, including visiting scholars and students, and all funding sources.

CAIDA’s program plan for 2018-2023 is available at https://www.caida.org/about/progplan/progplan2018/. We will begin our 2023-2028 program plan in late 2022. Please feel free to send comments or questions to info at caida dot org. Please note the link to donate to CAIDA at the top of our newly renovated web site; UC San Diego charges no overhead on donations; it is tax-deductible and goes 100% to research (no university overhead)!

For the full 2021 annual report, see https://www.caida.org/about/annualreports/2021/
IRR Hygiene in the RPKI Era

The Border Gateway Protocol (BGP) is the protocol that networks use to exchange (announce) routing information across the Internet. Unfortunately, BGP has no mechanism to prevent the propagation of false announcements such as hijacks and misconfigurations. The Internet Route Registry (IRR) and Resource Public Key Infrastructure (RPKI) both emerged as different solutions to improve routing security and operation in the Border Gateway Protocol (BGP) by allowing networks to register information and develop route filters based on information other networks have registered.

The Internet Routing Registry (IRR) was first introduced in 1995 and remained a popular tool for BGP route filtering. However, route origin information in the IRR suffers from inaccuracies due to the lack of incentive for registrants to keep information up to date and the use of non-standardized validation procedures across different IRR database providers.

Over the past few years, the Resource Public Key Infrastructure (RPKI), a system providing cryptographically attested route origin information, has seen steady growth in its deployment and has become widely used for Route Origin Validation (ROV) among large networks.

Some networks are unable to adopt RPKI filtering due to technical or administrative reasons and continue using only existing IRR-based route filtering. Such networks may not be able to construct correct routing filters due IRR inaccuracies and thus compromise routing security.

In our paper IRR Hygiene in the RPKI Era, we at CAIDA (UC San Diego), in collaboration with MIT, study the scale of inaccurate IRR information by quantifying the inconsistency between IRR and RPKI. In this post, we will succinctly explain how we compare records and then focus on the causes of such inconsistencies and provide insights on what operators could do to keep their IRR records accurate.

IRR and RPKI trends

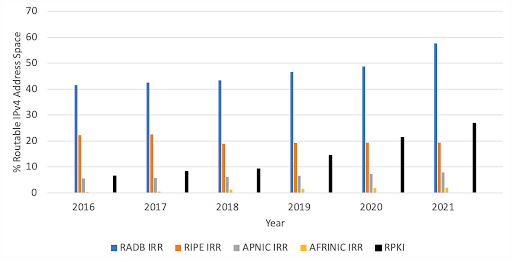
For our study we downloaded IRR data from 4 IRR database providers: RADB, RIPE, APNIC, and AFRINIC, and RPKI data from all Trust Anchors published by the RIPE NCC. Figure 1 shows IRR cover more IPv4 address space than RPKI, but RPKI grew faster than IRR, having doubled its coverage over the past 6 years.

Figure 1. IPv4 coverage of IRR and RPKI databases. RADB, the largest IRR database, has records representing almost 60% of routable IPv4 address space. In contrast, the RPKI covers almost 30% of that address space but has been steadily growing in the past few years.

Checking the consistency of IRR records


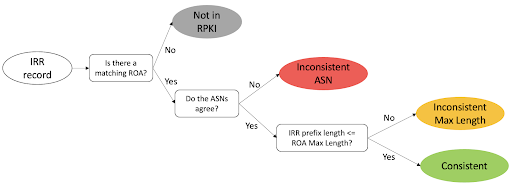
We classified IRR records following the procedure in Figure 2: first we check if there is a Route Origin Authorization (ROA) record in RPKI covering the IRR record, then in case there is one if the ASN is consistent, and finally, if the ASN is consistent, we check the prefix length compared to the maximum length attribute of RPKI records. Using this procedure we are left with 4 categories:

  1. Not In RPKI: If the prefix in an IRR record has no matching or covering prefix in RPKI.
  2. Inconsistent ASN: If the IRR record has matching RPKI records but none has the same ASN..
  3. Inconsistent Max Length category: If the IRR record has the same ASN as its matching RPKI records but the prefix length in the IRR record is larger than the Max Length field in the RPKI records.
  4. Consistent: If the IRR records have a matching RPKI record with the same ASN and according maximum length attribute.

Figure 2. Classification of IRR records

Which is more consistent? RADB vs RIPE, APNIC, AFRINIC


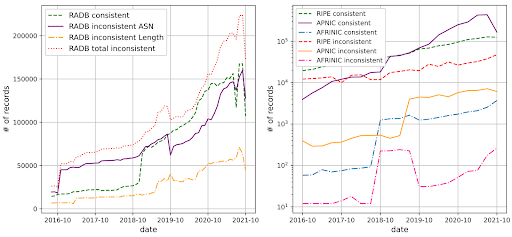
As of October 2021, we found only 38% of RADB records with matching ROAs were consistent with RPKI, meaning that there were more inconsistent records than consistent records in RADB, see Figure 3 (left) . In contrast, 73%, 98%, and 93% of RIPE, APNIC, and AFRINIC IRR records were consistent with RPKI, showing a much higher consistency than RADB, see Figure 3 (right).


We attribute the big difference in consistency to a few reasons. First, the IRR database we collected from the RIRs are their respective authoritative databases, meaning the RIRs manages all the prefixes, and verifies the registration of IRR objects with address ownership information. This verification process is stricter than that of RADB and leads to the higher quality of IRR records. Second, APNIC provides its registrants a management platform that automatically creates IRR records for a network when it registers its prefixes in RPKI. This platform contributes to a larger number of consistent records compared to other RIRs.


Figure 3. RIR-managed IRR databases have higher consistency with RPKI compared to RADB.


What caused the inconsistency?

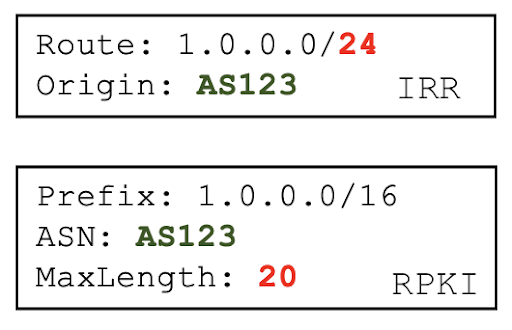
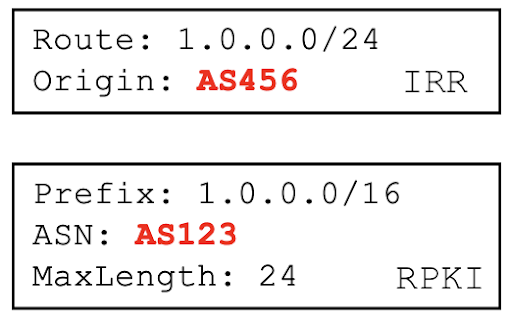
In our analysis we found that inconsistent max length was mostly caused by IRR records that are too specific, as the example shown in Figure 4, and to a lesser extent by misconfigured max length attribute in RPKI.  We also found that inconsistent ASN records are largely caused by customer networks failing to remove records after returning address space to their provider network, such as the example in Figure 5.

Inconsistent Max Length (Figure 4)

  • 713 caused by misconfigured RPKI Max Length.
  • 39,968 caused by too-specific IRR record.

Figure 4. IRR record with inconsistent max length: the IRR prefix length exceeds the RPKI max length value.


Inconsistent ASN (Figure 5)

  • 4,464 caused by customer network failing to remove RADB records after returning address space to provider network.

Figure 5. IRR record with inconsistent ASN: the IRR record ASN differs from the RPKI record ASN.


To Improve IRR accuracy


Although RPKI is becoming more widely deployed, we do not see a decrease in IRR usage, and therefore we should improve the accuracy of information in the IRR. We suggest that networks keep their IRR information up to date and IRR database providers implement policies that promote good IRR hygiene.

Networks currently using IRR for route filtering can avoid the negative impact of inaccurate IRR information by using IRRd version 4, which validates IRR information against RPKI, to ignore incorrect IRR records.

Response to NSTC's JCORE

A year ago January 2020, k claffy, CAIDA Director and UCSD Adjunct Professor of Computer Science and Engineering responded with collaborator David Clark, Senior Scientist at MIT's Computer Science and Artificial Intelligence Laboratory to the Request for Information (RFI) put out by the National Science and Technology Council's (NSTC) Joint Committee on the Research Environment (JCORE). The response establishes the critical importance of the internet to the infrastructure of society and the need for governments, and specifically the U.S. government, to send a strong signal to the private sector through high-level policy making that the only path to understanding the characteristics of the internet comes via data sharing and that responsible sharing of data for documented scientific research will not generate corporate liability.

Another focus and benefit to the policy for which we call comes with the development and delivery of academic training of professionals to work with large data sets focused on communications and networking.

You can see the complete response and more related material posted in CAIDA resource catalog.

Guiding principles for a "Bureau of Cyber Statistics"

The recent Cyberspace Solarium Commission report (1) set out a strategic plan to improve the security of cyberspace. Among its many recommendations is that the government establish a Bureau of Cyber Statistics, to provide the government with the information that it needs for informed planning and action. A recent report from the Aspen Institute echoed this call. (2) Legal academics and lobbyists have already started to consider its structure. (3) The Internet measurement community needs to join this conversation.

The Solarium report proposed some specific characteristics: they recommend a bureau located in the Department of Commerce, and funded and authorized to gather necessary data. The report also says that “the center should be funded and equipped to host academics as well as private sector and independent security researchers as a part of extended exchanges”. We appreciate that the report acknowledges the value of academic researchers and that this objective requires careful thought to achieve. The report specifically mentions “purchasing private or proprietary data repositories”. Will “extended exchanges” act as the only pattern of access, where an academic would work under a Non-Disclosure Agreement (NDA), unable to publish results that relied on proprietary data? Would this allow graduate students to participate, i.e., how would they publish a thesis? The proposal does not indicate deep understanding of how academic research works. As an illustrative example, CAIDA/UCSD and MIT were hired by AT&T as “independent measurement experts” to propose and oversee methods for AT&T to satisfy FCC reporting requirements imposed as a merger condition. (4) AT&T covered all the data we received by an NDA, and we were not able to publish any details about what we learned. This sort of work does not qualify as academic research. It is consulting.

In our view, the bureau must be organized in such a way that academics are able and incentivized to utilize the resources of the bureau for research on questions that motivate the creation of the bureau in the first place. But this requires that when the U.S. government establishes the bureau, it makes apparent the value of academic participation and the modes of operation that will allow it.

These reports focus on cybersecurity, and indeed, security is the most prominent national challenge of the Internet. But the government needs to understand many other issues related to the character of the Internet ecosystem, many of which are inextricably related to security. We cannot secure what we do not understand, and we cannot understand what we do not measure. Measurement of the Internet raises epistemological challenges that span many disciplines, from network engineering and computer science to economics, sociology, ethics, law, and public policy. The following guiding principles can help accommodate these challenges, and the sometimes conflicting incentives across academic, government, commercial, and civic stakeholders.

  1. Incentivize academic participation. A national infrastructure must be organized in such a way that academics are able and incentivized to utilize its resources. This requires designing and implementing modes of operation that will incentivize independent researcher participation.
  2. Demonstrate innovation and value through real projects that address national-scale problems with data-intensive science and engineering research. To justify substantial U.S. government investment in cyberinfrastructure, the research community must demonstrate its value as an independent voice with important results that help to inform the future of the Internet. This demonstration will not be effective if it is hypothetical. Real projects are tricky, because the data does not necessarily exist yet, and if it does, may be proprietary. So researchers must overcome the chicken-and-egg problem of how to demonstrate the value of an independent research community before the Bureau exists.
  3. Start with public data and shared community infrastructure. The starting point must be to work with public data, and translate research results into forms that are meaningful to a constituency broader than the research community. But this path reveals more specific barriers: Who would fund such research? What are the incentives of the academic research community to undertake it? Yet if we do not recognize and overcome this challenge, the independent research community may essentially be written out of the story, as more and more data is proprietary and hidden away.
  4. Make specific and concrete calls for data of national importance. In our view, the community needs a focal point for discussion about collection and use of data, presenting an opportunity and responsibility to transform abstract calls for access to data into more specific and concrete articulations.
  5. Prioritize framework for research access to proprietary data. Sharing of proprietary data must address the reasons that data is considered proprietary. Understanding these reasons is required to design approaches to allow reasonable access for research purposes.
  6. Integrate focus on and metrics to evaluate workforce training efforts. The other risk of continuing on the current path, rather than confronting the data access problem, is the lost opportunity to train students to interpret complex operational data about Internet infrastructure, which is crucial to developing a globally competitive U.S. cybersecurity workforce capable of securing Internet infrastructure.

Other parts of the globe have moved to regularize cybersecurity data, and they have explicitly recognized the importance of engaging and sustaining the academic research establishment in developing cybersecurity tools to secure network infrastructure (5). If the U.S. does not take coherent steps to support its research community, there is a risk that it is sidelined in shaping the future of the Internet. The European Union's proposed regulation for Digital Services (6) also discussed the importance of ensuring access to proprietary data by the academic research community:

Investigations by researchers on the evolution and severity of online systemic risks are particularly important for bridging information asymmetries and establishing a resilient system of risk mitigation, informing online platforms, Digital Services Coordinators, other competent authorities, the Commission and the public. This Regulation therefore provides a framework for compelling access to data from very large online platforms to vetted researchers.

They clarify what they mean by ``vetted researchers'':

In order to be vetted, researchers shall be affiliated with academic institutions, be independent from commercial interests, have proven records of expertise in the fields related to the risks investigated or related research methodologies, and shall commit and be in a capacity to preserve the specific data security and confidentiality requirements corresponding to each request.

This regulation emphasizes a structure that allows the academic community to work with proprietary data, sending an important signal that they intend to make their academic research establishment a recognized part of shaping the future of the Internet in the EU. The U.S. needs to take a similar proactive stance.


References

  1. Cyberspace Solarium Commission report
  2. The Aspen Institute: A National Cybersecurity Agenda for Digital Infrastructure
  3. Lawfare: Considerations for the Structure of the Bureau of Cyber Statistics
  4. CAIDA: First Amended Report of AT&T Independent Measurement Expert: Reporting requirements and measurement methods CAIDA: Report of AT&T Independent Measurement Expert Background and supporting arguments for measurement and reporting requirements
  5. DIRECTIVE OF THE EUROPEAN PARLIAMENT AND OF THE COUNCIL on measures for a high common level of cybersecurity across the Union, repealing Directive (EU) 2016/1148
  6. Regulation of the European Parliament and of the Council on a Single Market For Digital Services

Unintended consequences of submarine cable deployment on Internet routing

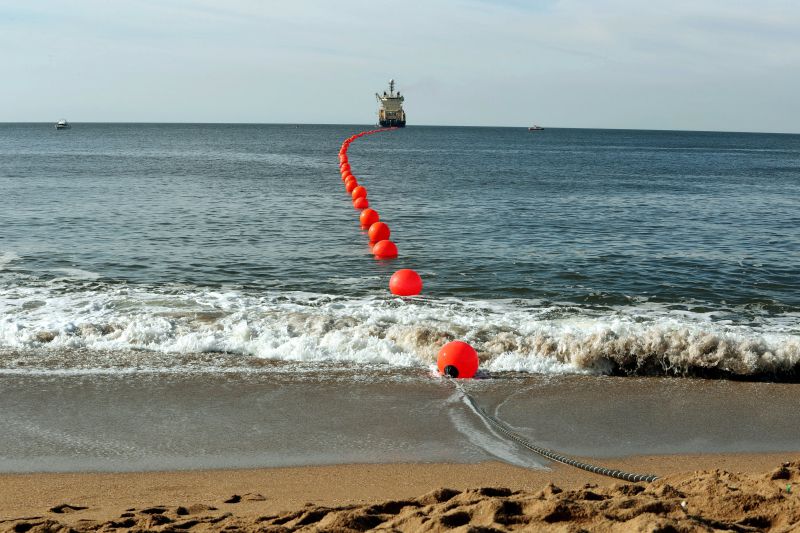
Figure 1: This picture shows a line of floating buoys that designate the path of the long-awaited SACS (South-Atlantic Cable System). This submarine cable now connects Angola to Brazil (Source: G Massala, https://www.menosfios.com/en/finally-cable-submarine-sacs-arrived-to-brazil/, Feb 2018.)

The network layer of the Internet routes packets regardless of the underlying communication media (Wifi, cellular telephony, satellites, or optical fiber). The underlying physical infrastructure of the Internet includes a mesh of submarine cables, generally shared by network operators who purchase capacity from the cable owners [2,11]. As of late 2020, over 400 submarine cables interconnect continents worldwide and constitute the oceanic backbone of the Internet. Although they carry more than 99% of international traffic, little academic research has occurred to isolate end-to-end performance changes induced by their launch.

In mid-September 2018, Angola Cables (AC, AS37468) activated the SACS cable, the first trans-Atlantic cable traversing the Southern hemisphere [1][A1]. SACS connects Angola in Africa to Brazil in South America. Most assume that the deployment of undersea cables between continents improves Internet performance between the two continents. In our paper, “Unintended consequences: Effects of submarine cable deployment on Internet routing”, we shed empirical light on this hypothesis, by investigating the operational impact of SACS on Internet routing. We presented our results at the Passive and Active Measurement Conference (PAM) 2020, where the work received the best paper award [11,7,8]. We summarize the contributions of our study, including our methodology, data collection and key findings.

[A1]  Note that in the same year, Camtel (CM, AS15964), the incumbent operator of Cameroon, and China Unicom (CH, AS9800) deployed the 5,900km South Atlantic Inter Link (SAIL), which links Fortaleza to Kribi (Cameroon) [17], but this cable was not yet lit as of March 2020.

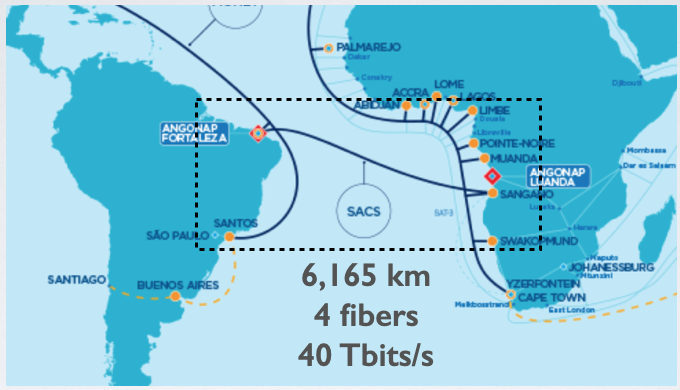
Figure 2: This image shows the Angola Cables Network, which includes the SACS cable (Source: Angola Cable, https://www.angolacables.co.ao/en/network-map/, 2019).

Methodology:

Our methodology quantifies the end-to-end communication performance induced by a new submarine cable deployment on Internet paths. Our approach relies on existing subsea maps/databases [17] and public measurement infrastructures [3, 13]. Our method has four steps:

  • Collect candidate IP paths that could have crossed the cable
  • Identify router IP interfaces on both sides of the cable based on those candidate IP paths
  • Search for corresponding paths (between same pairs of endpoints) in historical traceroute datasets
  • Annotate collected paths with necessary information for analysis such as hostnames, ASes, IP geolocations, and round-trip time (RTTs) differences between consecutive hops

Consider a newly deployed subsea cable C of length l. To accurately identify IPs on both sides of C, we need samples of IP paths crossing the cable in both directions. Our first step involves executing (post-cable launch) traceroutes between monitors located within two networks, denoted AS1 and AS2, that are topologically close to the respective sides of C. The output of these measurements is a set of candidate IP paths containing IP addresses of routers traversed by packets from AS1 to AS2 or vice-versa via C as well as the round-trip times (RTTs) from the respective source IP addresses to each of them. We selected the networks hosting vantage points - VPs - (i.e. AS1, AS2) as well as the functional VPs within those networks using existing measurement platforms [3,13] and publicly available sea cable databases/maps [17].

Our second step involves determining the IP interfaces on respective sides of C within the collected candidate IP paths. Using the speed of light constraint and the known length of C, we deduced the minimum RTT to cross the considered cable by computing RTTmin using equation (a): RTTmin=(2×l)/((2⁄3)×c) where c is the speed of light in a vacuum [W1]. Further, we singled out from the candidate IP paths any pair of IP addresses IPA-IPB for which the difference between the respective round trips to the source IP address of the considered traceroute is greater or equal than the threshold RTTmin. We looked for cases where the countries of those IP interfaces, according to geolocation databases [12] (such as Netacuity [10] and Maxmind [9]), match the countries linked by the new subsea cable. Then, we inferred IPA and IPB from the potential IPs on each side of C. We looked for the router aliases of those IPs.

Third, we fetched from existing measurement platforms RIPE Atlas [R1] and CAIDA Ark [C1], historical traceroutes containing any pairs IPA-IPB or IPB-IPA, which we grouped into a set T’<s,d>. We then identified the source IP and the destination network (<s,d>) for which we collected available historical traceroutes T<s,d>. We annotated these IP paths with hostnames, Autonomous Systems (ASes), country, and RTT difference between consecutive hops.

Finally, we used three metrics to evaluate end-to-end performance and AS paths pre and post-cable launch:

  • The RTTs to the common IP hops closest to the traceroute destinations quantify the time packets traveled from a source interface to a common point close to a given destination network measured pre and post cable launch.
  • The AS-centrality of transit ASes represents the percentage of paths for which an AS plays the role of transit.
  • The length of AS paths crossing the studied cable operator’s network pre and post-event.

Data collection:

We used CAIDA’s Ark (100+ monitors) [3] and RIPE Atlas (11,000+ monitors) [13] measurement platforms as the sources of historical traceroutes. We extracted router aliases information from CAIDA’s Macroscopic Internet Topology Dataset Kit (ITDK), IXP information from CAIDA’s Internet eXchange Point Dataset [3], and translated IPs to hostnames with qr and zdns. We used IP geolocation databases Netacuity [10] and Maxmind [9] combined with hostname geolocation to map IPs to countries.

Findings/Results:

Comparing RTTs before and After SACS

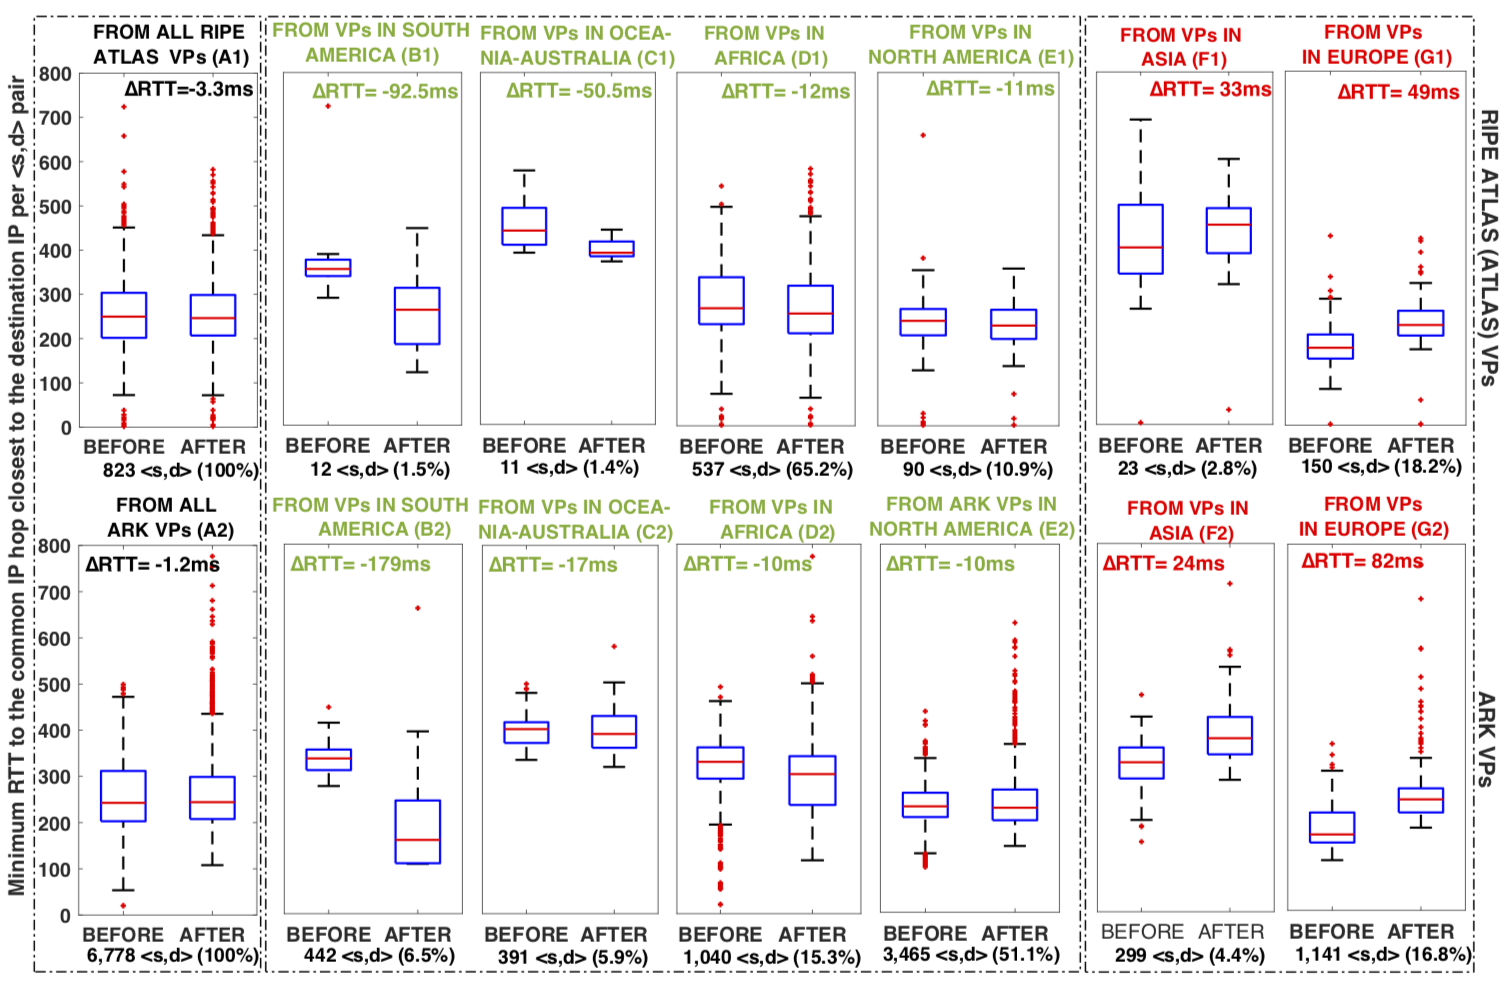
We started our analysis by comparing RTTs before and after SACS deployment. For the same source VP and destination prefix, we built the set of common IP hops in the traces before and after SACS, and selected the IP closest to the destination IPc as a point of comparison. Using the RTTs from VPs toward IP hop IPc from the traces pre- and post-SACS, we plotted the boxplots of Figure 3, clustering RTTs by continent and measurement platform.

Figure 3: Boxplots of minimum RTTs from Ark and Atlas VPs to the common IP hops closest to the destination IPs. The red line of every boxplot represents the median of these minimum RTTs; we marked the 75th and 25th percentile as well as the Interquartile range IQR.

Overall, our results show that SACS had little impact on latencies from all vantage points (VPs) to all destination prefixes. Interestingly, paths from South America experienced a median decrease of 38%, which was quite significant compared to paths from Oceania – Australia (8% decrease), and to paths from Africa (3%). At the country-level, we found predictable performance improvements (RTT decrease) for paths going from Africa to Brazil, or from South America to Angola. However, we found an asymmetrical RTT reduction: the decrease of the median RTT from Africa to Brazil (73ms) was a third of that from South America to Angola (226ms). We also noted some unpredicted and unreported performance degradations e.g., we saw packets suboptimally routed through SACS for paths going from North America to Brazil or Africa/Europe to Angola, leading to latency increases.

Comparing Transit Structure

We computed per AS the percentage of observed <s,d> pairs for which the AS path with the minimum observed RTT contained the considered AS. 

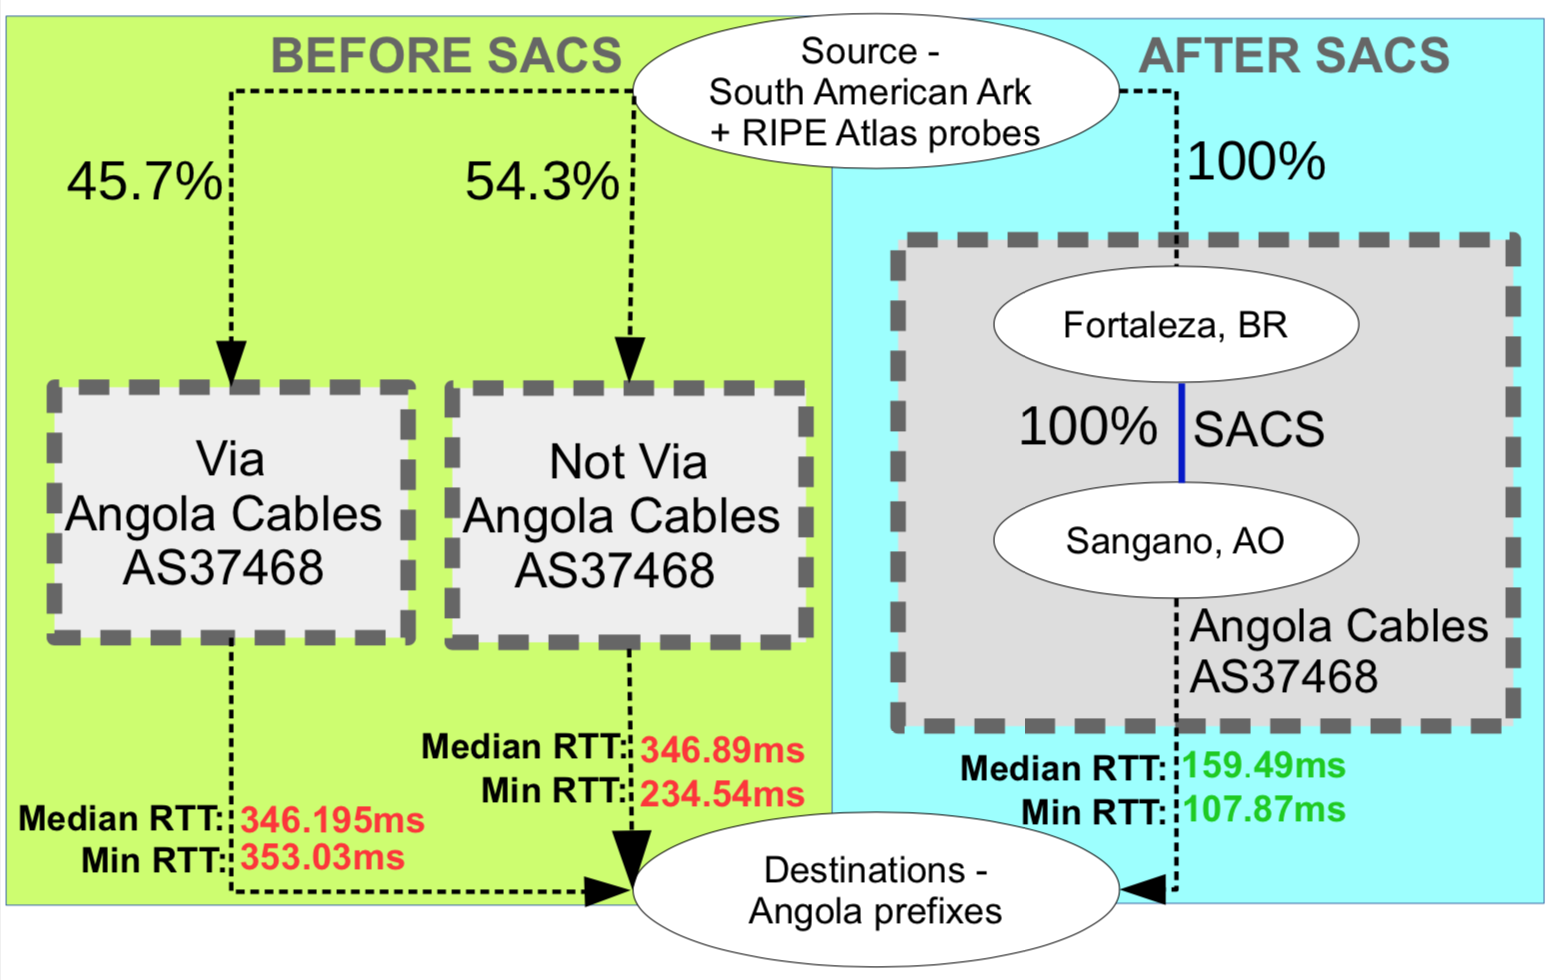
Figure 4: Partial AS paths from South America to Angola (Observed RTT improvements)     BEFORE AFTER

AS-centrality

(AS37468)

46% 100%
Median RTT of IP paths via AS37468 346ms 159ms
Min RTT of IP paths via AS37468 353ms 108ms

Figure 4 depicts the impact of SACS deployment on transit ASes serving observed paths from South America to Angola (RTT improvement). The ovals inside Angola Cables are part of traceroutes post-SACS that we manually geolocated using hints in hostnames. Before SACS, 46% of observed <s,d> pairs crossed Europe and then Angola via AC’s network. SACS provided a more direct path between these two continents and improved performance. As a consequence, the median RTT between VPs and IPs on IP paths via AS37468 decreased from 346ms to 159ms
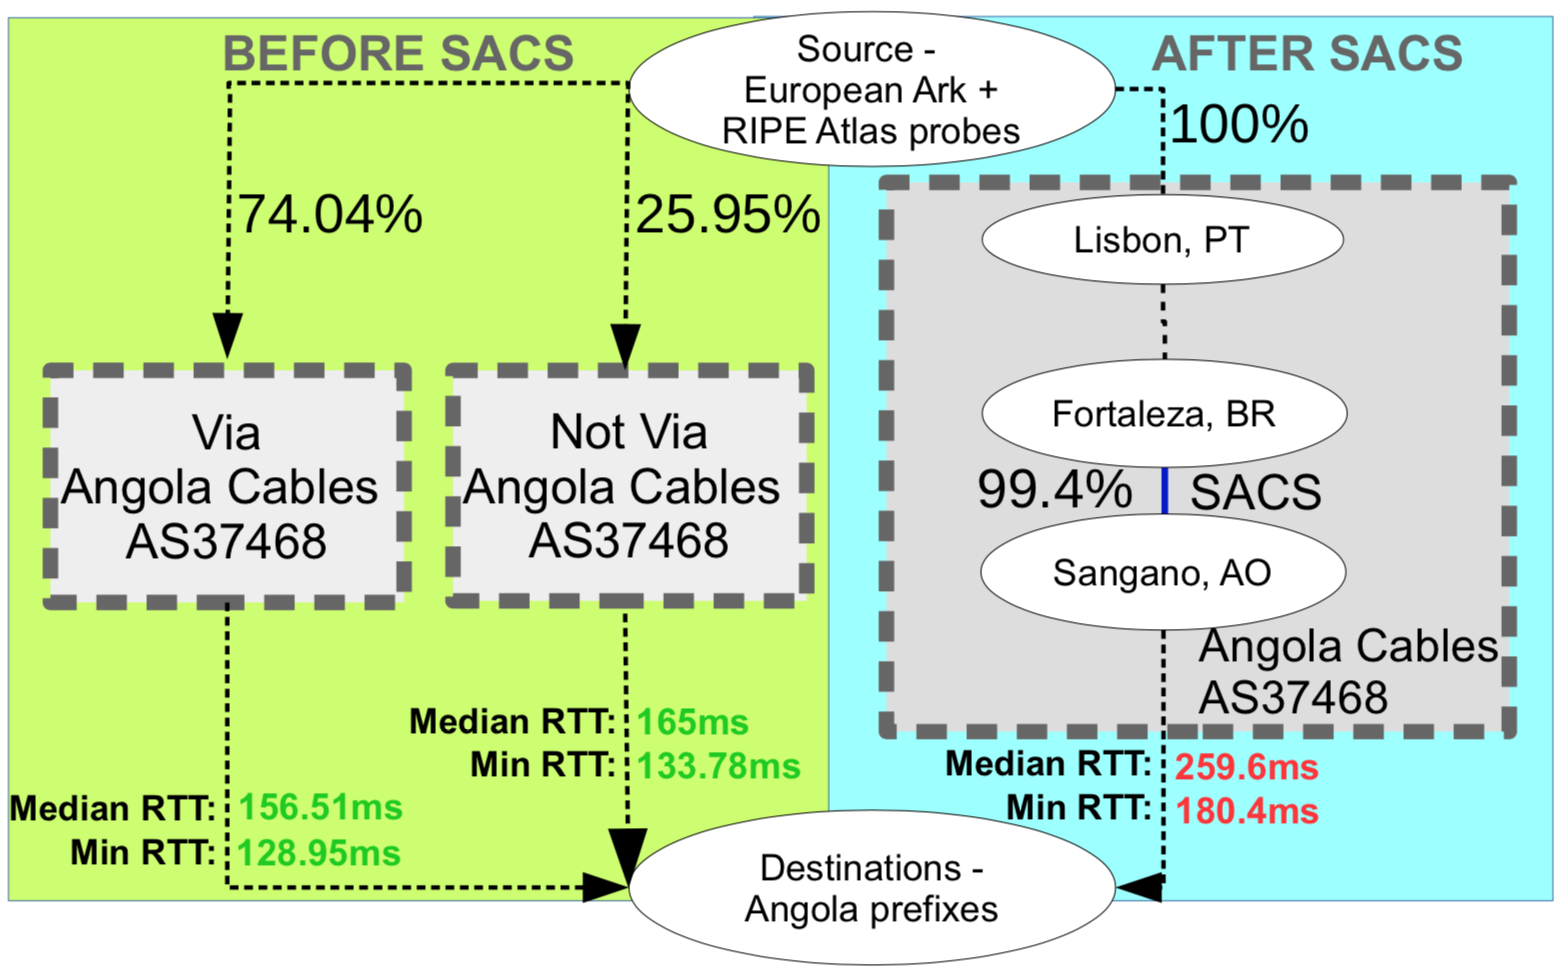
Figure 5: Partial AS paths from Europe to Angola (Observed RTT degradation)     BEFORE AFTER
AS-centrality (AS37468) 74% 100%
Median RTT of IP paths via AS37468 156ms 259ms
Min RTT of IP paths via AS37468 128ms 180ms
     

We then considered partial paths between Europe and Angola, cases in which we observed an RTT degradation from the collected traceroutes. Note that AC was the major transit provider for traffic from Europe to Angola throughout the entire period of the study. However, the use of SACS within AC significantly lengthened the physical path and thus the latency on the forward path. As a consequence, the median RTT on IP paths crossing AS37468 increased from 156ms to 259ms.

We provide more detail on our in-depth inspection of the paths pre and post-SACS in the paper [7].

Contributions and key findings:

The key contributions of this study can be listed as follows:

  • We introduced a reproducible method to investigate the impact of a cable deployment on macroscopic Internet topology and performance.
  • We applied our methodology to the case of SACS, the first trans-Atlantic cable from South America to Africa. We discovered that the RTT decrease for IP paths going from Africa to Brazil was roughly a third of that noticed on paths from South America to Angola. Further, we discovered surprising performance degradations to/from some regions and analyzed the root-causes of these unintended consequences.
  • We suggested ways to avoid suboptimal routing post-activation of cables in the future.
  • Finally, we published our code and data to facilitate reproducibility [8].

References:

[1] Angola Cables: SACS. https://sacs.angolacables.co.ao, Jan 2020

[2] Bischof, Z.S., Fontugne, R., Bustamante, F.E.: Submarine Cables and Internet Resiliency. https://www.iij.ad.jp/en/dev/iir/pdf/iir_vol41_ focus2_EN.pdf (2018)

[3] CAIDA: Archipelago (Ark) Measurement Infrastructure. https://www.caida.org/projects/ark/, Jan 2020

[4] CAIDA website. http://www.caida.org, Jan 2020

[5] CAIDA, Presentation, video, and PDF of the paper: https://www.caida.org/publications/papers/2020/unintended_consequences/, March 2020

[6] Digital Element: Netacuity. http://www.digital-element.net/ip_ intelligence/ip_intelligence.html, Jan 2020.

[7] Fanou, R., Huffaker, B., Mok, R. and Claffy, K.C. Unintended Consequences: Effects of Submarine Cable Deployment on Internet Routing. In International Conference on Passive and Active Network Measurement (pp. 211-227). Springer, March 2020.

[8] Fanou, R., Huffaker, B., Mok, R. and Claffy, K.C., Github repository of the paper "Unintended consequences: Effects of submarine cable deployment on Internet routing", https://github.com/CAIDA/submarine-cable-impact-analysis-public, March 2020.

[9] MaxMind: GeoIP. https://dev.maxmind.com/geoip/geoip2/geoip2-city-country-csv-databases/, Aug 2019.

[10] Digital Element: Netacuity. http://www.digital-element.net/ip_ intelligence/ip_intelligence.html, Jan 2020.

[11] Phil, E.: A Map of all the Underwater Cables that Connect the Internet. https://www.vox.com/2015/3/13/8204655/submarine-cables-internet, Nov 2015.

[12] Poese, I., Uhlig, S., Kaafar, M.A., Donnet, B., Gueye, B.: IP Geolocation Databases: Unreliable? ACM SIGCOMM Computer Communication Review 4(2), 53–56 (2011)

[13] RIPE NCC: Global RIPE Atlas Network Coverage. https://atlas.ripe.net/results/maps/network-coverage/, Jan 2020

[14] Submarine Cable Networks. https://www.submarinenetworks.com/en/, Jan 2020

[15] Subsea World News. https://subseaworldnews.com, Jan 2020

[16] Telegeography: Submarine Cable Frequently Asked Questions,  https://www2.telegeography.com/submarine-cable-faqs-frequently-asked-questions, Dec 2020

[17] Telegeography: Telegeography Submarine Cable Map. https://www.submarinecablemap.com/, Jan 2020

[18] Wikipedia: Speed of light, https://en.wikipedia.org/wiki/Speed_of_light, 2020

CAIDA Resource Catalog

One of CAIDA's primary missions has been to improve our understanding of the Internet infrastructure, through data-driven science. To this end, CAIDA has collected and maintains one of the largest collections of Internet-related data sets in the world, and developed tools and services to curate and process that data. Along with this success has come the challenge of helping new students and researchers to find and use that rich archive of resources.

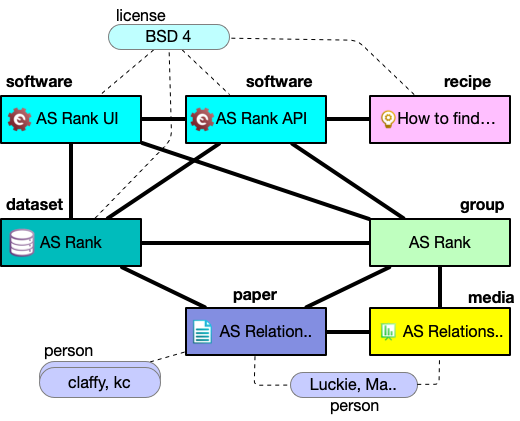
As part of our NSF-funded DIBBS project, CAIDA has developed a rich context resource catalog, served at catalog.caida.org. The goal of the catalog is to help both newcomers and experienced users with data discovery, and reducing the time between finding the data and extracting knowledge and insights from it.

In addition to linking datasets to related papers and presentations, the catalog will also link to code snippets, user-provided notes, and recipes for performing commons analytical tasks with the data.

The catalog can be found at: https://catalog.caida.org

Please explore and provide feedback!

Spoofer Surpasses One Million Sessions and Publishes Final Report

On October 10, 2020 the Spoofer system logged its 1,000,000th measurement session. Finishing its 7th year under CAIDA stewardship, the project recently published its final report documenting the improvements to the software and hardware infrastructure made possible by support from the two-year DHS award "ASPIRE - Augment Spoofer Project to Improve Remediation Efforts" co-led by Matthew Luckie of the University of Waikato's faculty of Computing and Mathematical Sciences. The report describes (1) updates to the open source client-server source address validation (SAV) testing system (developed under DHS S&T contract D15PC00188) to expand visibility of networks behind Network Address Translation devices (NATs); (2) expanded notifications and reporting through our operator-focused private reporting engine and public regionally-focused notifications to operational mailing lists; (3) several publications documenting analysis of the effectiveness of different approaches to stimulating remediation activities [1, 2, 3]. These tasks achieved testing and evaluation of work developed under the previous contract, and analysis of options for technology transition to a broader cross-section of security research, operations, risk management, and public policy stakeholders. The resulting technologies and data improved the U.S. government’s ability to identify, monitor, and mitigate the infrastructure vulnerability that serves as the primary vector of massive DDoS attacks on the Internet.

Excerpted from the ASPIRE final report:

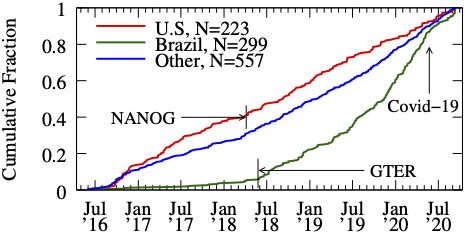
Of the 587 remediation events we inferred between May 2016 and August 2019, 25.2% occurred in the U.S., and 23.5% occurred in Brazil. Figure 8 shows that nearly 90% of the remediation events in Brazil occurred after we began sending monthly emails to the Brazilian operator email list (GTER). We calculate the remediation rate by dividing the number of ASes for which we inferred a remediation event by the total number of ASes that sent a spoofed packet during the same interval. For the year prior to commencing the GTER emails to Brazilian network operators, 14 of 67 ASes (21%) remediated; in the year after, 52 of 168 ASes (31%) remediated. This improvement is supported by NIC.br’s “Program for a Safer Internet” [37], which offers training courses and lectures to support network operators to deploy security best practices in Brazil. The rate of remediation in the U.S. is lower; prior to sending the NANOG emails to U.S. network operators, 21 of 132 (16%) of ASes remediated; in the year after, 35 of 147 (24%) of ASes remediated. While the rate of remediation is lower in the U.S. than Brazil, the relative improvement in both is equivalent –≈50%. Note that remediation in Brazil has slowed since the outbreak of Covid-19 in Brazil.

Figure 8: Remediation in the U.S. and Brazil.

We hope you will take the time to read the full final report, download the client software and test your network to help us better understand the state of IP spoofing.

References:

1. M. Luckie, R. Beverly, R. Koga, K. Keys, J. Kroll, and k. claffy, "Network Hygiene, Incentives, and Regulation: Deployment of Source Address Validation in the Internet", in ACM Computer and Communications Security (CCS), Nov 2019.

2. L. Müller, M. Luckie, B. Huffaker, k. claffy, and M. Barcellos, "Challenges in Inferring Spoofed Traffic at IXPs", in ACM SIGCOMM Conference on emerging Networking EXperiments and Technologies (CoNEXT), Dec 2019.

3. L. Müller, M. Luckie, B. Huffaker, k. claffy, and M. Barcellos, "Spoofed traffic inference at IXPs: Challenges, methods and analysis", Computer Networks, vol. 182, Aug 2020.

IPv4 History Visualization

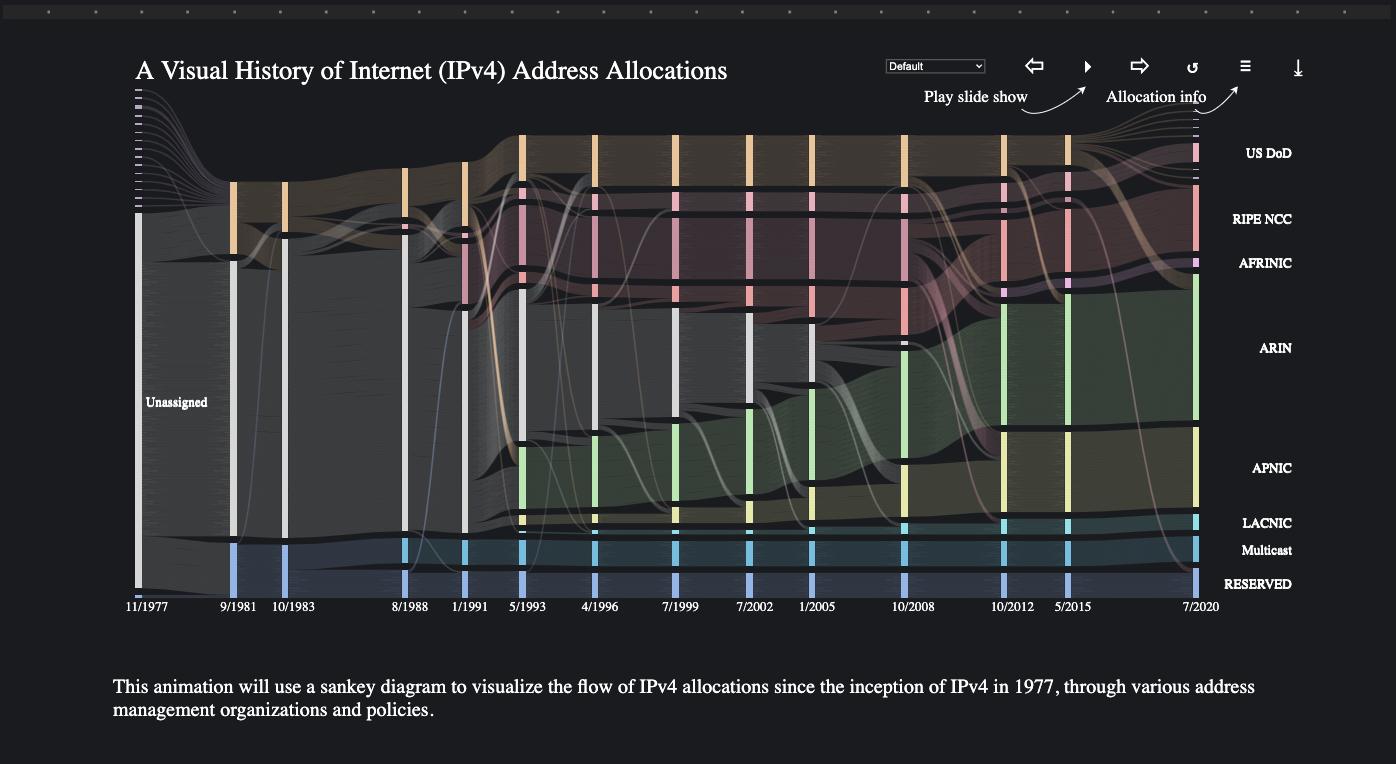
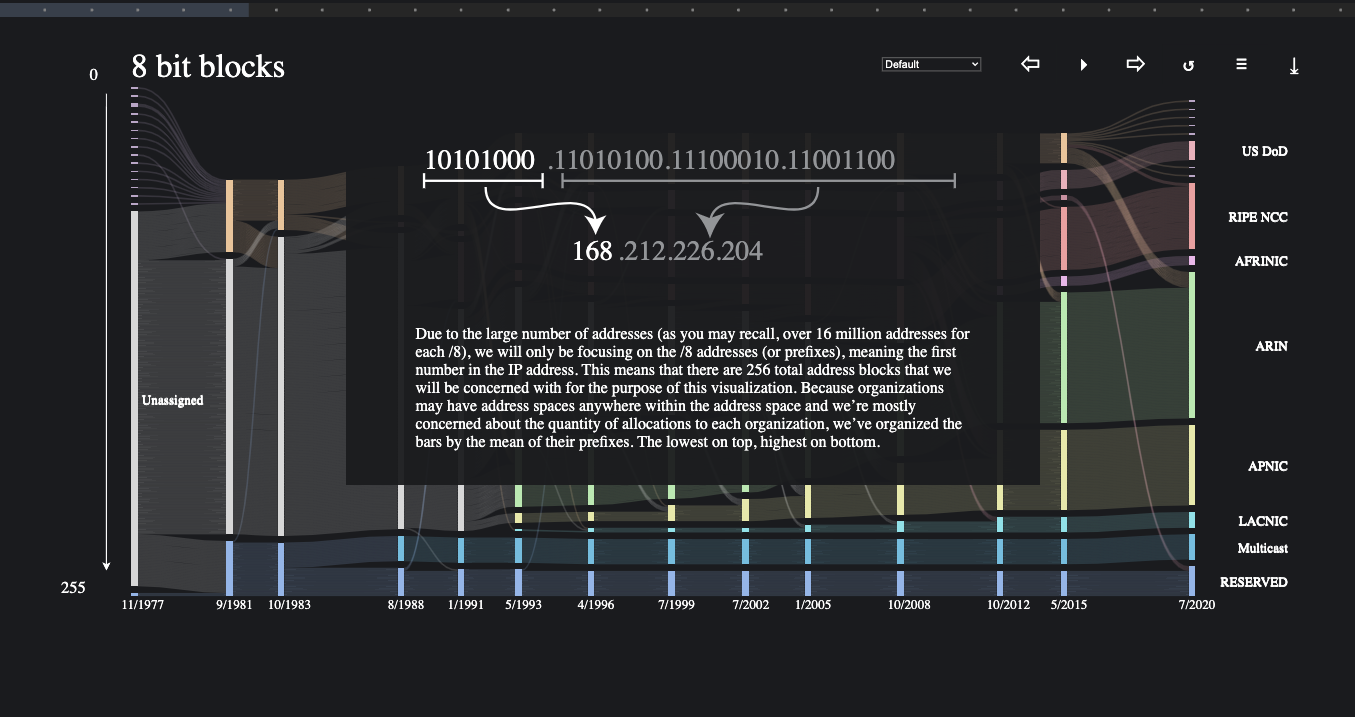
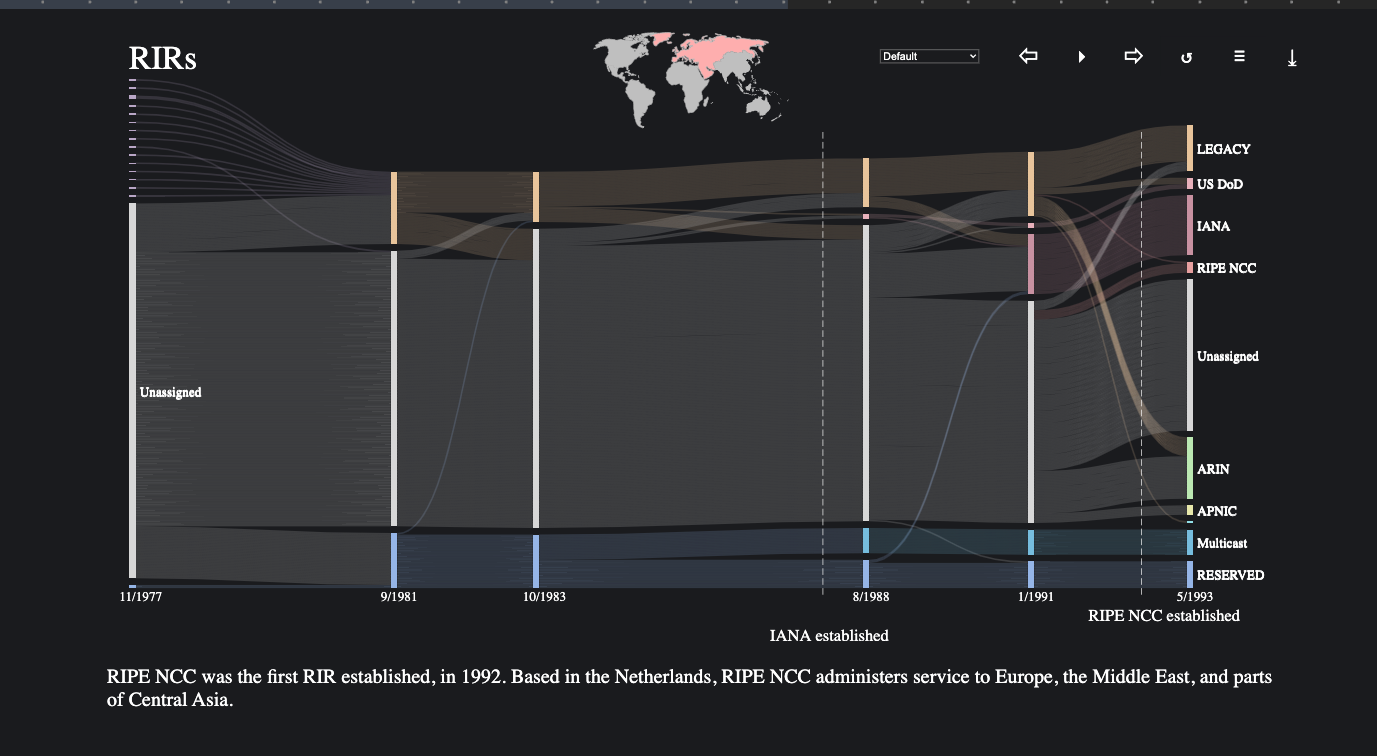
This visualization shows how the growing demand for those addresses transformed the governance model from a handful of scientists and engineers managing these addresses to the multi-stakeholder governance model we have today. IPv4 (the fourth version of the Internet Protocol) is the governing standard of today's Internet. Similar to any other network, unique identifiers play an integral role in Internet routing. We group IP address blocks based on the organization that regulates its allocation as recorded in IANA's IPv4 address space file and the RFC.

Please view the visualization at: https://www.caida.org/publications/visualizations/ipv4-history/

Screenshots of the visualization


This was created with the support of the National Science Foundation (NSF). For any questions or comments on this project, please contact info@caida.org.

CAIDA's Annual Report for 2019

The CAIDA annual report summarizes CAIDA's activities for 2019, in the areas of research, infrastructure, data collection and analysis. Our research projects span Internet mapping, performance measurement, security, economics, and policy. Our infrastructure, software development, and data sharing activities support measurement-based internet research, both at CAIDA and around the world, with focus on the health and integrity of the global Internet ecosystem. The executive summary is excerpted below:

This annual report summarizes CAIDA's activities for 2019 in the areas of research, infrastructure, data collection and analysis. Our research projects span Internet cartography, security and stability studies (of outages, performance, and vulnerabilities), economics, and policy. Our infrastructure, software development, and data sharing activities support measurement-based internet research, both at CAIDA and around the world, with focus on the health and integrity of the global Internet ecosystem.

Internet Mapping and Performance Measurement. We completed a study tracking IPv6 deployment over the last several decades, outlined open challenges in geolocation of BGP prefixes, and began to consider new approaches to inferring anycast prefixes. Our performance studies focused on mobile application performance, including one on the application of reinforcement learning to reconfigure edge networks to improve video streaming performance over wireless networks. We also continued development of our QUINCE system for correlating crowdsourced QOE measurement assessments with observed network performance across the same paths.

Monitoring Global Internet Security and Stability. We published several studies on outage detection, including the intentional use of DoS attacks to disrupt connectivity as a political act. We developed new methodologies for studying BGP hijacks, and in collaboration with MIT, published a study characterizing the behavior of "serial" BGP hijackers, providing insights about BGP hijacking events detected in the wild. We began a new project in collaboration with Dutch colleagues (co-funded by U.S. and Dutch governments) on mapping DNS-related DDoS vulnerabilities to improve protection of this vital core Internet infrastructure. We also continued our study of the state of source address validation (to prevent spoofed source attacks), including developing new methods to use IXP traffic data to expand visibility of compliance with source address validation best practices. We published our most important work thus far on the prospect of remediating this fundamental architectural vulnerability: a comprehensive analysis of deployment and characteristics of IP source address validation on the Internet since 2005, including an analysis of approaches taken to encouraging remediation and the challenges of evaluating their impact.

Economics and Policy. We published a series of instructional videos on Internet public policy topics, such as reasonable network management and network neutrality. We also published a preliminary although hopefully comprehensive annotated taxonomy of harms that arise in the Internet ecosystem, hoping to advance the rigor of conversations in today's hectic and reactive Internet policy environment. In the same conference, we expanded on previous work describing the implications for regulation when platforms embed a layered communications architecture. Finally, our contribution to science policy this year: we developed a set of recommendations that the Internet scientific research community can undertake to initiate a cultural change toward reproducibility of our work.

Infrastructure Operations. We operate active and passive measurement infrastructure to provide visibility into global Internet behavior, and associated software tools that facilitate network research and security and stability analysis for the community. We continued to support the IODA platform for outage detection, and the underlying Network Telescope that serves as a data source to this platform. With accessibility as a goal, we are creating APIs to access many of our data services. With sustainability as a goal, we are migrating our data processing platforms to an OpenStack environment with a Swift storage back end. We tried to maintain the Ark active measurement infrastructure, and MANIC congestion measurement system although both ran out of funding this year. Unfortunately, we lost our backbone traffic monitor in January 2019 when the link upgraded to 100 GB, leaving our 10GB hardware incapable of capturing traces. This is our most popular data set by far in the research community; we will try to recover this capability in 2020, resources permitting.

New Projects. We began three new projects this year. The first is a collaboration with NPS to rigorously investigate, develop, and evaluate new strategies for large-scale IPv6 active mapping. This effort will include measurement strategies that can amplify topology measurement coverage by orders of magnitude; innovations in IPv6-specific algorithms to infer router-level topologies; and analysis and remediation of security and privacy risks that our measurements reveal. The second new project will develop a platform to enable discovery of the full potential value of massive raw Internet end-to-end path measurement (traceroute) data sets. Finally, we began Phase I of a project under NSF's new Convergence Accelerator program to explore the feasibility of codifying an Open Knowledge Network (OKN) about properties of the Internet identifier system - the domain names and addresses that represent communication entities - and the rich structural relationships among these entities. We will have more to report on these projects in 2020. The proposals for all of our funded projects are available on our web site.

We engaged in a variety of tool development, data sharing, and outreach activities, including maintaining web sites, publishing 18 peer-reviewed papers, 2 workshop reports, 35 presentations, 6 blog entries. This report summarizes the status of our activities; details about our research are available in papers, presentations, and interactive resources on our web sites. We provide listings and links to software tools and data sets shared, and statistics reflecting their usage. Finally, we offer a "CAIDA in numbers" section: statistics on our performance, financial reporting, and supporting resources, including visiting scholars and students, and all funding sources.
CAIDA's program plan for 2018-2021 is available at at www.caida.org/home/about/progplan/progplan2018/. Please feel free to send comments or questions to info at caida dot org. Please note the link to donate to CAIDA at the top of our web site; UC San Diego charges no overhead on donations; it all is tax-deductible and goes 100% to research!

For the full 2019 annual report, see https://www.caida.org/home/about/annualreports/2019/

AS Rank v2.1 Released (RESTFUL/Historical/Cone)

ASRankv2.1
(GraphQL/RESTFUL)

Responding to feedback from our user community, CAIDA has released version 2.1 of the AS Rank API. This update helps to reduce some of the complexity of the full-featured GraphQL interface through a simplified RESTful API.

AS Rank API version 2.1 adds support for historical queries as well as support for AS Customer Cones, defined as the set of ASes an AS can reach using customer links. You can learn more about AS relationships, customer cones, and how CAIDA sources the data at https://asrank.caida.org/about.

You can find the documentation for AS Rank API version 2.1 here https://api.asrank.caida.org/v2/restful/docs.

You can find documentation detailing how to make use of historical data and customer cones here https://api.asrank.caida.org/v2/docs.

CAIDA Team