

Videos and Animations
Videos and animations produced by CAIDA. Recent video content is published on CAIDA's YouTube channel; historical animations from 1998 to 2012 remain available for download.
See the CAIDA Resource Catalog view for this page to explore related objects.
CAIDA on YouTube
CAIDA publishes new video content — project overviews, tool screencasts, conference talks, and animations — on CAIDA's YouTube channel.
Videos in the CAIDA Catalog
CAIDA videos indexed in the CAIDA Catalog. This list updates automatically as new videos are cataloged.
|
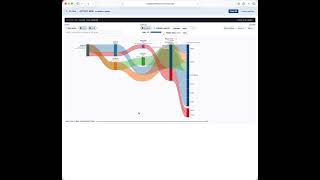
Brief overview of Internet2 ROOTBEER RE Topology Report (Jul 2026): YouTube |
catalog entry Steven Wallace (Internet2) walks through the ROOTBEER RE Topology Report, the tool that visualizes the research and education routing topology converging on Internet2's AS11537. |

|
Arkmon Overview (Dec 2025): YouTube |
catalog entry An overview of how to use Arkmon, CAIDA's web-based management system for Archipelago (Ark) monitors. |
|
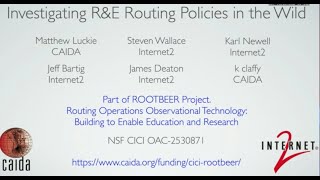
Measuring R&E Routing Policies (Dec 2025): YouTube |
catalog entry Matthew Luckie (CAIDA) presents early results of CAIDA's effort to adapt and integrate recently developed measurement and analysis capabilities to detect route leaks between R&E and commodity (non-R&E) networks. Such leaks, whether from accidental misconfiguration or malicious activity, threaten the availability and integrity of critical R&E network services. Recorded at the Internet2 Technology Exchange, December 2025. |
|
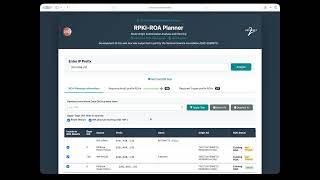
Internet2 & CAIDA RPKI-ROA Planner (Nov 2025): YouTube |
catalog entry Steven Wallace (Internet2) gives background on RPKI Route Origin Authorizations and demonstrates a tool, built with CAIDA, that assists network operators in planning their ROAs. |
|
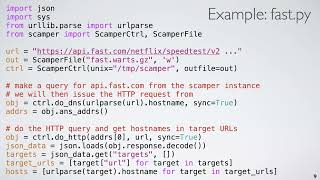
Scamper: A Python-based Active Measurement Domain Specific Language (DSL) (Jan 2024): YouTube |
catalog entry Matthew Luckie presents the Scamper Python module, a domain-specific language for actively probing destinations in the Internet in parallel at a specified packets-per-second rate, so that bulk measurement data can be collected in a timely fashion. |
|
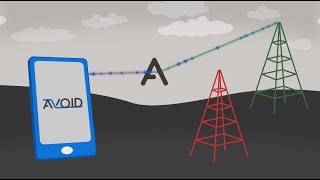
AVOID Project: Automatic Verification of Internet Data-Paths (Dec 2023): YouTube |
catalog entry An introduction to AVOID, which secures 5G against hidden threats in the communications infrastructure. The automated system helps Department of Defense personnel secure 5G communications by avoiding nation-state adversaries and moving communications onto safe paths. |
|
Access Denied: Assessing Physical Risks to Internet Access Networks (Aug 2023): YouTube |
catalog entry USENIX Security '23 talk on Access Denied: Assessing Physical Risks to Internet Access Networks (Marder, Zhang, Mok, Padmanabhan, Huffaker, Luckie, Dainotti, Claffy, Snoeren, Schulman). Regional access networks connect both wireline and mobile users to the Internet, yet long-standing economic and architectural constraints produce points of limited redundancy that leave them exposed to targeted physical attacks resulting in widespread outages. |
|
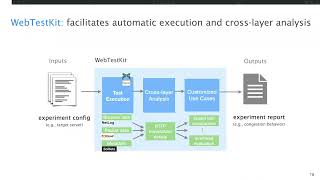
Design and Implementation of Web-based Speed Test Analysis Tool Kit (PAM 2022) (Apr 2022): YouTube | catalog entry |
|
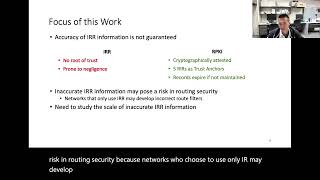
IRR Hygiene in the RPKI Era (Apr 2022): YouTube | catalog entry |
|
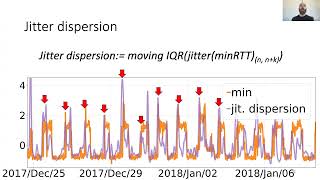
Jitterbug: A new framework for jitter-based congestion inference (PAM 2022) (Apr 2022): YouTube | catalog entry |
|
DynamIPs: Analyzing address assignment practices in IPv4 and IPv6 (Video) (Dec 2020): YouTube | catalog entry |

|
Cloud WAN Peering Around the World (Dec 2020): YouTube |
catalog entry Alexander Marder (CAIDA) presents How Do Clouds Use IXPs? at the Euro-IX Virtual Forum, December 2020, on how the large cloud providers peer at Internet exchange points around the world. |

|
Kismet video: Knowledge of Internet Structure: Measurement, Epistemology, and Technology (Oct 2020): YouTube |
catalog entry We will create a knowledge network that will improve the security and functioning of three key but inherently vulnerable systems that underpin all activity on the Internet: the addressing, routing, and naming systems. Lack of attention to security in early design decisions, persistent disagreement about the best path to improvement, and lowest-cost operational practices surrounding these three layers have allowed malicious actors to execute and scale harmful misbehavior including interception and disruption of traffic, denial of service and phishing attacks, and distribution and execution of malware. |
|
AS Path Prepending: There is No Rose Without a Thorn (Oct 2020): YouTube |
catalog entry Pedro Marcos presents AS Path Prepending: There is No Rose Without a Thorn (Marcos, Prehn, Leal, Dainotti, Feldmann, Barcellos) at NANOG, October 2020. AS path prepending (ASPP) inflates the AS path to steer inbound traffic; this longitudinal study finds ASPP widely deployed and slightly increasing despite public statements against it, with roughly 6k ASes originating prefixes whose prepends achieve no traffic-engineering goal. Active measurements show that ASPP's effectiveness depends on the AS's location and number of upstreams, and confirm its security implications. |

|
IODA's dashboard: Overview and Case Studies (Oct 2020): YouTube |
catalog entry This screencast provides a detailed overview on how to analyze Internet connectivity outages using IODA's Dashboard interface. IODA is short for Internet Outage Detection and Analysis and is a system being developed at CAIDA, a research center at UC San Diego. IODA's Dashboard is a publicly available web interface that allows you to learn about and investigate Internet outages. This screencast presents an overview of IODA, the data sources that IODA uses, and explores several Internet outage case studies, including large-scale outages caused by government-mandated shutdowns that affected Iran and Kashmir in 2019. |
|
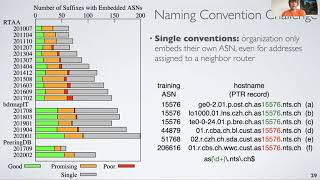
Learning to Extract and Use ASNs in Hostnames (IMC 2020) (Oct 2020): YouTube | catalog entry |

|
MAnycast2 – Using Anycast to Measure Anycast (Oct 2020): YouTube |
catalog entry Raffaele Sommese presents MAnycast2 at ACM IMC 2020 (extended version). Anycast addressing has become a fundamental approach to improving the resilience and performance of Internet services, but its deployment model makes it impossible to infer from an address that it is anycast, and existing detection methods face accuracy challenges from routing and latency dynamics and scalability challenges from measurement load. MAnycast2 probes potential anycast destinations from a distributed platform of anycast vantage points, eliminating sensitivity to latency dynamics and greatly improving efficiency and scalability. |
|
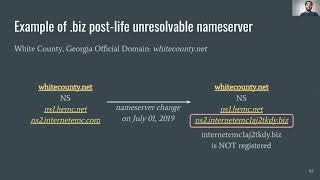
Unresolved Issues: Prevalence, Persistence, and Perils of Lame Delegations (Video) (Oct 2020): YouTube | catalog entry |
|
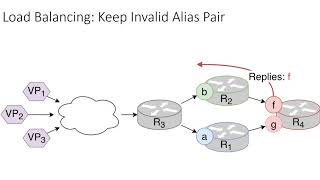
APPLE: Alias Pruning by Path Length Estimation (PAM 2020) (Jun 2020): YouTube | catalog entry |
|
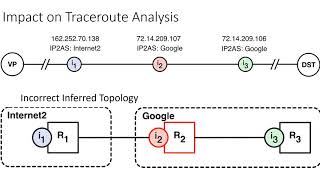
vrfinder: Finding Outbound Addresses in Traceroute (SIGMETRICS 2020) (Jun 2020): YouTube | catalog entry |
|
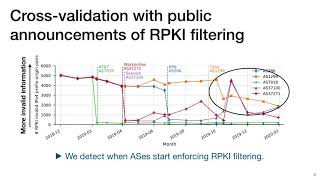
To Filter or not to Filter: Measuring the Benefits of Registering in the RPKI Today (Mar 2020): YouTube |
catalog entry Cecilia Testart presents To Filter or not to Filter: Measuring the Benefits of Registering in the RPKI Today (Testart, Richter, King, Dainotti, Clark) at PAM 2020 (Session 1, Presentation 3). |
|
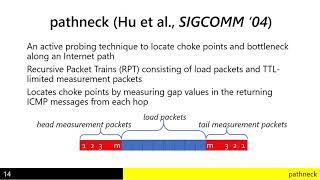
FlowTrace: A Framework for Active Bandwidth Measurements using In-band Packet Trains (Mar 2020): YouTube |
catalog entry Adnan Ahmed presents FlowTrace: A Framework for Active Bandwidth Measurements using In-band Packet Trains (Ahmed, Mok, Shafiq) at PAM 2020 (Session 2, Presentation 3). |
|
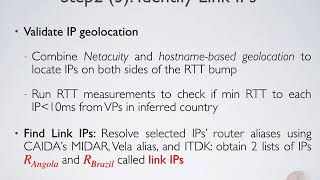
Unintended consequences: Effects of submarine cable deployment on Internet routing (Mar 2020): YouTube |
catalog entry Roderick Fanou presents Unintended consequences: Effects of submarine cable deployment on Internet routing (Fanou, Huffaker, Mok, Claffy), the PAM 2020 Best Paper (Session 3, Presentation 2). The work uses RIPE Atlas and CAIDA Ark traceroute and BGP data to study the impact of a submarine cable launch connecting Africa to South America. |

|
When parents and children disagree: Diving into DNS delegation inconsistency (Mar 2020): YouTube |
catalog entry Raffaele Sommese presents When parents and children disagree: Diving into DNS delegation inconsistency (Sommese, Moura, Jonker, van Rijswijk-Deij, Dainotti, Claffy, Sperotto) at PAM 2020 (Session 4, Presentation 2). |
|
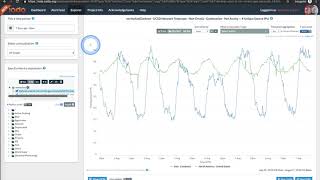
IODA Explorer screencast (Nov 2019): YouTube |
catalog entry This screencast teaches you how to use IODA's Explorer interface. IODA is short for Internet Outage Detection and Analysis and is developed at CAIDA, a research center at UC San Diego. IODA's Explorer allows you to perform power analyses of Internet outages. This screencast presents the components of the Explorer interface and goes on to explain how to manipulate various time series to perform in-depth analyses of Internet outages detected by IODA. |

|
The Net Neutrality Debate (Mar 2019): YouTube |
catalog entry Net Neutrality has become a bit of a political football. We don't have even close to enough data to truly litigate the net neutrality debate in an equitable way. We don't know enough. You need measurement." In this series of short clips, KC Claffy, founder and director of the Center for Applied Internet Data Analysis (CAIDA) at SDSC, brings us up to speed on some of the key issues surrounding the Net Neutrality debate. Watch the video "The Net Neutrality Debate", part of a series on Net Neutrality and Why We Need to Measure the Internet. |

|
IODA Dashboard screencast (Mar 2019): YouTube |
catalog entry This screencast teaches you how to use IODA's Dashboard. IODA is short for Internet Outage Detection and Analysis and is developed at CAIDA, a research center at UC San Diego. IODA's Dashboard allows you to learn about and investigate Internet outages. This screencast will present the data sources that IODA uses, explain the components of its user interface, and discuss how to use IODA effectively. |
|
ARTEMIS: Neutralizing BGP Hijacking within a Minute (Jul 2018): YouTube |
catalog entry Recording of the ANRW 2018 session at IETF 102 (Montreal, 16 July 2018) in which Alberto Dainotti presented ARTEMIS: Neutralizing BGP Hijacking within a Minute. The recording covers the whole ANRW session; the ARTEMIS talk is one presentation within it. |

|
KC Claffy: Measuring the Internet (May 2018): YouTube |
catalog entry A short San Diego Supercomputer Center profile in which kc claffy, founder and director of CAIDA, describes the scale of today's Internet - roughly half a million independently routable units and some 60,000 autonomous networks - argues that security is its biggest open issue, and makes the case that its future depends on accurate measurement from multiple sources of data. |
|
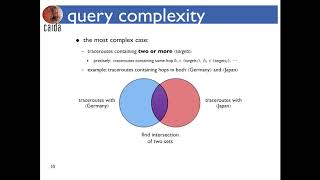
Henya: CAIDA's Internet Topology Query System Tool (Aug 2017): YouTube |
catalog entry Henya is CAIDA's large-scale Internet topology query system which provides remote search of traceroute data without requiring data downloads. Henya includes built-in analyses and visualizations for commonly occuring needs, and is intended to be responsive enough for interactive data exploration. |
|
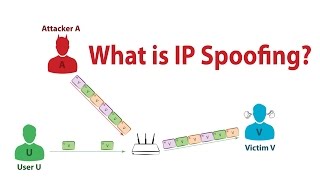
Spoofer video: What is IP Spoofing? (May 2017): YouTube |
catalog entry Over the past several months, CAIDA, in collaboration with Matthew Luckie at the University of Waikato, has upgraded Rob Beverly's original spoofing measurement system, developing new client tools for measuring IPv4 and IPv6 spoofing capabilities, along with services that provide reporting and allow users to opt-in or out of sharing the data publicly. Watch the video "What is IP Spoofing?" for an overview of what IP spoofing is and how you can install Spoofer and help. |

|
The Remote Peering Jedi (Dec 2016): YouTube |
catalog entry Vasileios Giotsas (CAIDA) presents The Remote Peering Jedi at RIPE 73 (Madrid, October 2016): a methodology and tool for detecting remote peering at Internet exchange points. Also available as the official RIPE 73 webcast. |
|
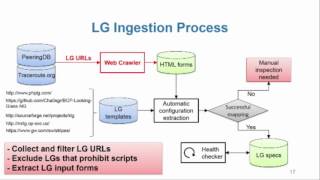
Periscope: Standardizing and Orchestrating Looking Glass Querying (Oct 2016): YouTube |
catalog entry Vasileios Giotsas (CAIDA) presents Periscope, CAIDA's system for standardizing and orchestrating looking-glass querying, at NANOG 68 (Dallas, October 2016). |
|
Software Systems for Surveying Spoofing Susceptibility (Oct 2016): YouTube |
catalog entry Recording of the NANOG 68 Security Track (Dallas, October 2016). kc claffy's talk Software Systems for Surveying Spoofing Susceptibility, on the Spoofer project's measurement of source address validation deployment, begins at 33:30. |
|
48hrs after the 1st BGP Hackathon (Feb 2016): YouTube |
catalog entry Recording of the NANOG 66 Lightning Talks session (San Diego, February 2016), which includes Alberto Dainotti's report 48hrs after the 1st BGP Hackathon. |
|
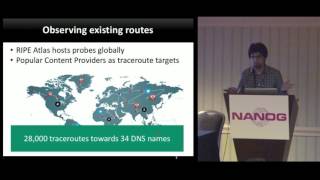
BGPStream: a framework for historical analysis and real-time monitoring of BGP data (Feb 2016): YouTube |
catalog entry Recording of the NANOG 66 Research and Education Track (San Diego, February 2016), featuring talks on BGP measurement and analysis and on DDoS defense. Alberto Dainotti's talk BGPStream: a framework for historical analysis and real-time monitoring of BGP data begins at 26:57. |

|
Measuring Internet Interconnection Performance Metrics: an exercise to inform public policy (Feb 2016): YouTube |
catalog entry Recording of the NANOG 66 keynote on Internet measurement (San Diego, February 2016). David Clark (MIT) and kc claffy (CAIDA) give historical and current perspective on Internet measurement research and evolving industry structure, with Geoff Huston (APNIC) as respondent. |
|
LISA Conversations: kc claffy on Named Data Networking (Nov 2015): YouTube |
catalog entry LISA Conversations (USENIX, April 2016): Tom Limoncelli and Lee Damon talk with kc claffy and Lixia Zhang about kc's LISA15 talk A Brief History of a Future Internet: the Named Data Networking Architecture. The recording of the original LISA15 talk is linked as well. |

|
Measuring and Monitoring BGP (Nov 2015): YouTube |
catalog entry Recording of the IETF 94 Operations, Administration, and Technical Plenary (Yokohama, 4 November 2015). Alberto Dainotti's talk Measuring and Monitoring BGP begins at 1:22:00. |

|
Mapping the Technological Frontier and Sources of Innovation (Feb 2015): YouTube |
catalog entry Recording of the opening session of the Silicon Flatirons 2015 Digital Broadband Migration conference: welcome, then the panel Mapping the Technological Frontier and the Sources of Innovation with kc claffy (CAIDA), David Clark (MIT), Ashkan Soltani (FTC) and Jack Waters (Level 3), moderated by Paul Ohm. kc claffy's remarks begin at 10:52. |
|
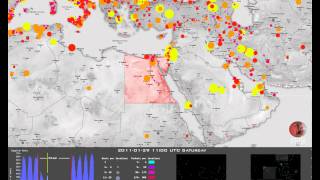
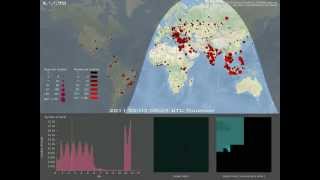
A Coordinated View of the Temporal Evolution of Large-scale Internet Events (Jan 2014): YouTube |
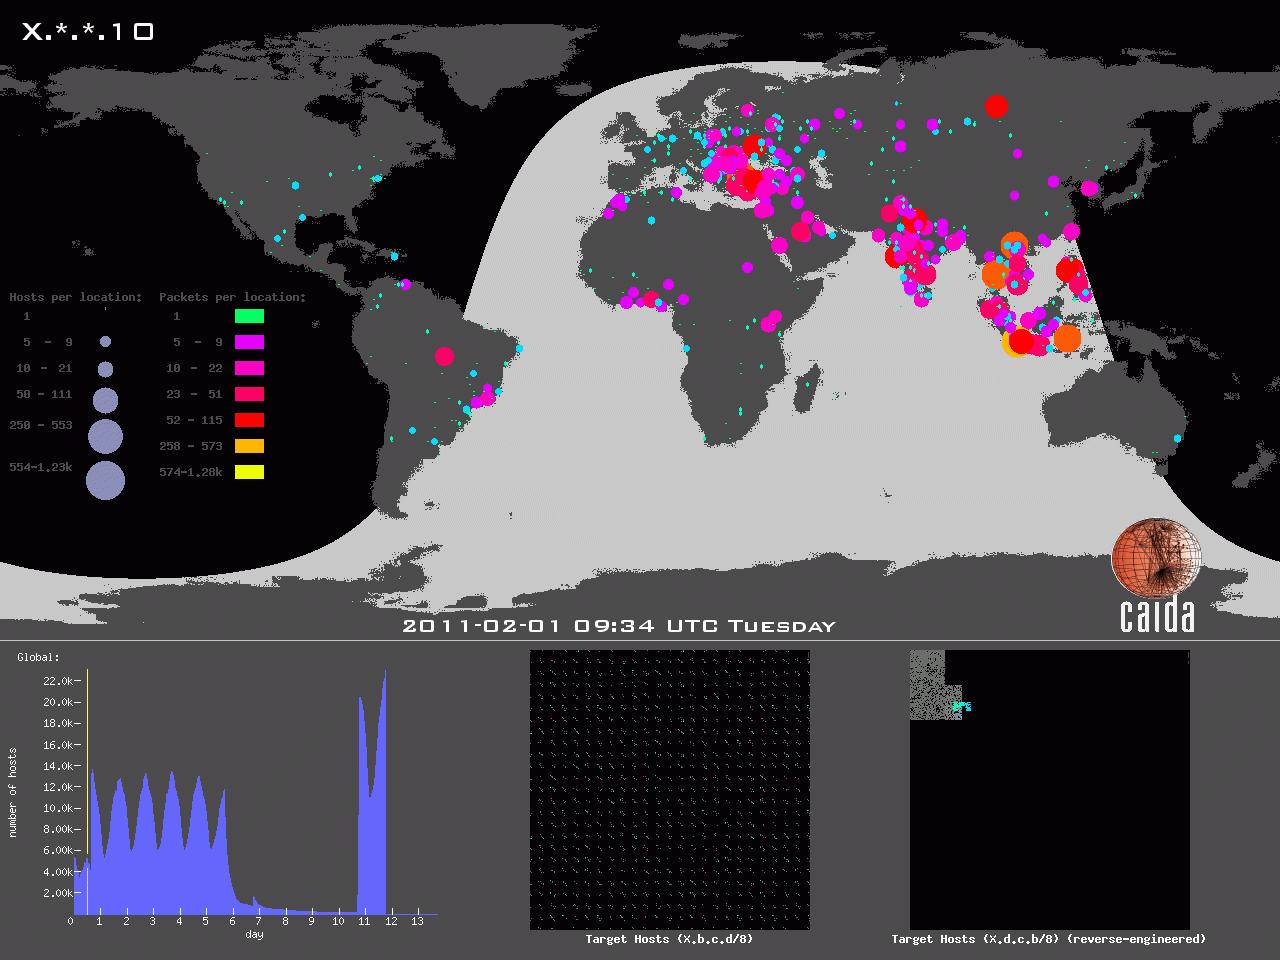
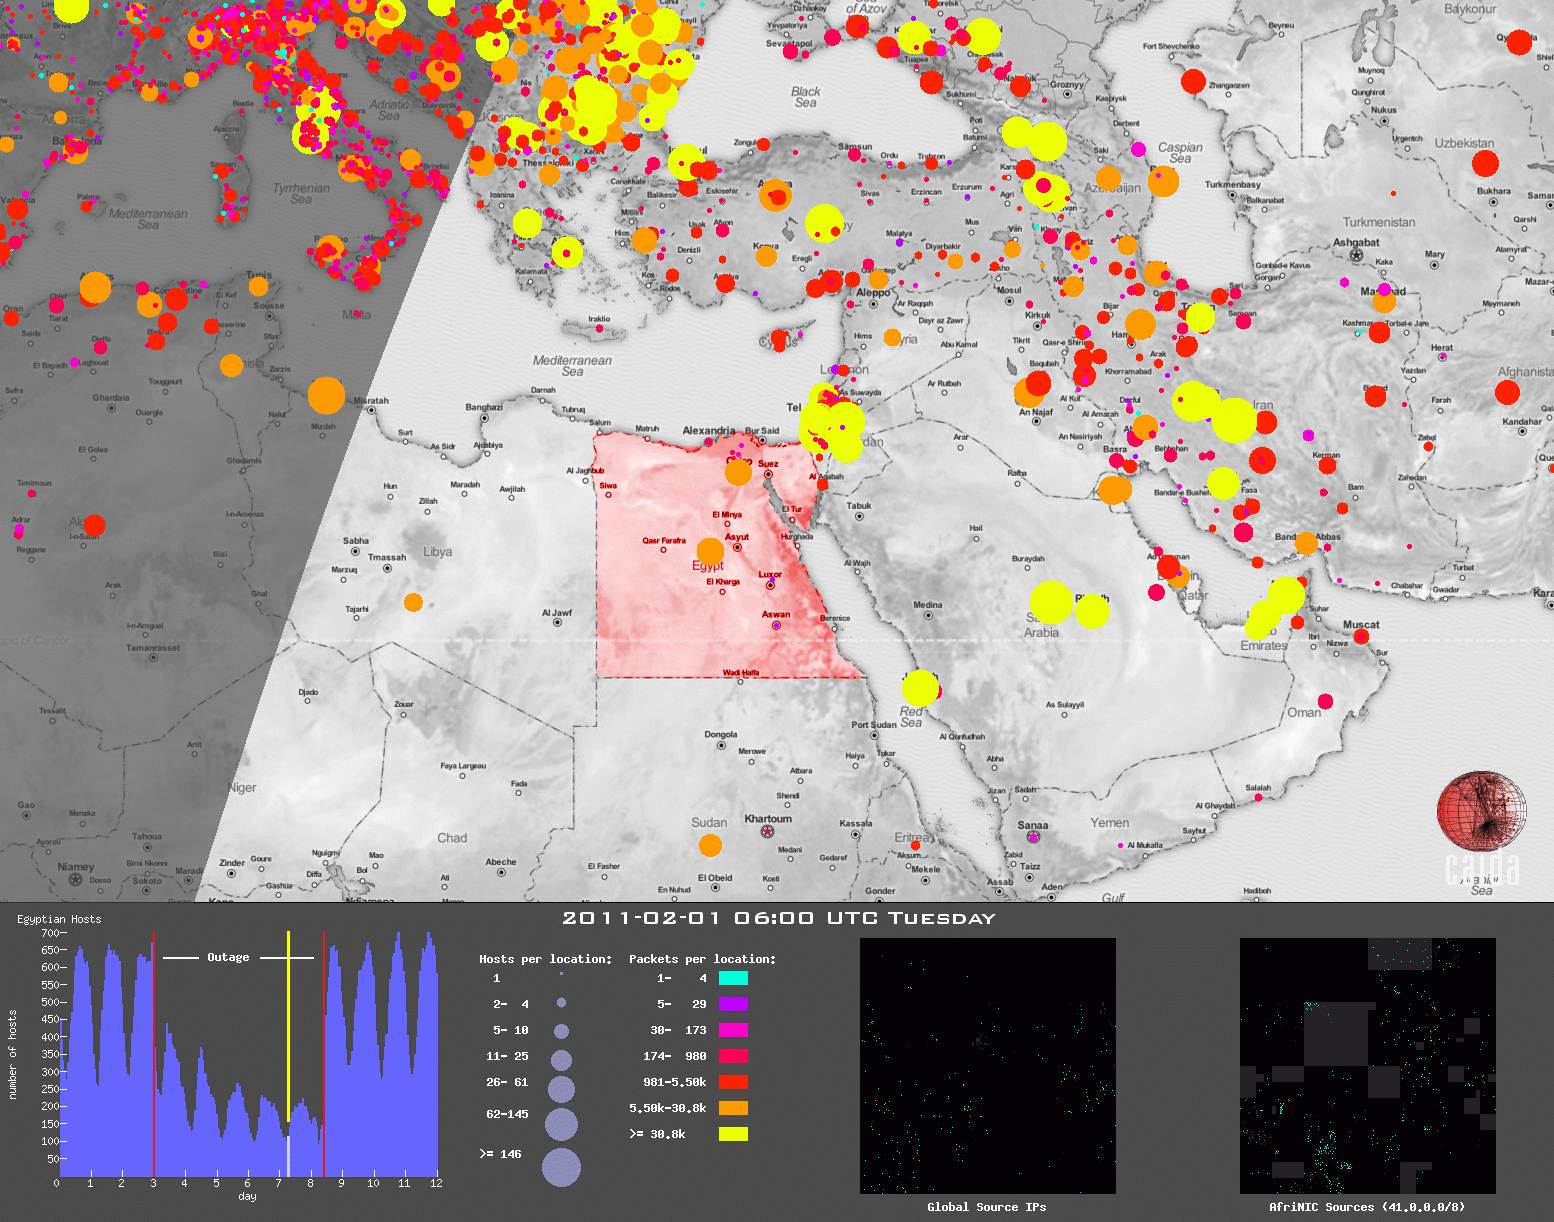
catalog entry To visualize large-scale Internet events, such as a large region losing connectivity, or a stealth probe of the entire IPv4 address space, we coordinated views to study the temporal evolution of an event along different dimensions, including geographic spread, topological (address space) coverage, and traffic impact. In early 2011, there was a government-mandated Internet blackout in Egypt, which isolated the country from the rest of the Internet for more than five days. The view pictured combines a geographical representation of Egypt region along with animations of the source addresses observed during the event, both at a global level, and from the 41.0.0.0/8 network delegated to AfriNIC. |
|
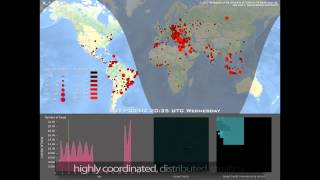
The Sipscan - A Coordinated View (Nov 2012): YouTube |
catalog entry The sipscan composite animation combines the world map animation, standard byte ordered target progression animation, and the reversed byte order animation into a single, synchronized video. This allows an immediate comparison between the geographical dynamics of the bots and the progression of the IP addresses across the duration of the scan. |
|
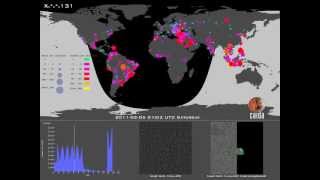
Analysis and Visualization of a Botnet's Stealth Scan of the Internet (Sep 2012): YouTube |
catalog entry A narrated visualization of a stealth botnet-coordinated scan of the entire IPv4 address space, targeting critical voice communications infrastructure. Multiple coordinated views dissect the temporal evolution of the event along geographic spread, topological (address space) coverage, and traffic impact, revealing the reverse-byte incrementing behavior of the scan and the distinct phases orchestrated by the botmaster. |
|
Sipscan - Coordinated View (Aug 2012): YouTube |
catalog entry The sipscan coordinated view animation combines the world map animation, standard byte ordered target progression animation, and the reversed byte order animation into a single, synchronized video. This allows an immediate comparison between the geographical dynamics of the sources and the progression of the target addresses across the duration of the scan. |

|
Sipscan - Target Progression in Reversed Byte Order (Aug 2012): YouTube |
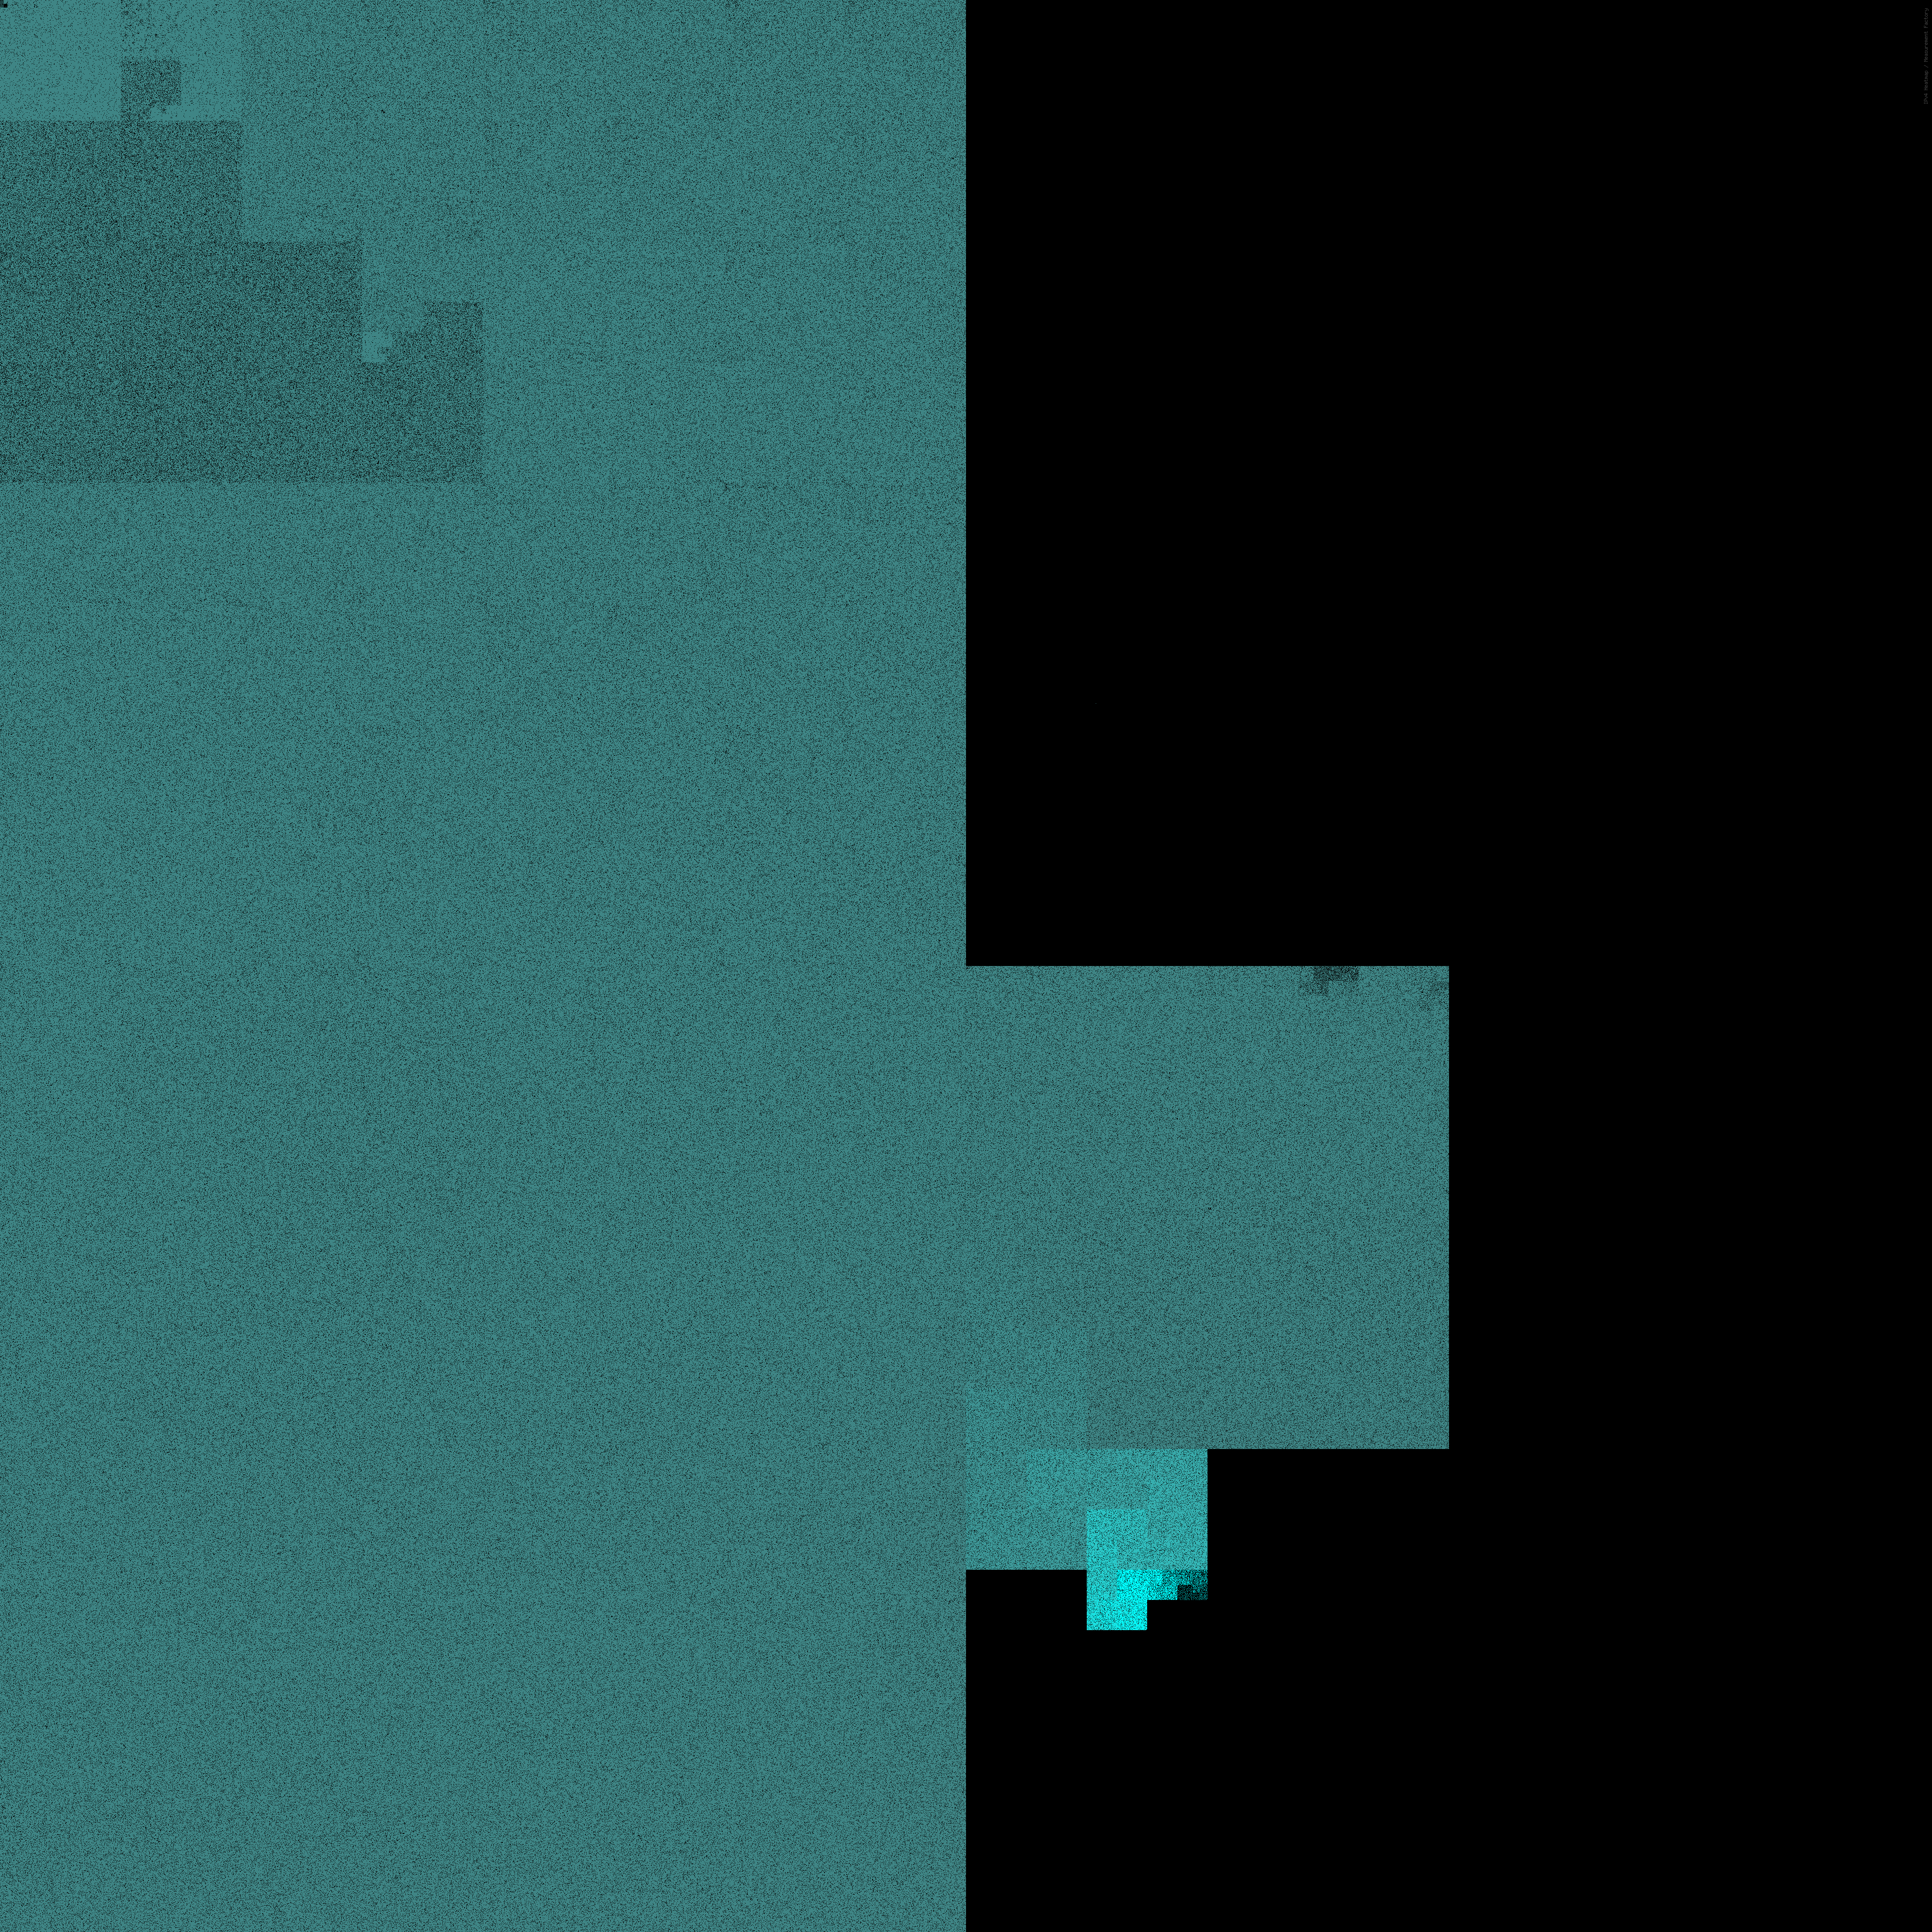
catalog entry The animation of the sipscan target progression in reversed byte order represents the progression over time of the IP addresses targeted by the sipscan. The darknet address space is represented as a Hilbert curve of order 12 in which the order of the three least significant bytes of each address is reversed before mapping it into the curve. Highlighted pixels correspond to IP addresses that have been probed up to that time (5 Feb 2011 11:47 GMT, in this frame). The animation proves the reverse-byte order progression is rigorously followed by the bots during the entire 12 days, independent of the varying rate of the sipscan. |
|
Sipscan - Target Progression in Standard Byte Order (Aug 2012): YouTube |
catalog entry The animation of the sipscan target progression in standard byte order represents the progression over time of the actual IP addresses targeted by the sipscan. The darknet address space is represented as a Hilbert curve of order 12. Drawing the Hilbert curve using IP addresses sequenced in their natural byte order does not reveal a particular pattern in the target progression, showing the square uniformly filling across the 12 days of the scan. |
|
Sipscan - World Map (Aug 2012): YouTube |
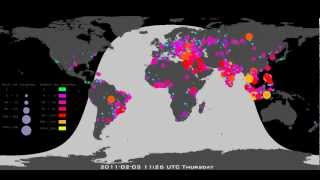
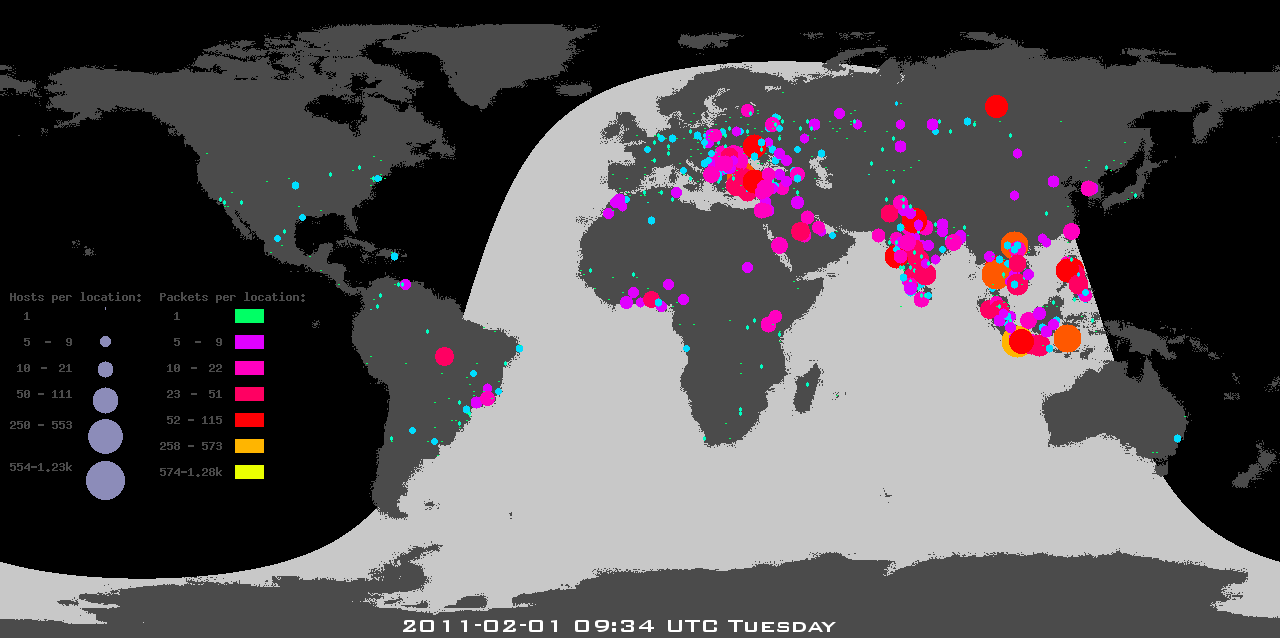
catalog entry The Sipscan World Map animation shows, with 5:20-minutes of data represented per frame, circles at the geographical coordinates of source hosts (bots) with size proportional to the number of hosts geolocated to those coordinates, and color to the number of packets sent. The animation depicts the spatial and temporal dynamics of the scan. |
|
Analysis of Country-wide Internet Outages Caused by Censorship (Dec 2011): YouTube |
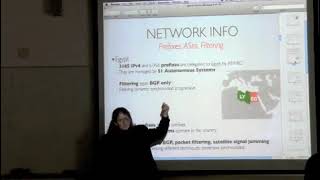
catalog entry Lo-fi recording of kc claffy's presentation at the UCSD DANCES seminar (November 2011) on the analysis of country-wide Internet outages caused by censorship, combining BGP, traceroute and darknet data. The talk begins at 0:52 and questions at 33:58. |
|
Robustness of Targeted Transport in Complex Networks (Nov 2010): View |
catalog entry Recording of Dmitri Krioukov's talk Robustness of Targeted Transport in Complex Networks at the Robustness of Complex Networks workshop, TU Delft, November 2010. Served by TU Delft's Mediasite player; plays without a login (checked 2026-08-28). |
|
|
IPv4 WHOIS Map (2007) (Oct 2007): View |
catalog entry A visualization of the characteristics of IPv4 "whois" data from the five Regional Internet Registries (RIRs). |
|
|
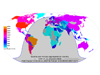
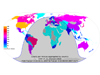
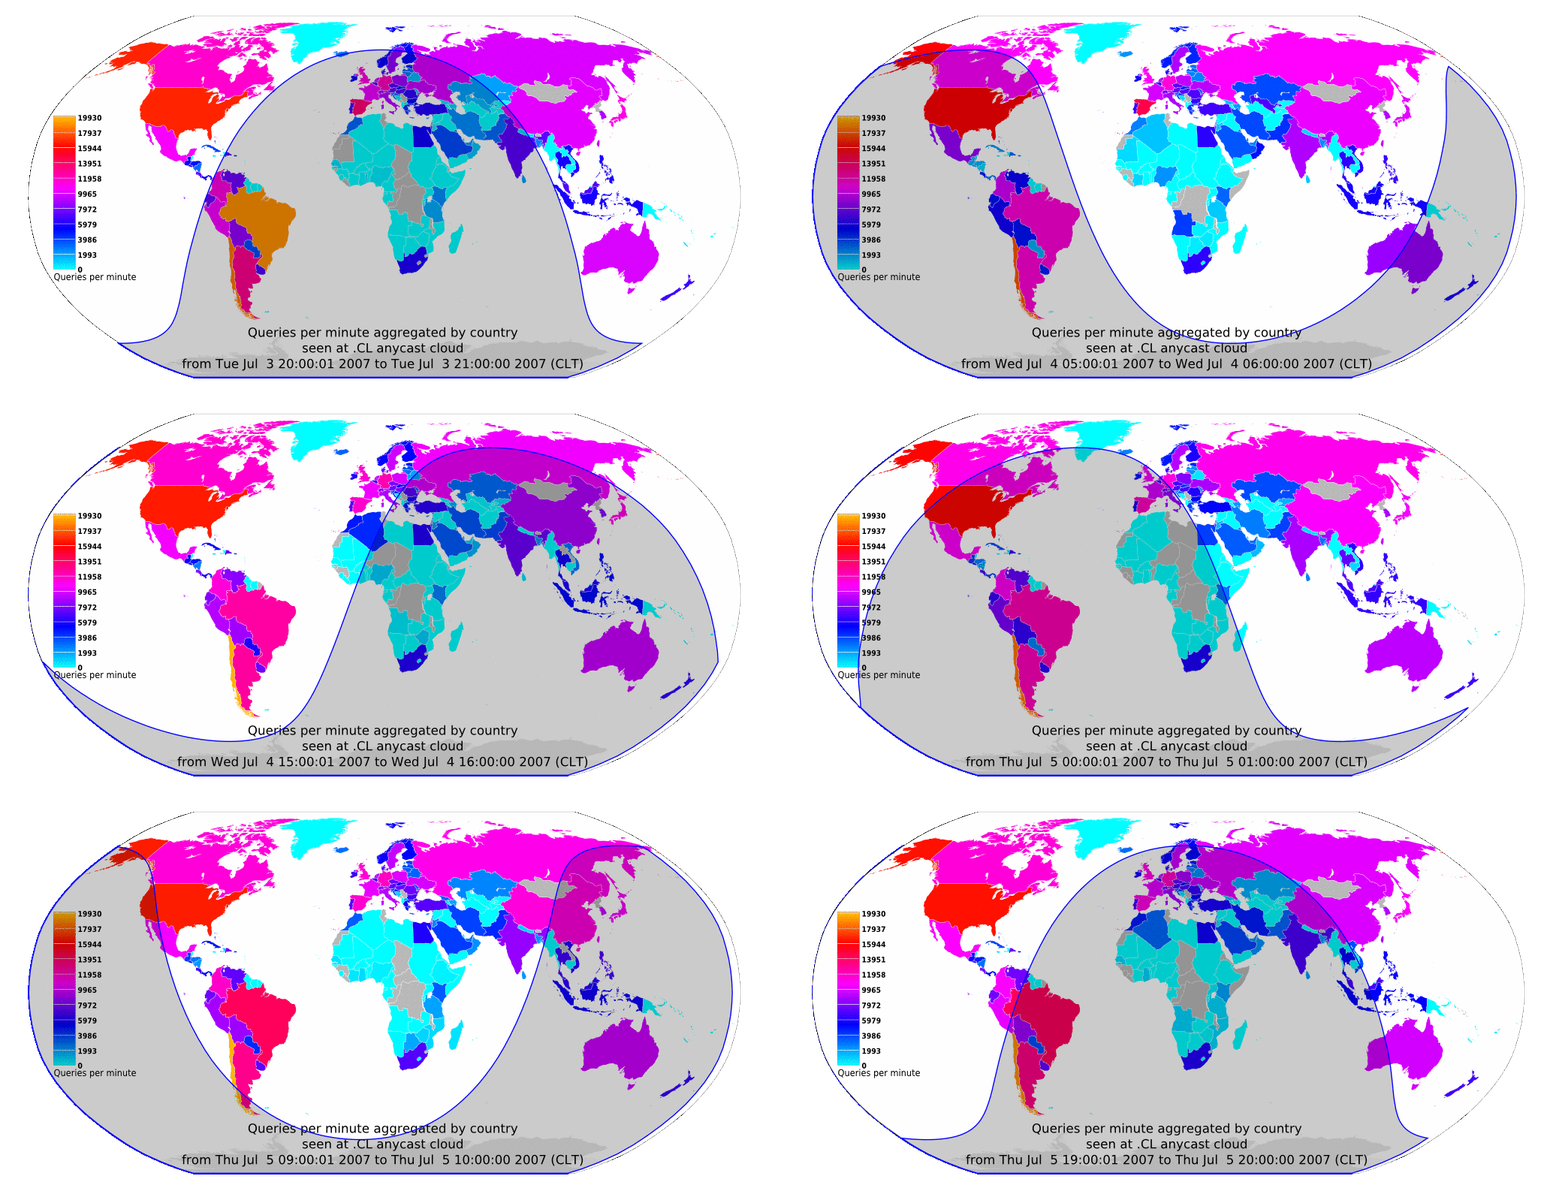
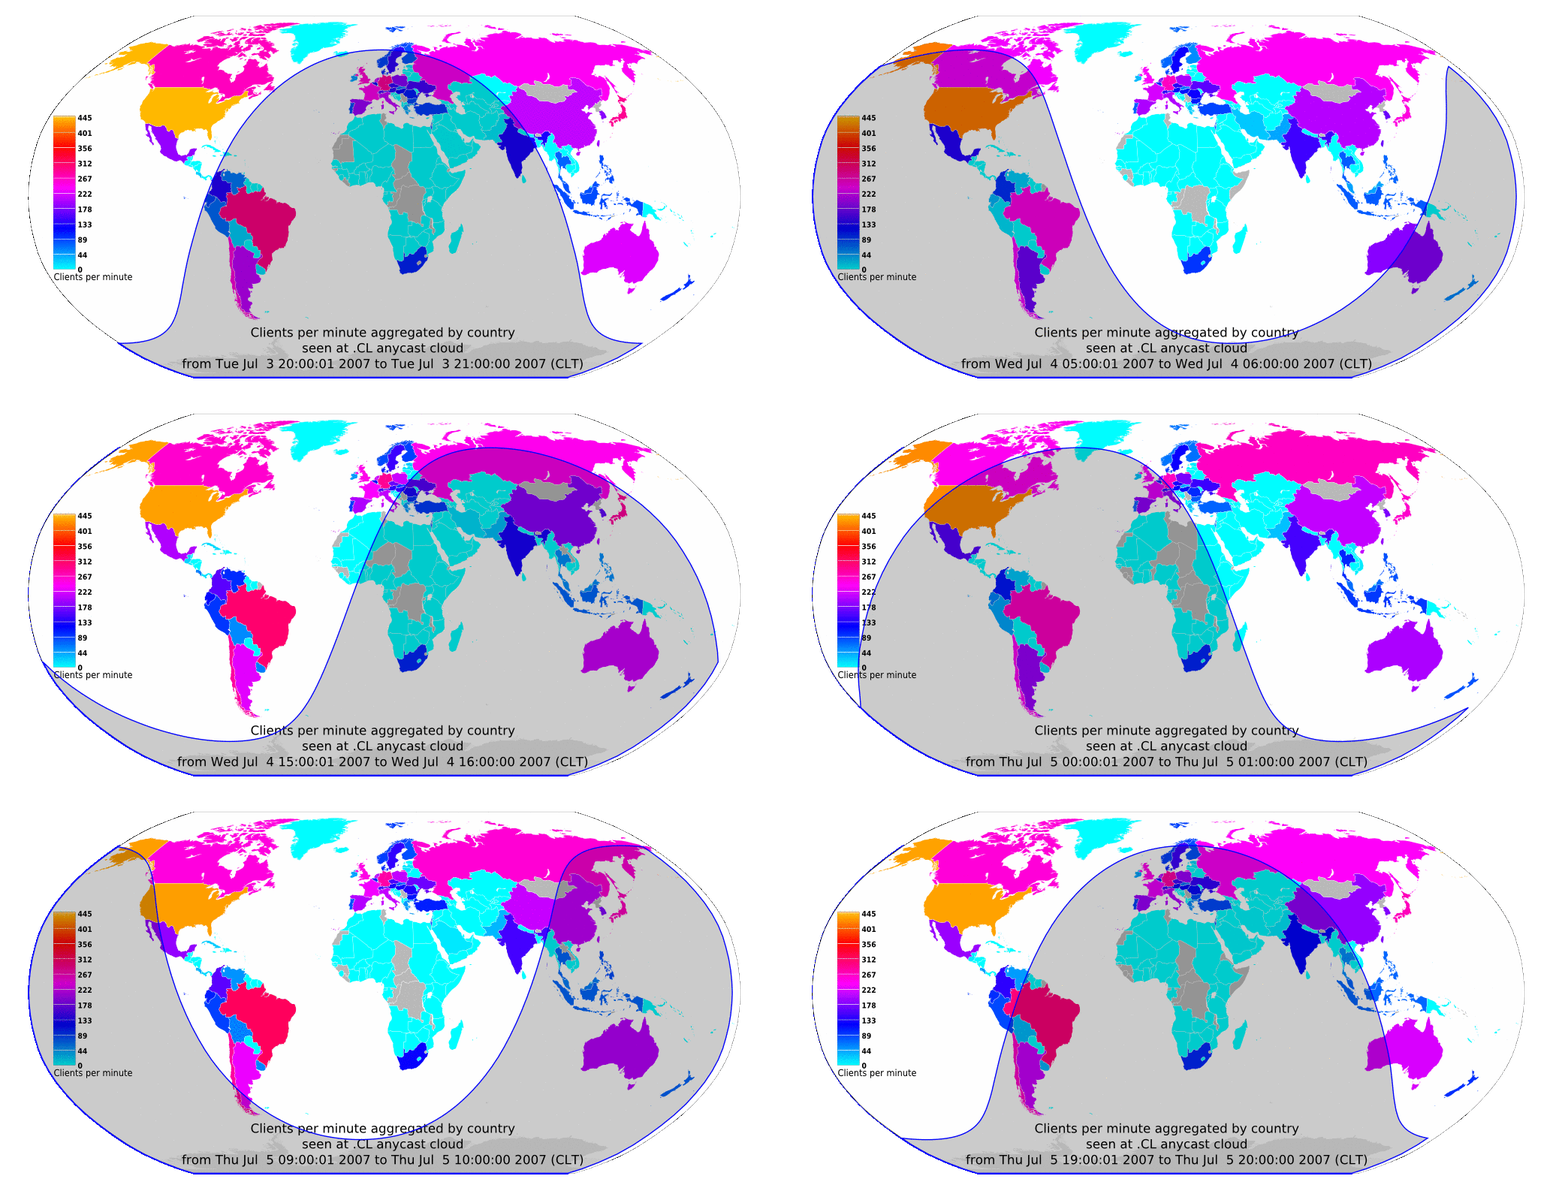
Animated Maps of Two Days of DNS Workload for the .CL Chilean ccTLD (Mar 2007): View |
catalog entry The DNS workload animated maps show the number of queries and clients seen by one of the .CL nameservers in Chile and its hourly variation along two days of traces beginning on July 3rd 2007 at 21:00 (UTC). The animation provides a view of the world map and colors countries based on the load that each country originates. The use of a terminator to show the sun's shadow helps depict potential diurnal patterns in the displayed data. |
|
|
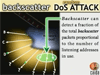
Backscatter Analysis (Aug 2001): YouTube |
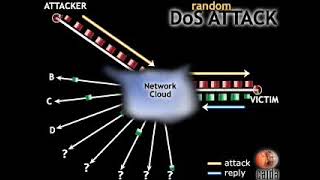
catalog entry An animated explanation of denial-of-service attacks and of backscatter analysis, the technique CAIDA used to infer worldwide DoS activity from the unsolicited responses that victims send back to spoofed source addresses observed at the UCSD Network Telescope. Copyright 2001 Regents of the University of California. |
|
BGP Animations (IETF, December 1997) (Dec 1997): View |
catalog entry BGP animations shown in kc claffy's presentation at the December 1997 IETF meeting. The animation has no audio track. The recording is a 62 MB MPEG-1 file served from caida.org; download it to play. No streaming copy exists (checked 2026-08-28). |

Historical Animations (1998–2012)
Animations produced by CAIDA between 1998 and 2012, available for download in their original formats. Where an animation also appears in the catalog listing above, its video link is there and the original files are here.
Security
 |
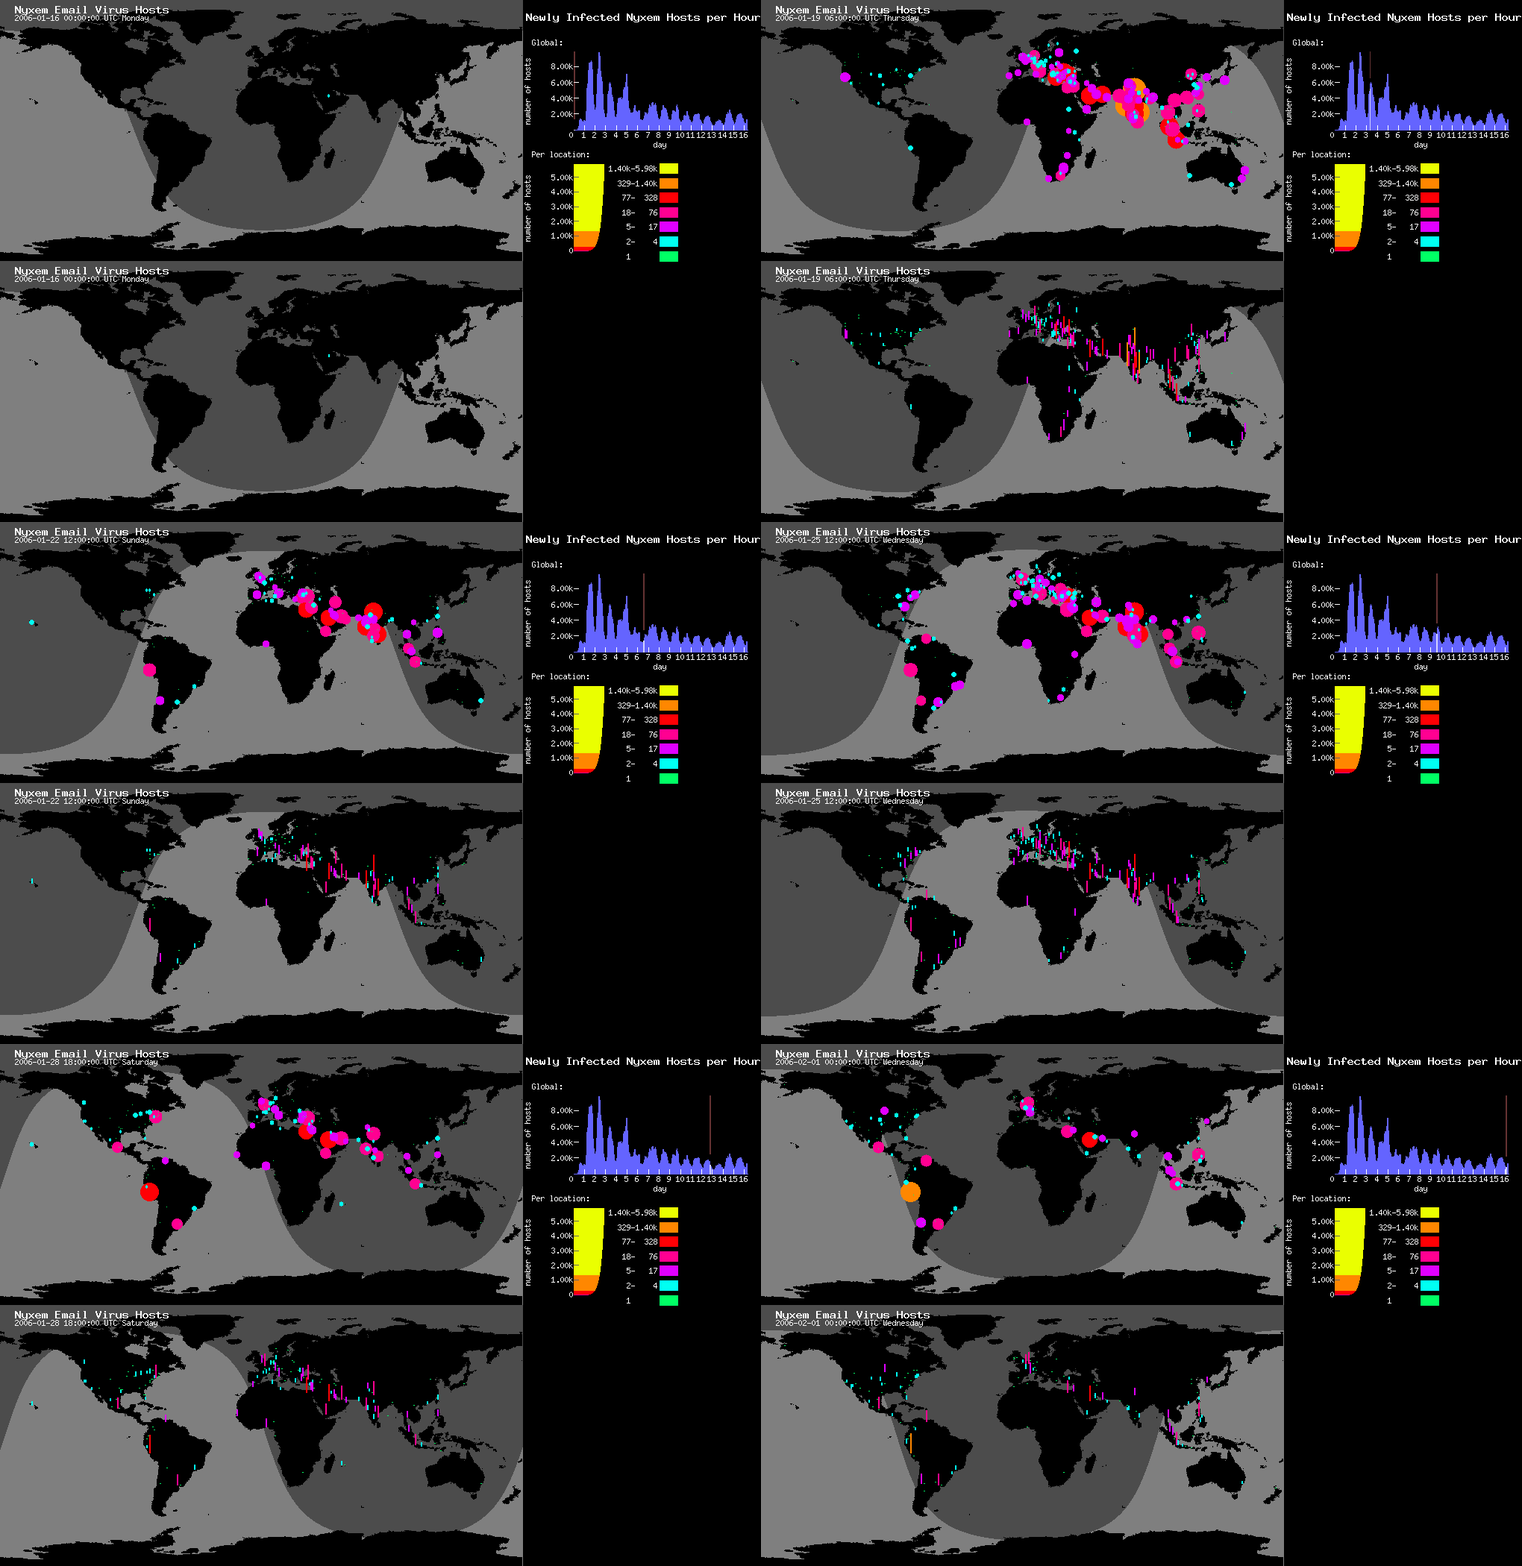
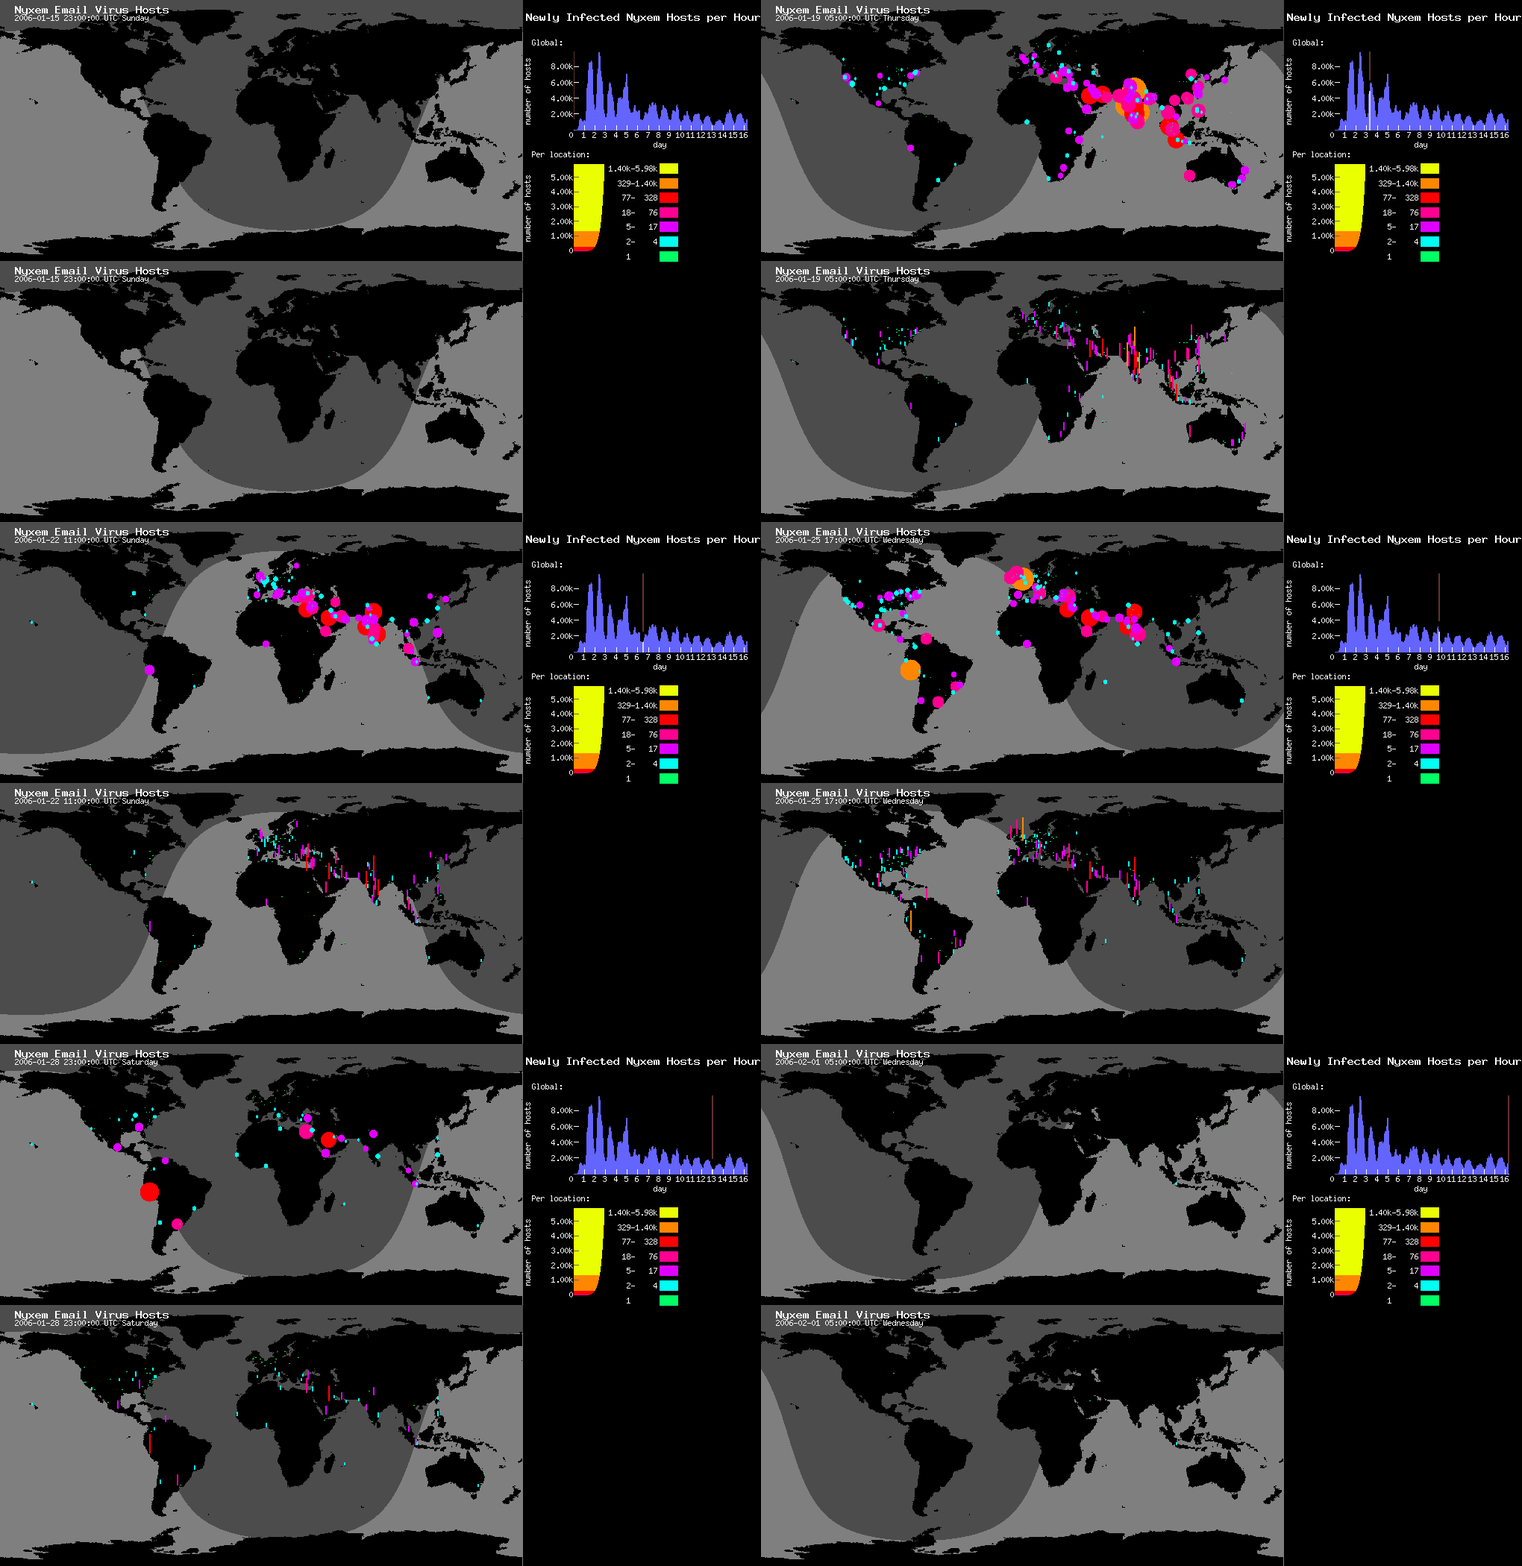
Nyxem Virus (Jan 2006, 0m 39s): small .mov (841 KB) | large .mov (3.1 MB) | small .gif (840 KB) | large .gif (3.1 MB) |
 |
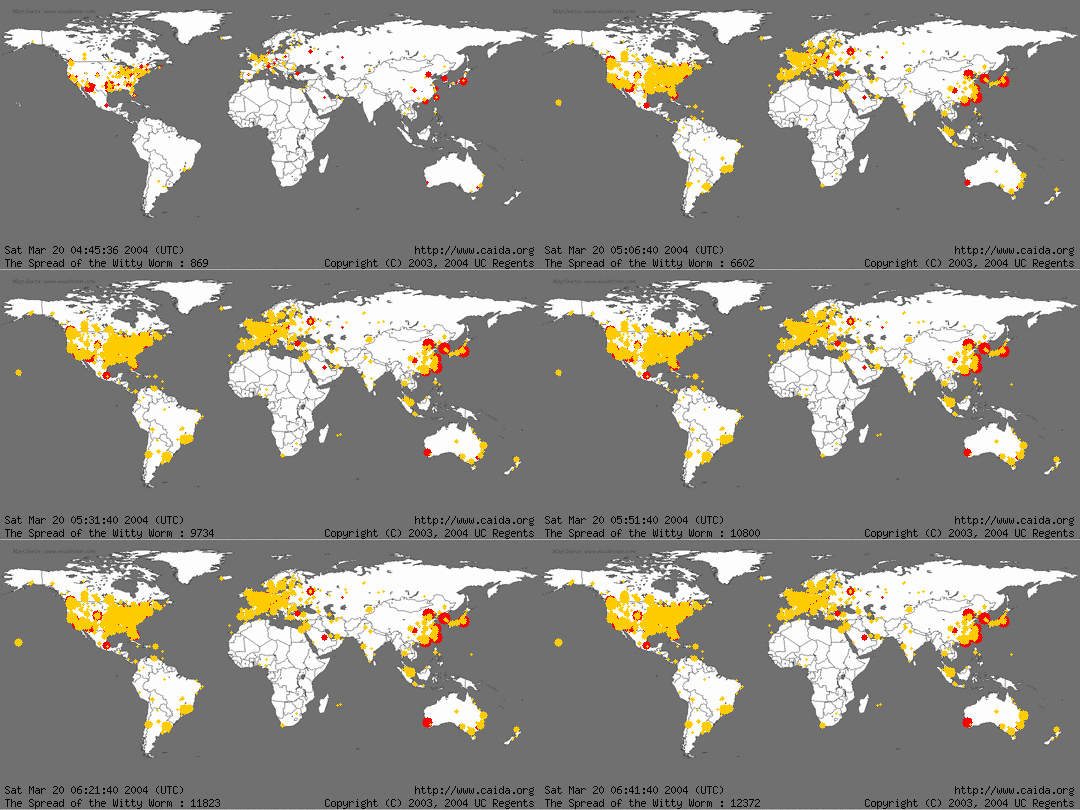
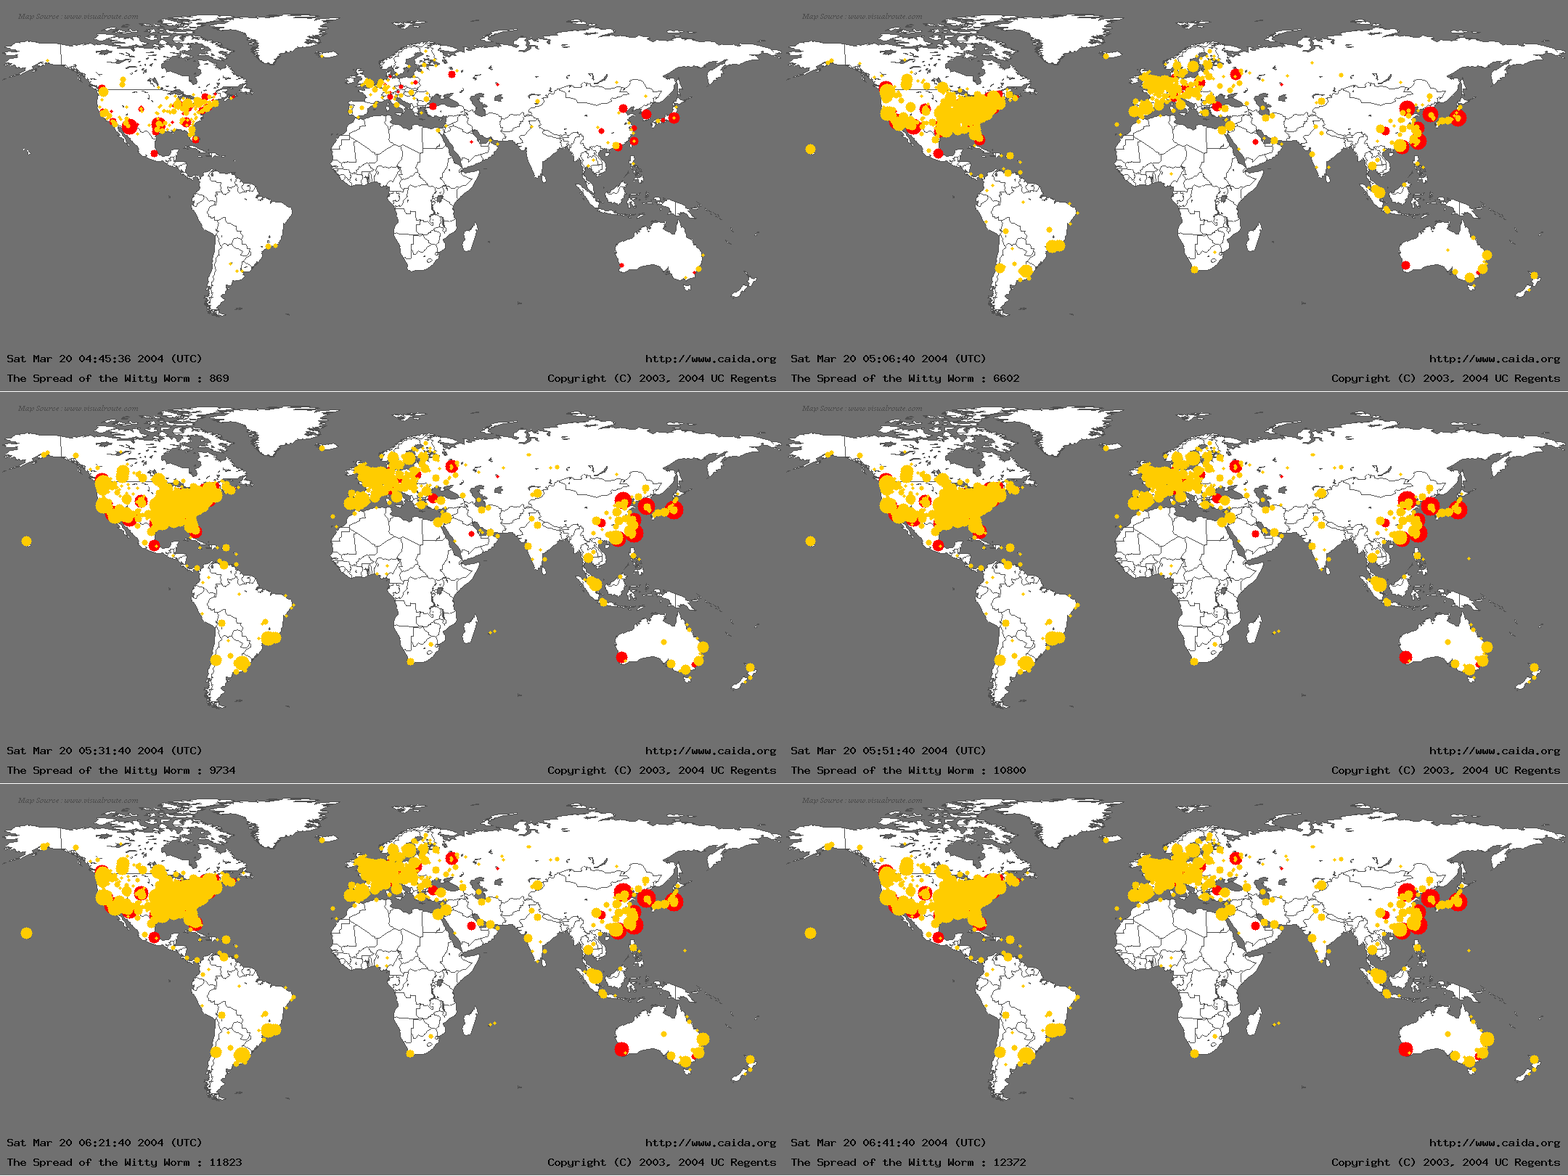
Witty Worm (world) (Mar 2004, 0m 3s): small .gif (53 KB) | large .gif (83 KB) |
 |
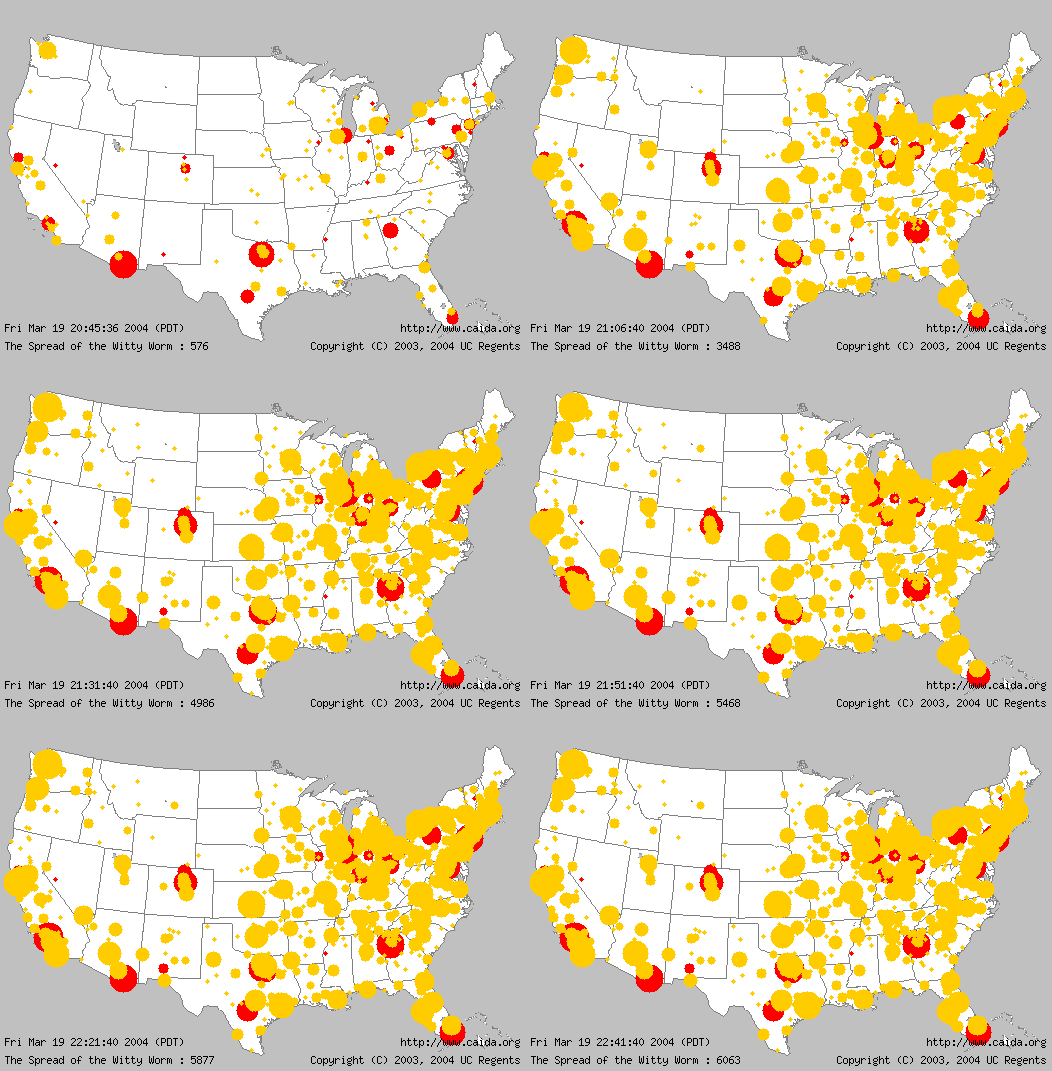
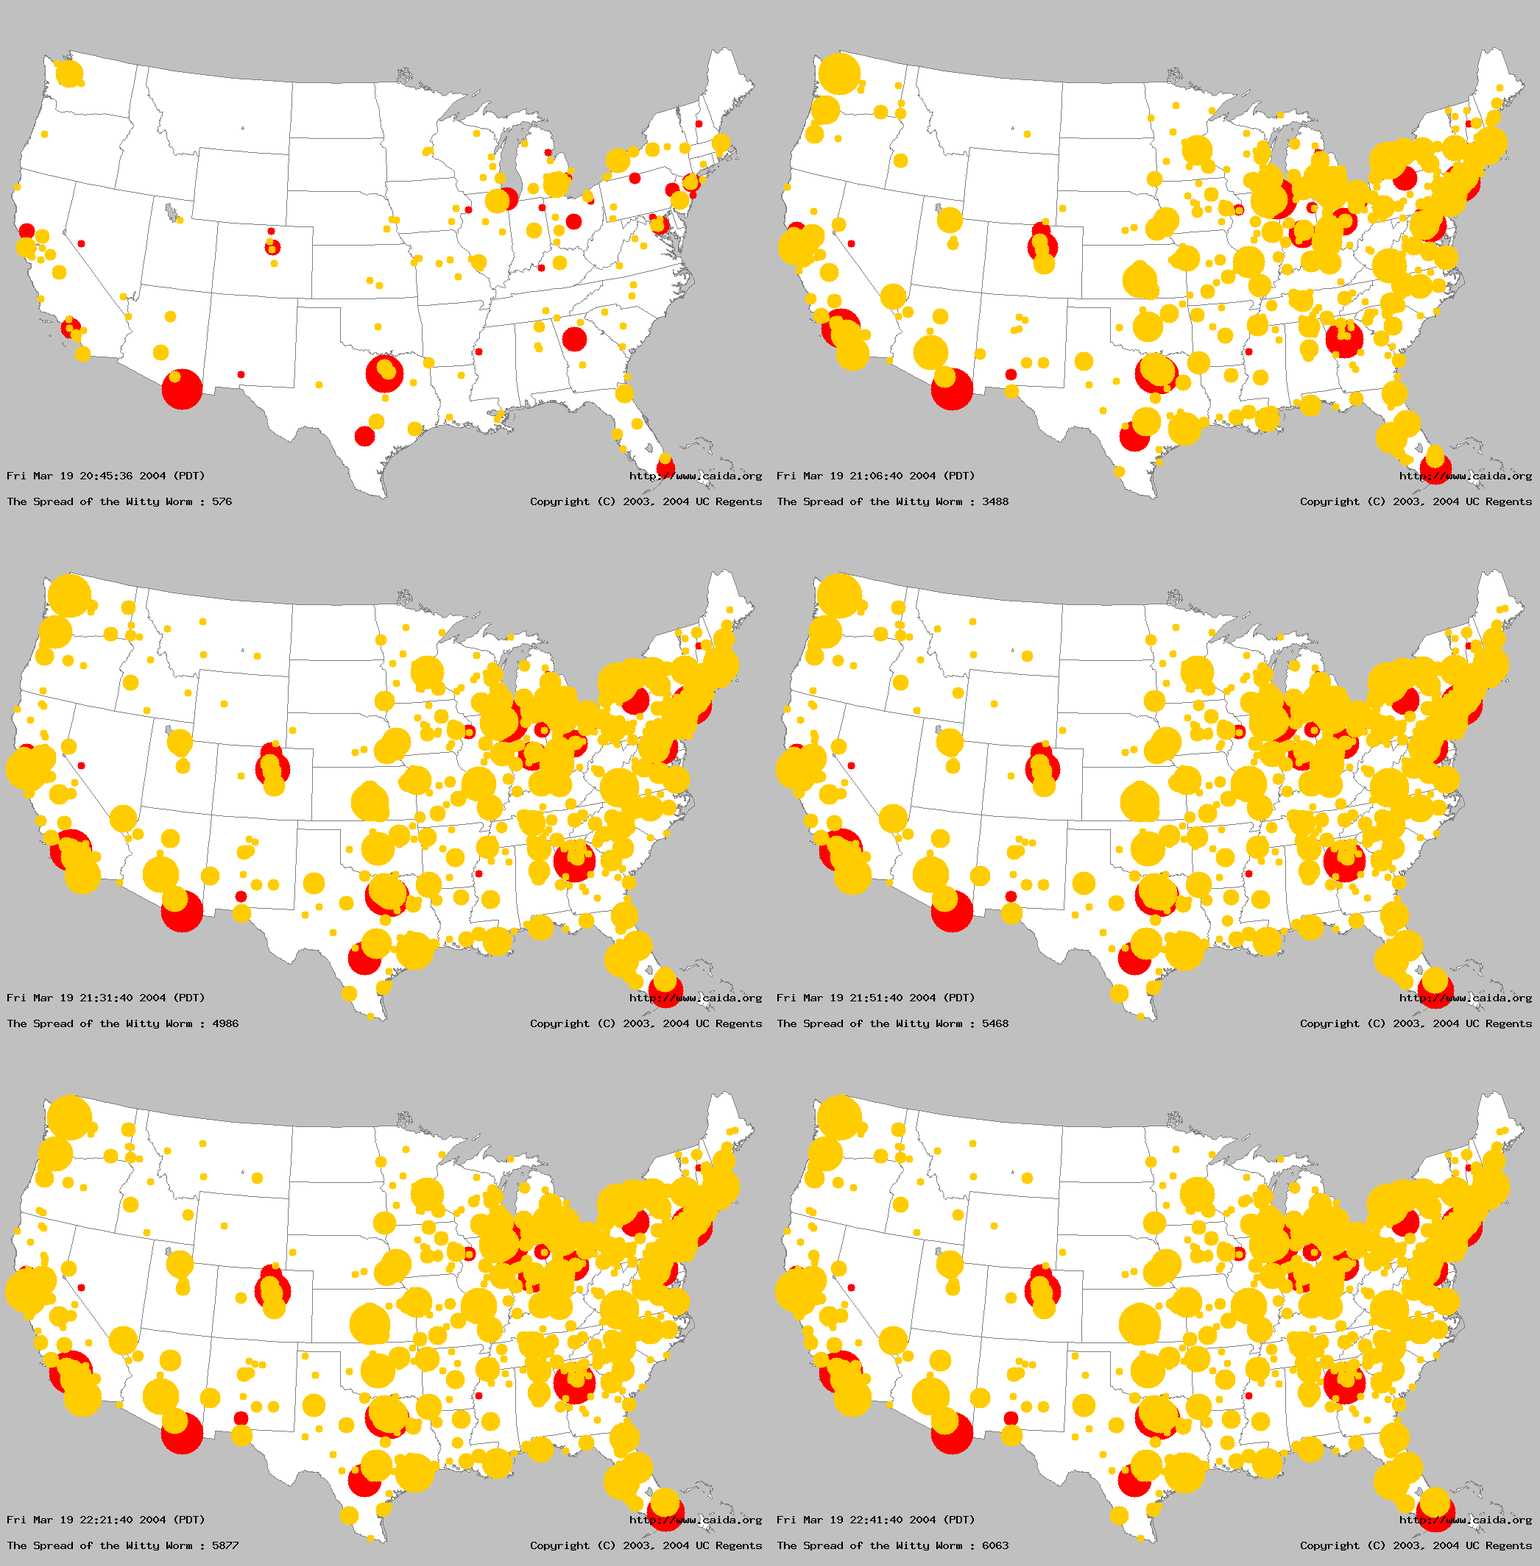
Witty Worm (USA) (Mar 2004, 0m 3s):
small .gif (54 KB) |
large .gif (129 KB)
|
 |
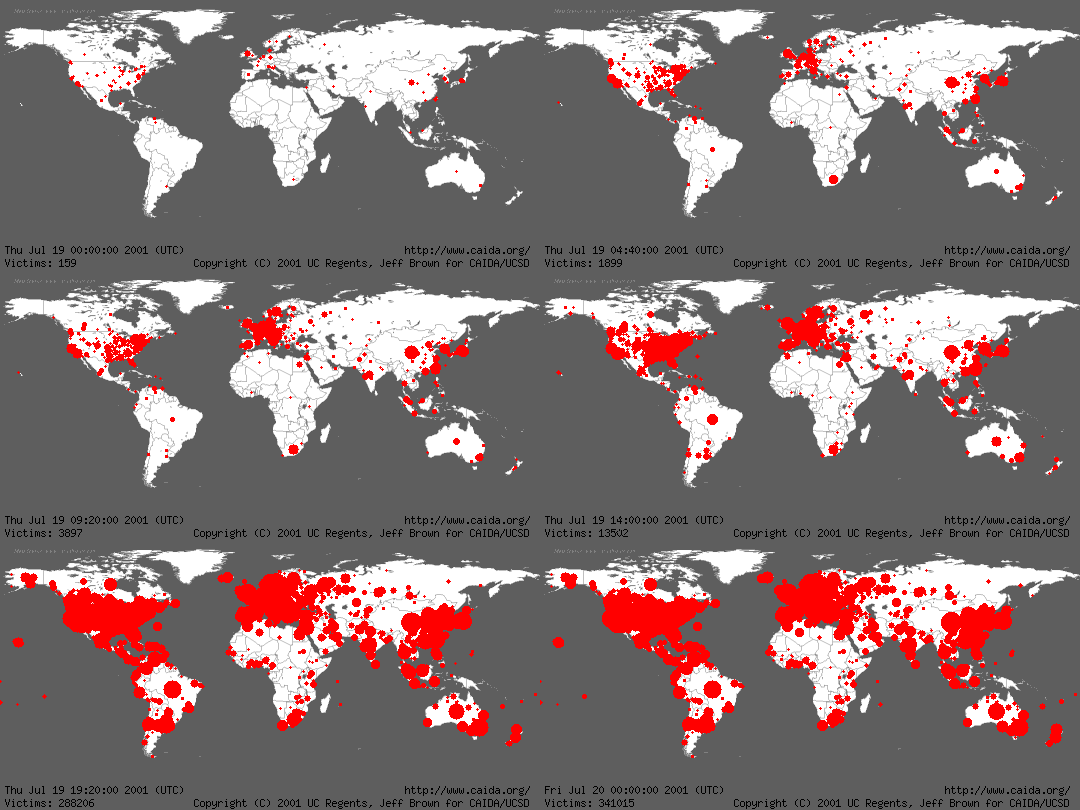
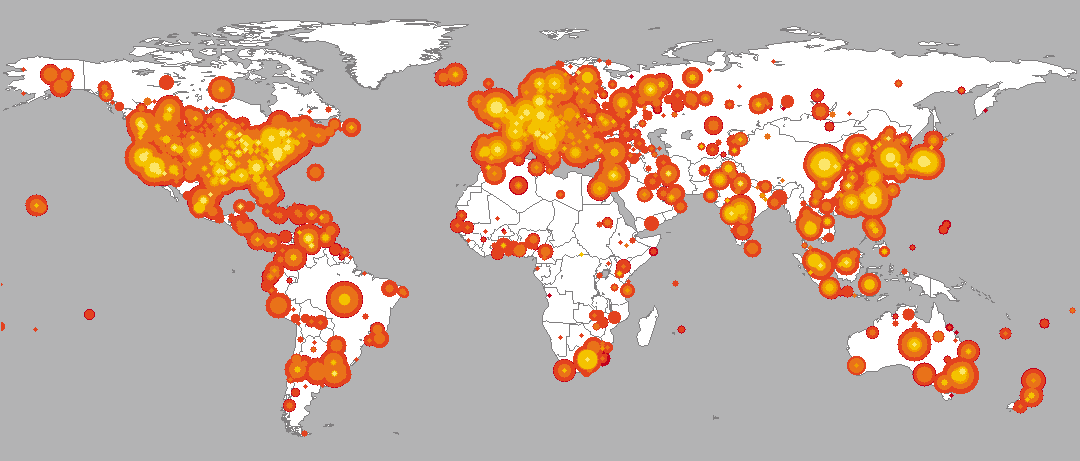
Code-Red Worm (Jul 2001, 0m 28s): .mov (314 KB) | .fli (208 KB) | .gif (4.2 MB) |
Internet Outages
|
Egypt Internet Blackout - Coordinated View (Nov 2012, 0m 32s):
.mp4 (11.5 MB) |
YouTube |
screenshot
The Egypt outage coordinated view animation combines a geographical representation of Egypt region along with animations of the source addresses observed during the event, both at a global level, and from the 41.0.0.0/8 network delegated to AfriNIC. (Egypt area map © OpenStreetMap contributors, CC BY-SA) |

|
Egypt Internet Blackout - Source Addresses (Whole Internet) (Nov 2012, 0m 32s):
.mp4 (11.4 MB) |
YouTube |
screenshot
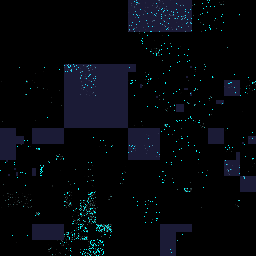
The full source address space animation shows which sources sent packets to the UCSD Network Telescope before, during, and after the Egypt Internet Blackout. Address ranges which have been identified to belong to Egyptian organizations are highlighted in a dark blue color. |
|
Egypt Internet Blackout - Source Addresses (41.0.0.0/8 - AfriNIC) (Nov 2012, 0m 32s):
.mp4 (2.3 MB) |
YouTube |
screenshot
The zoomed source address space animation shows which sources within the 41.0.0.0/8 network - which has been delegated to AfriNIC - sent packets to the UCSD Network Telescope before, during, and after the Egypt Internet Blackout. Address ranges within the /8 network which have been identified to belong to Egyptian organizations are highlighted in a dark blue color. |
Passive Monitoring
|
DNS Workload for the .CL Chilean ccTLD - Queries per minute (2007, 0m 23s): .gif (3.1 MB) |
|
DNS Workload for the .CL Chilean ccTLD - Clients per minute (2007, 0m 23s): .gif (2.9 MB) |
|
Backscatter Analysis (2001, 1m 26s): .mov (4.4 MB) | .mpg (5.9 MB) |
|
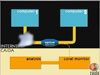
Traffic Characterization (1999, 1m 12s):
.mov (3.3 MB) |
.mpg (4.3 MB)
|
|
TCP Port Analysis (1999, 2m 15s):
.mov (6.0 MB) |
.mpg (6.1 MB)
|
Active Monitoring
 |
Traceroute (2001, 4m 11s):
.mov (13.9 MB) |
.mpg (14.0 MB)
|
 |
AS Core Networks (Jan 2000, 3m 20s): .mov (9.85 MB) | .mpg (33.2 MB) | |
 |
Skitter Tool (1999, 3m 44s): .mov (8.8 MB) | .mpg (10.0 MB) |
Network Visualizations
 |
mapnet video (1998, 8m 27s): .mov (16.2 MB) | .mpg (29.8 MB) |