

The Spread of the Witty Worm
An analysis by Colleen Shannon and David Moore of the spread of the Witty Internet Worm in March 2004. The network telescope and associated security efforts are a joint project of the UCSD Computer Science and Engineering Department and the Cooperative Association for Internet Data Analysis. For more information contact info@caida.org
We would like to thank Brian Kantor, Jim Madden, and Pat Wilson of UCSD for technical support of the Network Telescope project; Mike Gannis, Nicholas Weaver, Wendy Garvin, Team Cymru, and Stefan Savage for feedback on this document; and the Cisco PSIRT Team, Wendy Garvin, Team Cymru, Nicholas Weaver, and Vern Paxson for discussion as events unfolded. Support for this work was provided by Cisco Systems, NSF, DARPA, DHS, and CAIDA members.
Introduction
On Friday March 19, 2004 at approximately 8:45pm PST, an Internet worm began to spread, targeting a buffer overflow vulnerability in several Internet Security Systems (ISS) products, including ISS RealSecure Network, RealSecure Server Sensor, RealSecure Desktop, and BlackICE. The worm takes advantage of a security flaw in these firewall applications that was discovered earlier this month by eEye Digital Security. Once the Witty worm infects a computer, it deletes a randomly chosen section of the hard drive, over time rendering the machine unusable. The worm's payload contained the phrase "(^.^) insert witty message here (^.^)" so it came to be known as the Witty worm.
While the Witty worm is only the latest in a string of self-propagating remote exploits, it distinguishes itself through several interesting features:
- Witty was the first widely propagated Internet worm to carry a destructive payload.
- Witty was started in an organized manner with an order of magnitude more ground-zero hosts than any previous worm.
- Witty represents the shortest known interval between vulnerability disclosure and worm release -- it began to spread the day after the ISS vulnerability was publicized.
- Witty spread through a host population in which every compromised host was doing something proactive to secure their computers and networks.
- Witty spread through a population almost an order of magnitude smaller than that of previous worms, demonstrating the viability of worms as an automated mechanism to rapidly compromise machines on the Internet, even in niches without a software monopoly.
In this document we share a global view of the spread of the Witty worm, with particular attention to these worrisome features.
Background
Network Telescope
The UCSD Network Telescope consists of a large piece of globally announced IPv4 address space. The telescope contains almost no legitimate hosts, so inbound traffic to nonexistent machines is always anomalous in some way. Because the network telescope contains approximately 1/256th of all IPv4 addresses, we receive roughly one out of every 256 packets sent by an Internet worm with an unbiased random number generator. Because we are uniquely situated to receive traffic from every worm-infected host, we provide a global view of the spread of Internet worms.
ISS Vulnerability
A number of Internet Security Systems firewall products contained a Protocol Analysis Module (PAM) to monitor application traffic. The PAM routine in version 3.6.16 of iss-pam1.dll that analyzes ICQ server traffic assumes that incoming packets on port 4000 are ICQv5 server responses and this code contains a series of buffer overflow vulnerabilities. The vulnerability was discovered by eEye on March 8, 2004 and announced by both eEye and on March 18, 2004. ISS released an alert warning users of a possibly exploitable security hole and provided updated software versions that were not vulnerable to the buffer overflow attack.
Witty Worm Details
Once Witty infects a host, the host sends 20,000 packets by generating packets with a random destination IP address, a random size between 796 and 1307 bytes, and a destination port. The worm payload of 637 bytes is padded with data from system memory to fill this random size and a packet is sent out from source port 4000. After sending 20,000 packets, Witty seeks to a random point on the hard disk, writes 65k of data from the beginning of iss-pam1.dll to the disk. After closing the disk, the worm repeats this process until the machine is rebooted or until the worm permanently crashes the machine.
Witty Worm Spread
With previous Internet worms, including Code-Red, Nimda, and SQL Slammer, a few hosts were seeded with the worm and proceeded to spread it to the rest of the vulnerable population. The spread was slow early on and then accelerates dramatically as the number of infected machines spewing worm packets to the rest of the Internet rises. Eventually as the victim population becomes saturated, the spread of the worm slows because there are few vulnerable machines left to compromise. Plotted on a graph, this worm growth appears as an S-shaped exponential growth curve called a sigmoid.
At 8:45:18pm[4] PST on March 19, 2004, the network telescope received its first Witty worm packet. In contrast to previous worms, we observed 110 hosts infected in the first ten seconds, and 160 at the end of 30 seconds. The chances of a single instance of the worm infecting 110 machines so quickly are vanishingly small -- worse than 10-607. This rapid onset indicates that the worm used either a hitlist or previously compromised vulnerable hosts to start the worm. In Figure 1 below, the initial vertical line shows preselected hosts coming online, and then a transition to much slower growth thereafter.
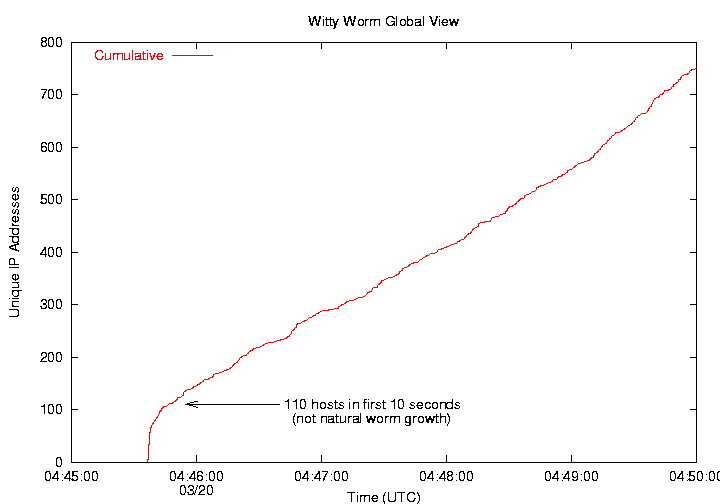 |
| Figure 1: Like many biological pathogens, Internet worms typically spread exponentially until their growth levels off. After the first minute, Witty followed this expected sigmoid curve. But within the first 30 seconds, between 100 and 160 computers were simultaneously activated, indicating either the use of a preprogrammed hitlist or a timed release of the worm on previously hacked machines. |
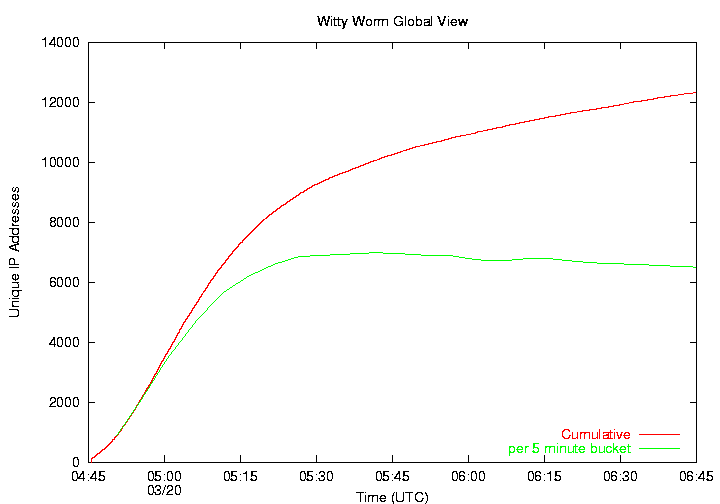
After the sharp rise in initial coordinated activity, the Witty worm followed a normal exponential growth curve for a pathogen spreading in a fixed population. Witty reached its peak after approximately 45 minutes, at which point the majority of vulnerable hosts had been infected. After that time, the churn caused by dynamic addressing causes the IP address count to inflate without any additional Witty infections. At the peak of the infection, Witty hosts flooded the Internet with more than 90Gbits/second of traffic (more than 11 million packets per second).
Witty infected only about a tenth as many hosts than the next smallest widespread Internet worm. Where SQL Slammer infected between 75,000 and 100,000 computers, the vulnerable population of the Witty worm was only about 12,000 computers. Although researchers [1][2][3] have long predicted that a fast-probing worm could infect a small population very quickly, Witty is the first worm to demonstrate this capability. While Witty took 30 minutes longer than SQL Slammer to infect its vulnerable population, both worms spread far faster than human intervention could stop them. In the past, users of software that is not ubiquitously deployed have considered themselves relatively safe from most network-based pathogens. Witty demonstrates that a remotely accessible bug in any minimally popular piece of software can be successfully exploited by an automated attack.
Witty's destructive payload, in combination with efforts to filter Witty traffic and patch infected machines, led to rapid decay in the number of infected hosts. 12 hours after the worm began to spread, half of the Witty hosts were already inactive.
 |
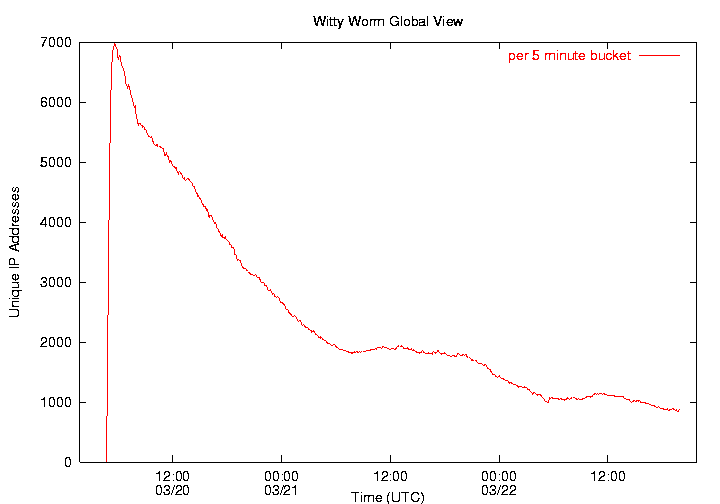 |
| Figure 2: The exponential spread of the Witty worm. The number of active machines in five minutes (green line) stabilized after 45 minutes, indicating that almost all of the vulnerable machines had been compromised. After that point, dynamic addressing (e.g. DHCP) caused the cumulative IP address total (the red line) to continue to rise. We estimate the total number of hosts infected by the Witty worm to be 12,000 hosts at most. | Figure 3: The number of unique hosts infected with the Witty worm over time. Infected Witty hosts were deactivated much more quickly than with previous worms. Although prompt network filtering and active cleanup of compromised hosts played an important role, we believe that the rapid decay in the number of hosts actively spreading Witty was primarily due to the destructive payload crashing infected machines. |
Witty Worm Victims
The vulnerable host population pool for the Witty worm was quite different from that of previous virulent worms. Previous worms have lagged several weeks behind publication of details about the remote-exploit bug, and large portions of the victim populations appeared to not know what software was running on their machines, let alone take steps to make sure that software was up to date with security patches. In contrast, the Witty worm infected a population of hosts that were proactive about security -- they were running firewall software. The Witty worm also started to spread the day after information about the exploit and the software upgrades to fix the bug were available.
Like SQL Slammer, the Witty worm was bandwidth limited -- each infected host sent packets as fast as its Internet connection could transmit them. As shown in Figure 4 below, Witty infected a relatively well-connected pool of hosts. 61% of infected hosts transmitted at speeds between 96kbps (11.2pps) and 512kbps (60pps). The average speed of an infected host was 3Mbps (357pps), although during the peak of the worm's spread, the average speed reached 8Mbps (970pps). We also observed 38 machines transmitting Witty packets at rates over 80Mbps continuously for more than an hour.
Some of the most rapidly transmitting IP addresses may actually be a larger collection of hosts behind a Network Address Translation (NAT) device of some kind. By infecting firewall devices, Witty proved particularly adept at thwarting security measures and successfully infecting hosts on internal networks. We also observed more than 300 hosts in the first few hours transmitting Witty from source ports other than 4000. Since the defining characteristic for successful Witty infection is a source port 4000 packet, presumably these machines are NAT boxes rewriting the source port of packets originating at downstream infected hosts. 67 of those NAT boxes also sent Witty packets with the correct source port 4000, so while some NATs may artificially inflate the transmission speeds of a single infected host, others may artificially deflate them by spreading traffic across other ports.
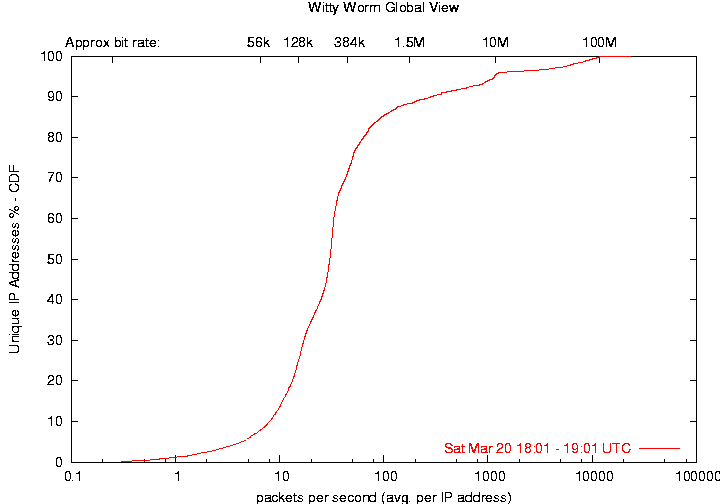 |
| Figure 4: The scanning rate in packets-per-second of hosts infected by the Witty worm. The connection bandwidths that correspond to the packet rates are marked along the top of the graph. 53% of infected hosts had connection speeds between 128kbps (15pps) and 512kbps (60pps). The maximum packet rate observed from one host was 23,500 pps sustained for at least one hour. |
Witty worm hosts showed a wide range of infection durations. A large number of factors influence our measurements of infection duration.
- Dynamic addressing significantly affects the amount of time an IP address remains active. As with the SQL Slammer worm, the flood of packets from an infected host can reset its upstream connection (particularly with dialup hosts), causing the host to disconnect and reconnect from a different IP address.
- Similarly, end users may also be unaware that perceived slowness of their computer or Internet connection is caused by a worm, and they may reboot their computers in the hope that that will fix the problem. If the random disk writes have not damaged anything critical to the boot process, each host may receive a different dynamic address. For these dynamically addressed hosts, the duration we see reflects the duration for which each host maintained its DHCP lease, rather than the true duration of infection on that host.
- Traffic filtering also artificially limits our view of a host's infection duration, but at least in this case we accurately record the duration for which the victim spread the worm to other vulnerable hosts.
- Witty carried a destructive payload that would eventually crash the infected machine. Thus even without a dynamic address or any human intervention, Witty would eventually (and often permanently) deactivate each infected host.
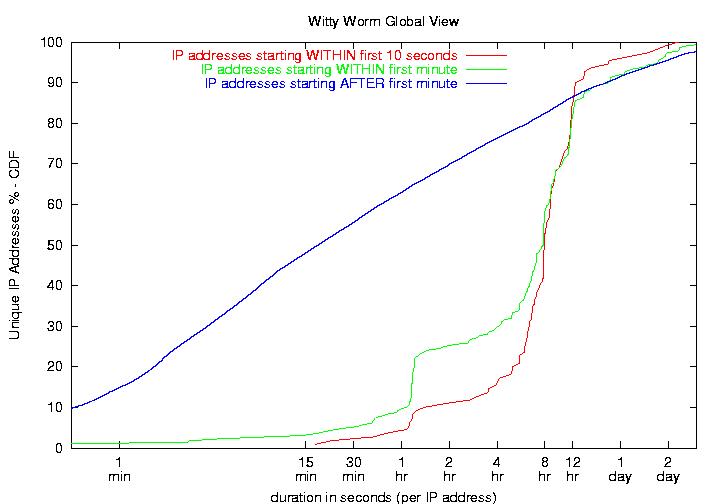 |
| Figure 5: The infection duration for Witty hosts. Unlike previously widespread Internet worms, the infection duration for Witty hosts was curtailed by the worm payload's malicious disk writes which crashed infected computers. In-network filtering and active host cleanup also played important roles in limiting the spread of the Witty worm. |
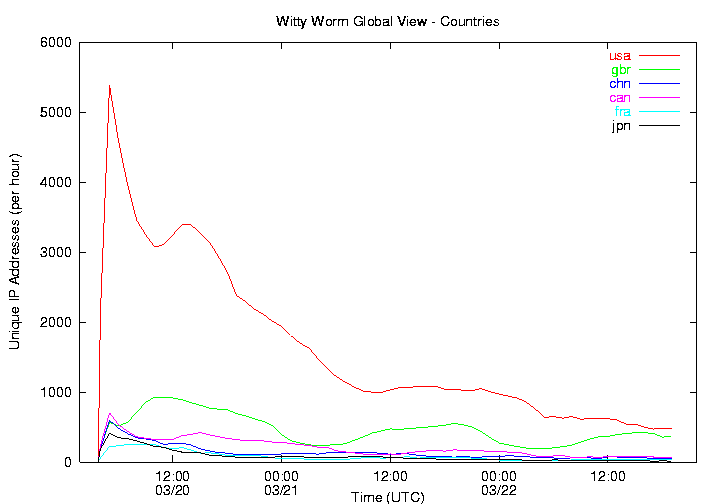
Because US-based ISS is a much smaller company than Microsoft with less extensive overseas operations, the majority of Witty worm infections occurred in the US. Figures 6 and 7 show the number of infected hosts in the top six countries and by geographic region over the first 2.5 days of Witty spread. Figure 7 shows clear diurnal effects, with hundreds of additional vulnerable hosts becoming active on Saturday morning local time (presumably as the computers are powered on and connected to the Internet). This cycle continues Sunday and Monday mornings, although fewer and fewer vulnerable machines remain uninfected over time.
|
|
 |
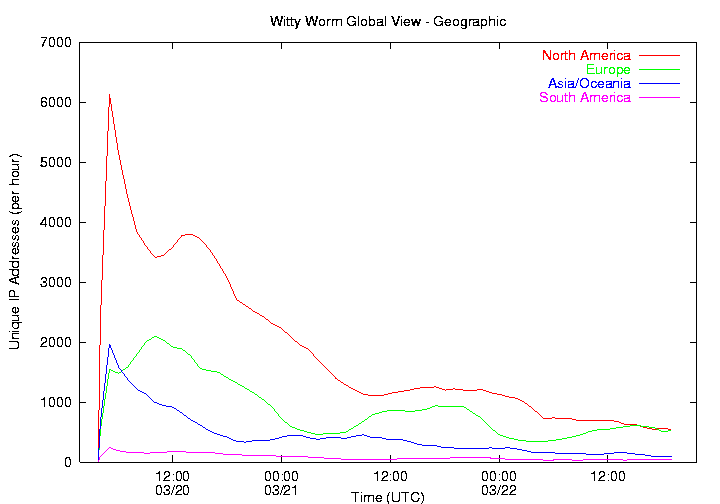 |
| Figure 6: The top six countries affected by the Witty worm. After the initial infection, additional hosts came online every morning (local time) in a diurnal cycle, shown also in Figure 7. | Figure 7: The diurnal cycles of the Witty worm. Countries in each temporal region (especially the hard-hit North American and European locales) show similar patterns of machines coming online in the morning, transmitting during the day, and shutting down in the evening. |
Conclusions
The Witty worm incorporates a number of dangerous characteristics. It is the first widely spreading Internet worm to actively damage infected machines. It was started from a large set of machines simultaneously, indicating the use of a hit list or a large number of compromised machines. Witty demonstrated that any minimally deployed piece of software with a remotely exploitable bug can be a vector for wide-scale compromise of host machines without any action on the part of a victim. The practical implications of this are staggering; with minimal skill, a malevolent individual could break into thousands of machines and use them for almost any purpose with little evidence of the perpetrator left on most of the compromised hosts.
While many of these Witty features are novel in a high-profile worm, the same virulence combined with greater potential for host damage has been a feature of bot networks (botnets) for years. Any vulnerability or backdoor that can be exploited by a worm can also be exploited by a vastly stealthier botnet. While all of the worms seen thus far have carried a single payload, bot functionality can be easily changed over time. Thus while worms are a serious threat to Internet users, the capabilities and stealth of botnets make them a more sinister menace. The line separating worms from bot software is already blurry; over time we can expect to see increasing stealth and flexibility in Internet worms.
Witty was the first widespread Internet worm to attack a security product. While technically the use of a buffer overflow exploit is commonplace, the fact that all victims were compromised via their firewall software the day after a vulnerability in that software was publicized indicates that the security model in which end-users apply patches to plug security holes is not viable.
It is both impractical and unwise to expect every individual with a computer connected to the Internet to be a security expert. Yet the current mechanism for dealing with security holes expects an end user to constantly monitor security alert websites to learn about security flaws and then to immediately download and install patches. The installation of patches is often difficult, involving a series of complex steps that must be applied in precise order.
The patch model for Internet security has failed spectacularly. To remedy this, there have been a number of suggestions for ways to try to shoehorn end users into becoming security experts, including making them financially liable for the consequences of their computers being hijacked by malware or miscreants. Notwithstanding the fundamental inequities involved in encouraging people sign on to the Internet with a single click, and then requiring them to fix flaws in software marketed to them as secure with technical skills they do not possess, many users do choose to protect themselves at their own expense by purchasing antivirus and firewall software. Making this choice is the gold-standard for end user behavior -- they recognize both that security is important and that they do not possess the skills necessary to effect it themselves. When users participating in the best security practice that can be reasonably expected get infected with a virulent and damaging worm, we need to reconsider the notion that end user behavior can solve or even effectively mitigate the malicious software problem and turn our attention toward both preventing software vulnerabilities in the first place and developing large-scale, robust and reliable infrastructure that can mitigate current security problems without relying on end user intervention.
Animations
We have available animations of the spread of the Witty worm both throughout the world and within the United States. In each animation, a circle represents each site with one or more Witty-infected hosts. The diameter of the circle is logarithmically scaled according to the number of infected computers at that site. Locations infected within the first 60 seconds are shown in red, while locations infected after the first 60 seconds are shown in yellow. Note that red circles may continue to increase in size as additional computers at those locations are compromised later. The latitude and longitude of each infected computer were identified using Digital Envoy's Netacuity tool.
World: Small (526x357) Large (1046x710) USA: Small (526x357) Large (1046x710)
References
[1] David Moore, Vern Paxson, Stefan Savage, Colleen Shannon, Stuart Staniford, and Nicholas Weaver, Inside the Slammer Worm, IEEE Security and Privacy, vol. Aug 2003, Aug 2003.
[2] Stuart Staniford, Vern Paxson, and Nicholas Weaver, How to 0wn the Internet in Your Spare Time, Proceedings of the 11th USENIX Security Symposium (Security '02).
[3] David Moore, Colleen Shannon, Geoffrey Voelker and Stefan Savage, Internet Quarantine: Requirements for Containing Self-Propagating Code, Proceedings of the 2003 IEEE Infocom Conference, San Francisco, CA, April 2003.
[4] Fri Mar 26 14:18:45 PST 2004 - a time synchronization glitch caused us to artifically view the beginning of the Witty worm spread as occurring 18 seconds later than it did. In light of this development, we have updated our time for the initiation of the Witty worm spread.
More Information
- Witty Worm
- ISS vulnerability
- eEye: Internet Security Systems PAM ICQ Server Response Processing Vulnerability
- (mirrored at) Bugtraq: Internet Security Systems PAM ICQ Server Response Processing Vulnerability
- ISS: Vulnerability in ICQ Parsing in ISS Products
- Symantec: W32.Witty.Worm
- Worm code and function
- LURHQ: Witty Worm Analysis
- (via Bugtraq) Kostya Kortchinsky: Black Ice Worm Disassembly
- ISS vulnerability
- UCSD Network Telescope Background
- Previous Internet Worm Studies
- The Spread of the Code-Red Worm
- Code-Red: a case study on the spread and victims of an Internet worm
- The Spread of the Sapphire/Slammer Worm (With Vern Paxson (ICIR & LBNL), Stefan Savage (UCSD CSE), Stuart Staniford (Silicon Defense), and Nicholas Weaver (Silicon Defense and UC Berkeley EECS)
- Other Network Telescope Studies
About the Authors:
The network telescope and associated security efforts are a joint project of the UCSD Computer Science and Engineering Department and the Cooperative Association for Internet Data Analysis. Colleen Shannon is a Senior Security Researcher at the Cooperative Association for Internet Data Analysis (CAIDA) at the San Diego Supercomputer Center (SDSC) at the University of California, San Diego (UCSD). David Moore is the Assistant Director of CAIDA and Ph.D. Candidate in the UCSD Computer Science Department.
This work was sponsored by:
Grants from Cisco Systems, the National Science Foundation (NSF), the Defense Advanced Research Projects Agency (DARPA), the Department of Homeland Security (DHS), and CAIDA members.
Additional Content
/archive/witty/blackiceworm/