

Summary statistics for all Archipelago monitors
List of monitor-specific summaries
Path Lengths
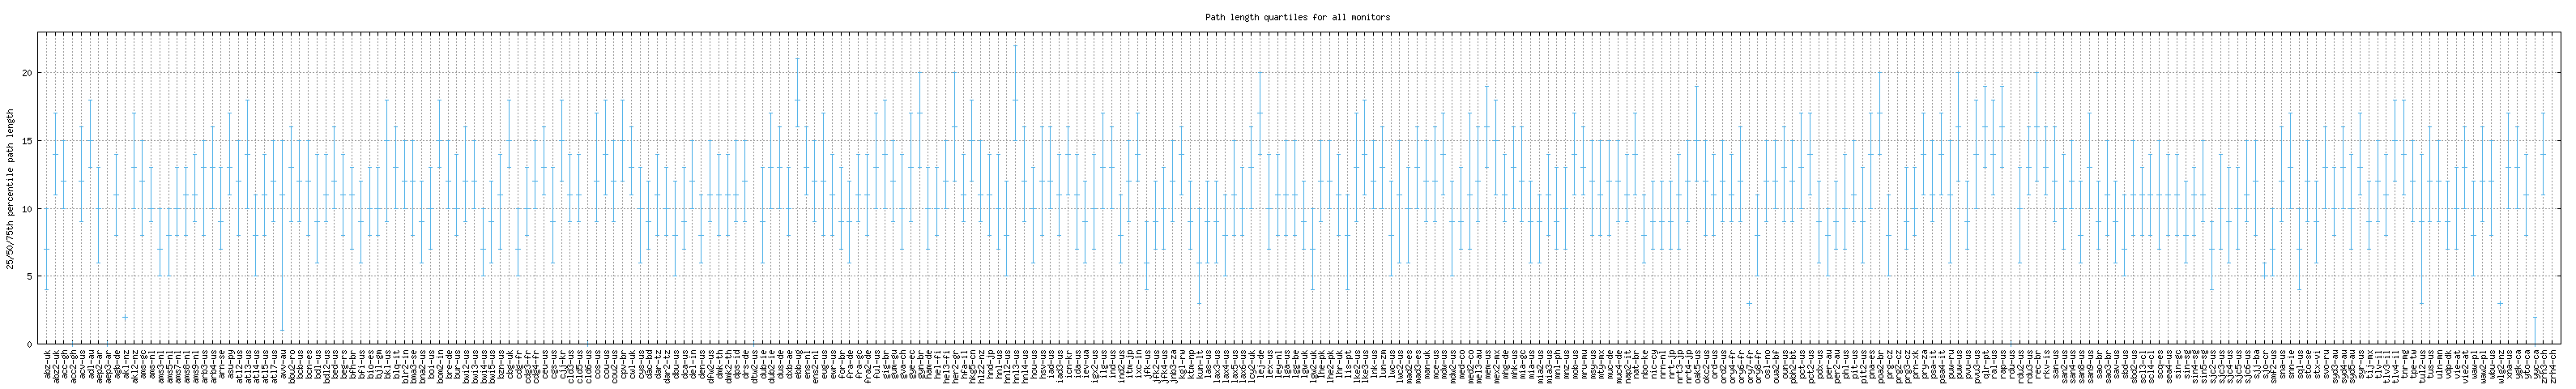
This graph shows the 25th, 50th, and 75th percentiles of path length to responding destinations for all Ark monitors, in alphabetical order.
Motivation
By comparing the quartiles of path length, we can roughly see each monitor's average distance to their destinations. This gives us a sense of how closely connected a monitor is to the 'core' of the Internet.
Background
The path length is defined as the number of IP hops required to reach the destination from the Ark monitor. This includes any routing loops that occur during the probing. These values are only used when a response has been received from the destination. In other words, incomplete paths are ignored for the purposes of determining path length.
Analysis
We see path length regularly varying between 10 and 25, because destinations are selected from all across the address space. If the quartile values are significantly higher than this, the monitor might be several hops away from a centrally-connected router, or there might be a large routing loop causing paths to be unnecessarily lengthened.
AS Path Lengths
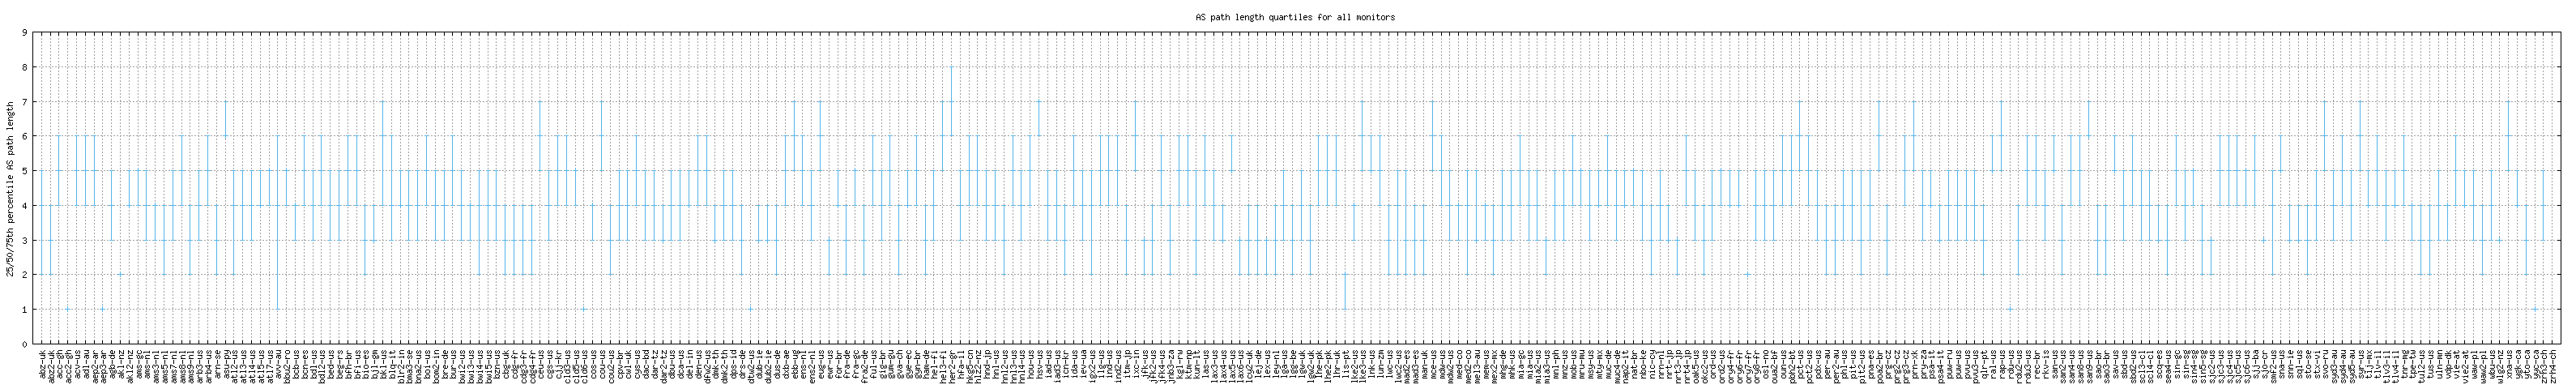
This graph shows the 25th, 50th, and 75th percentiles of AS path length to responding destinations for all Ark monitors, in alphabetical order.
Motivation
By comparing the quartiles of AS path length, we can see roughly how many ASes are between the monitors and their destinations. This can indicate how closely connected a monitor is to the 'core' of the Internet.
Background
The path length is defined as the number of ASes a probe transits to reach the destination from the Ark monitor. These values are only used when a response has been received from the destination. In other words, incomplete paths are ignored for the purposes of determining AS path length.
Analysis
We see AS path length varying between 2 and 8, due to the variance in peering policies for different monitor locations. If the quartile values are significantly higher than this, the monitor might be going through several different organizations before its probes are distributed to their destinations.
Round Trip Times
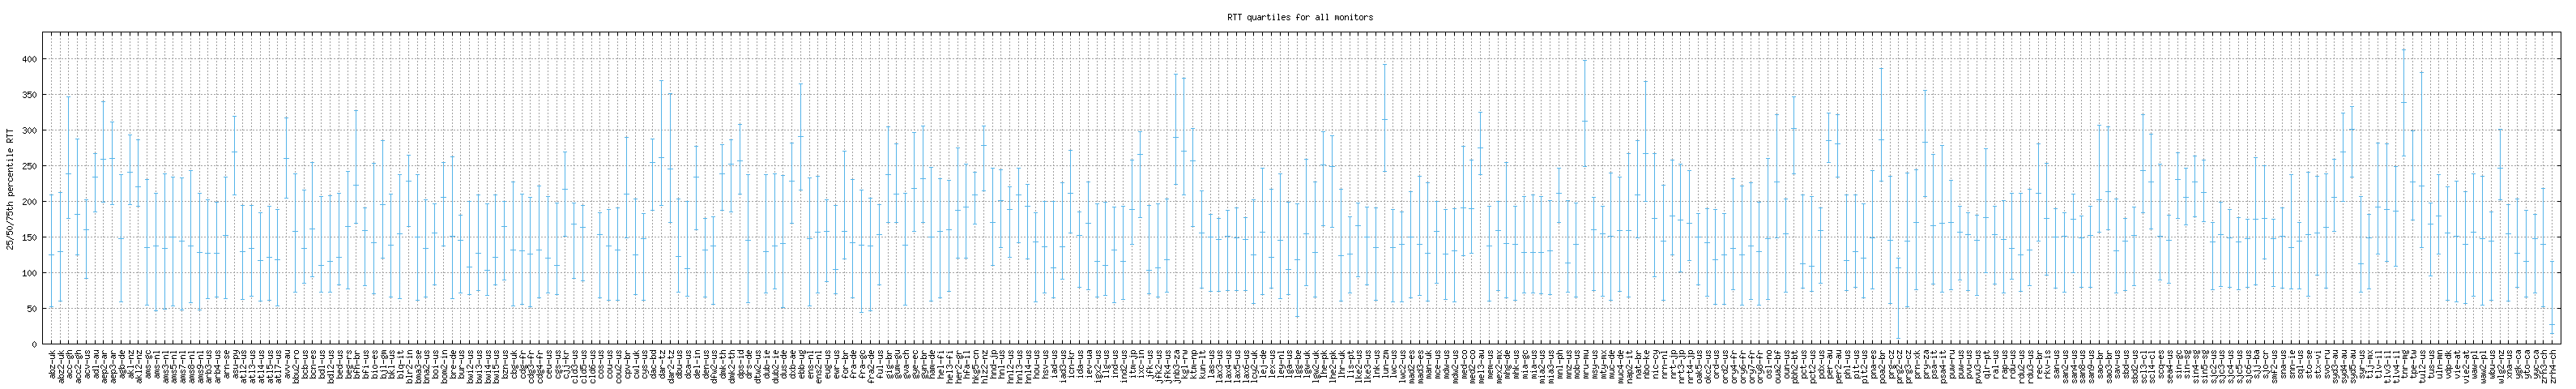
This graph shows the 25th, 50th, and 75th percentiles of round trip time (RTT) to responding destinations for all Ark monitors, in alphabetical order.
Motivation
Measuring RTT to destinations gives a different view of Ark monitor connectivity than path length. By comparing the average RTTs from different monitors, we can see which ones might have a slower link to the rest of the Internet.
Background
The round trip time of a probe is the time (in milliseconds) that it takes for a packet to be sent from an Ark monitor to a destination and for that destination's response to be received by the monitor. Therefore, no RTT values are recorded when a probe does not reach a destination.
Analysis
Most Ark monitors average between 100ms and 400ms for their RTT to responding destinations. When the 25th percentile is higher than that of other monitors, this generally indicates that one of the first few hops is over a slower link.