

IPv4 Census Map
Mapping the Used IPv4 Address Space
"Lost in Space" Census 2013
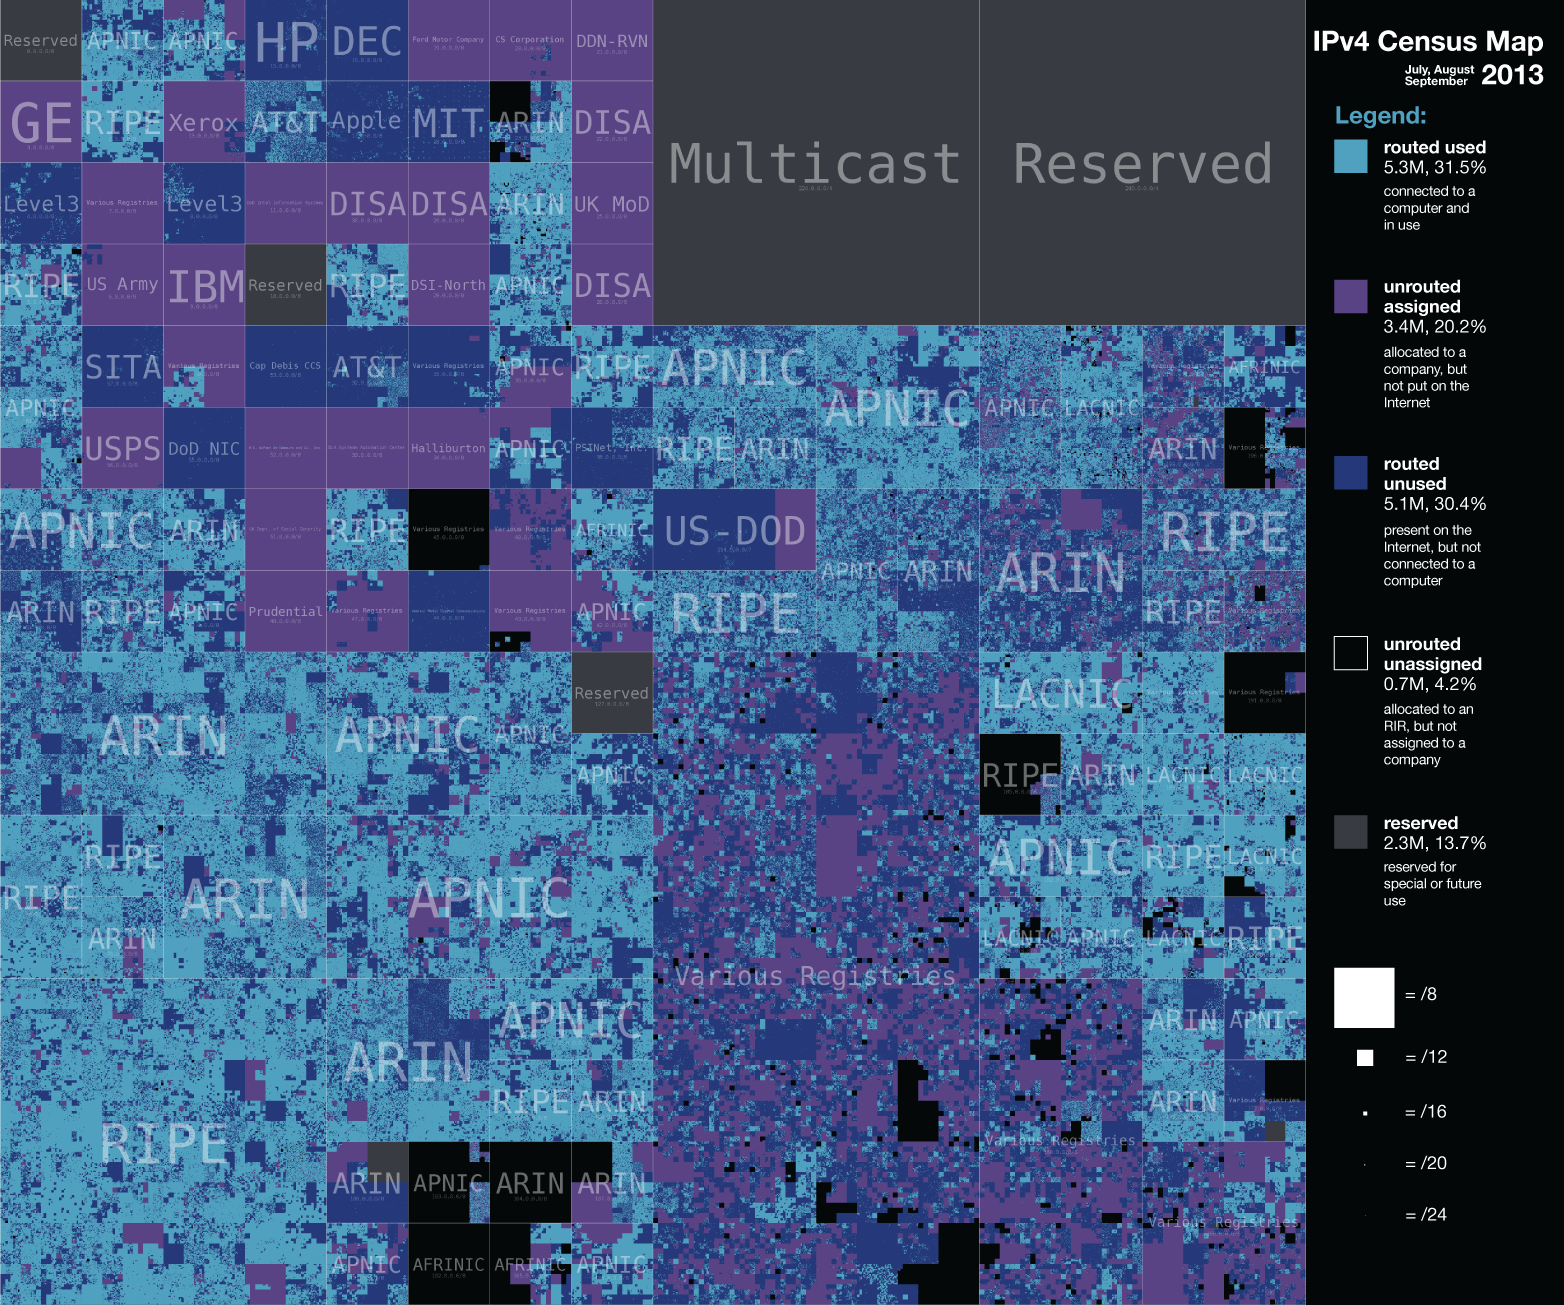
This image shows the results of an IPv4 census taken by the ETH Zurich, TU Berlin, Politecnico di Torino, and CAIDA over a three months in 2013. They combined the results they obtained through passive measurements together with data from active measurement studies, as well as measurements from BGP, and additional datasets available to researchers. From this analysis the address was divided into routed used 5.3M, routed unused 5.1M, unrouted assigned 3.4M, and available 0.7. [ futher details, poster ]
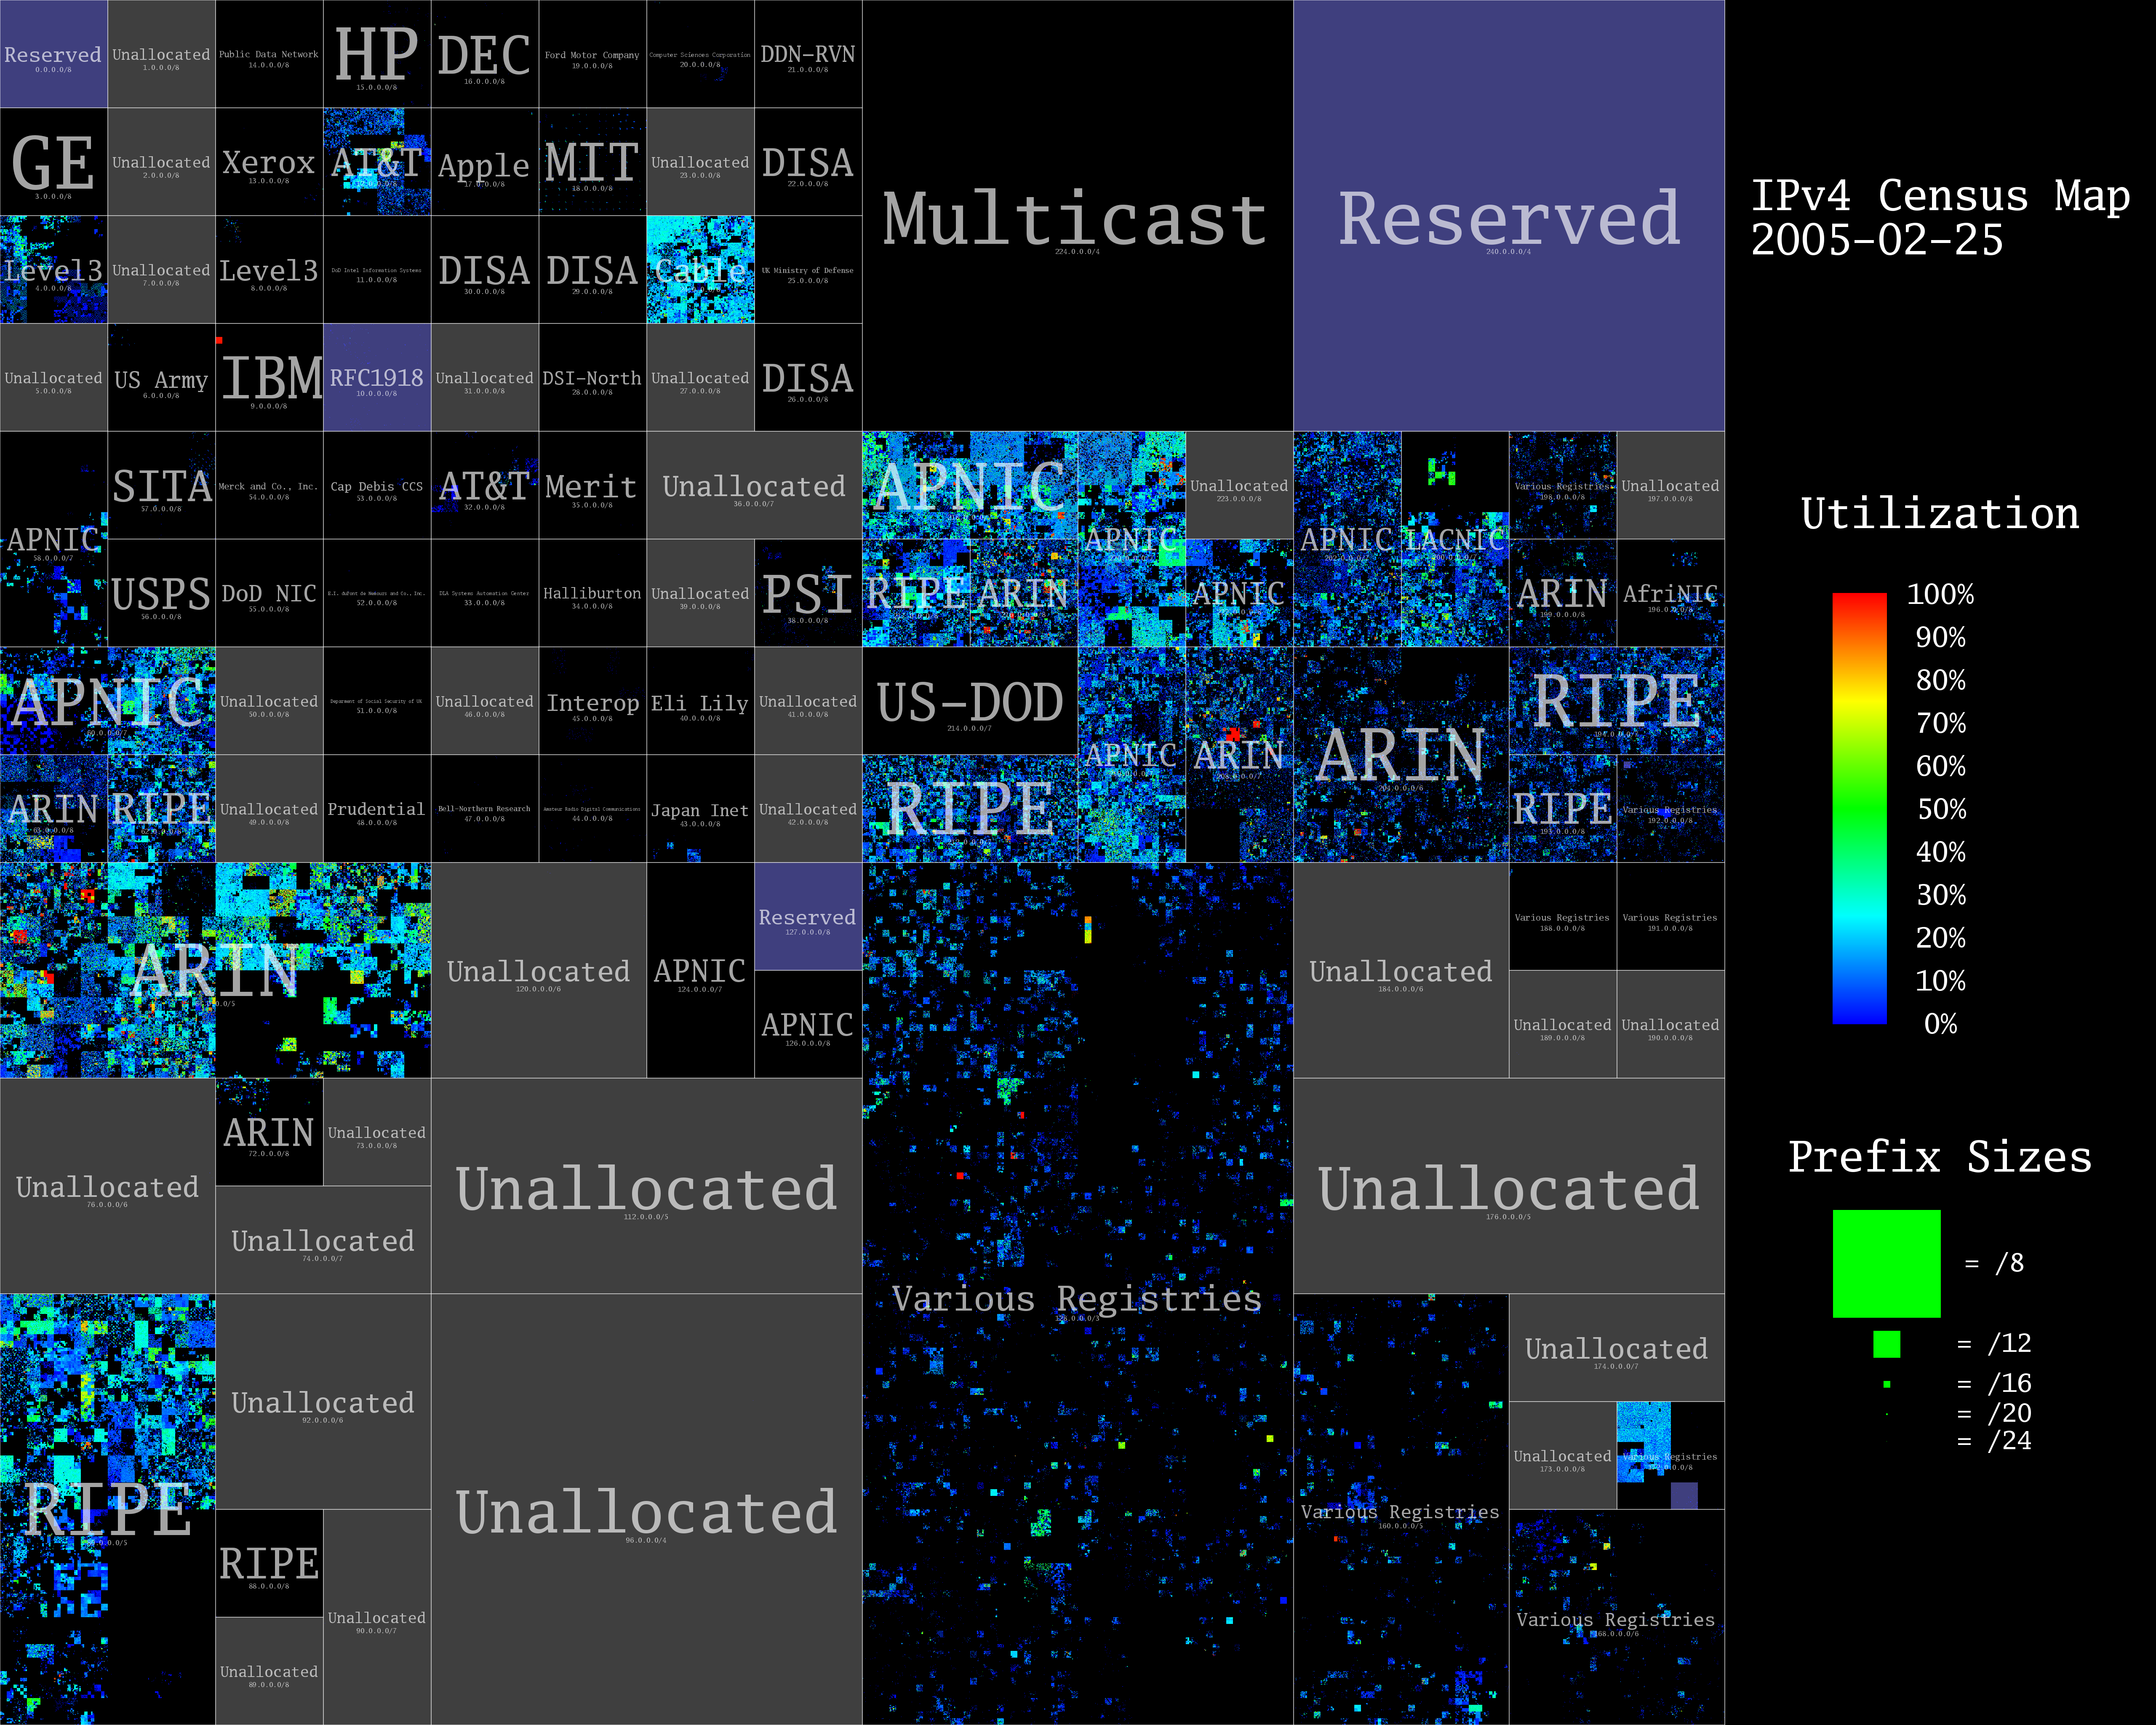
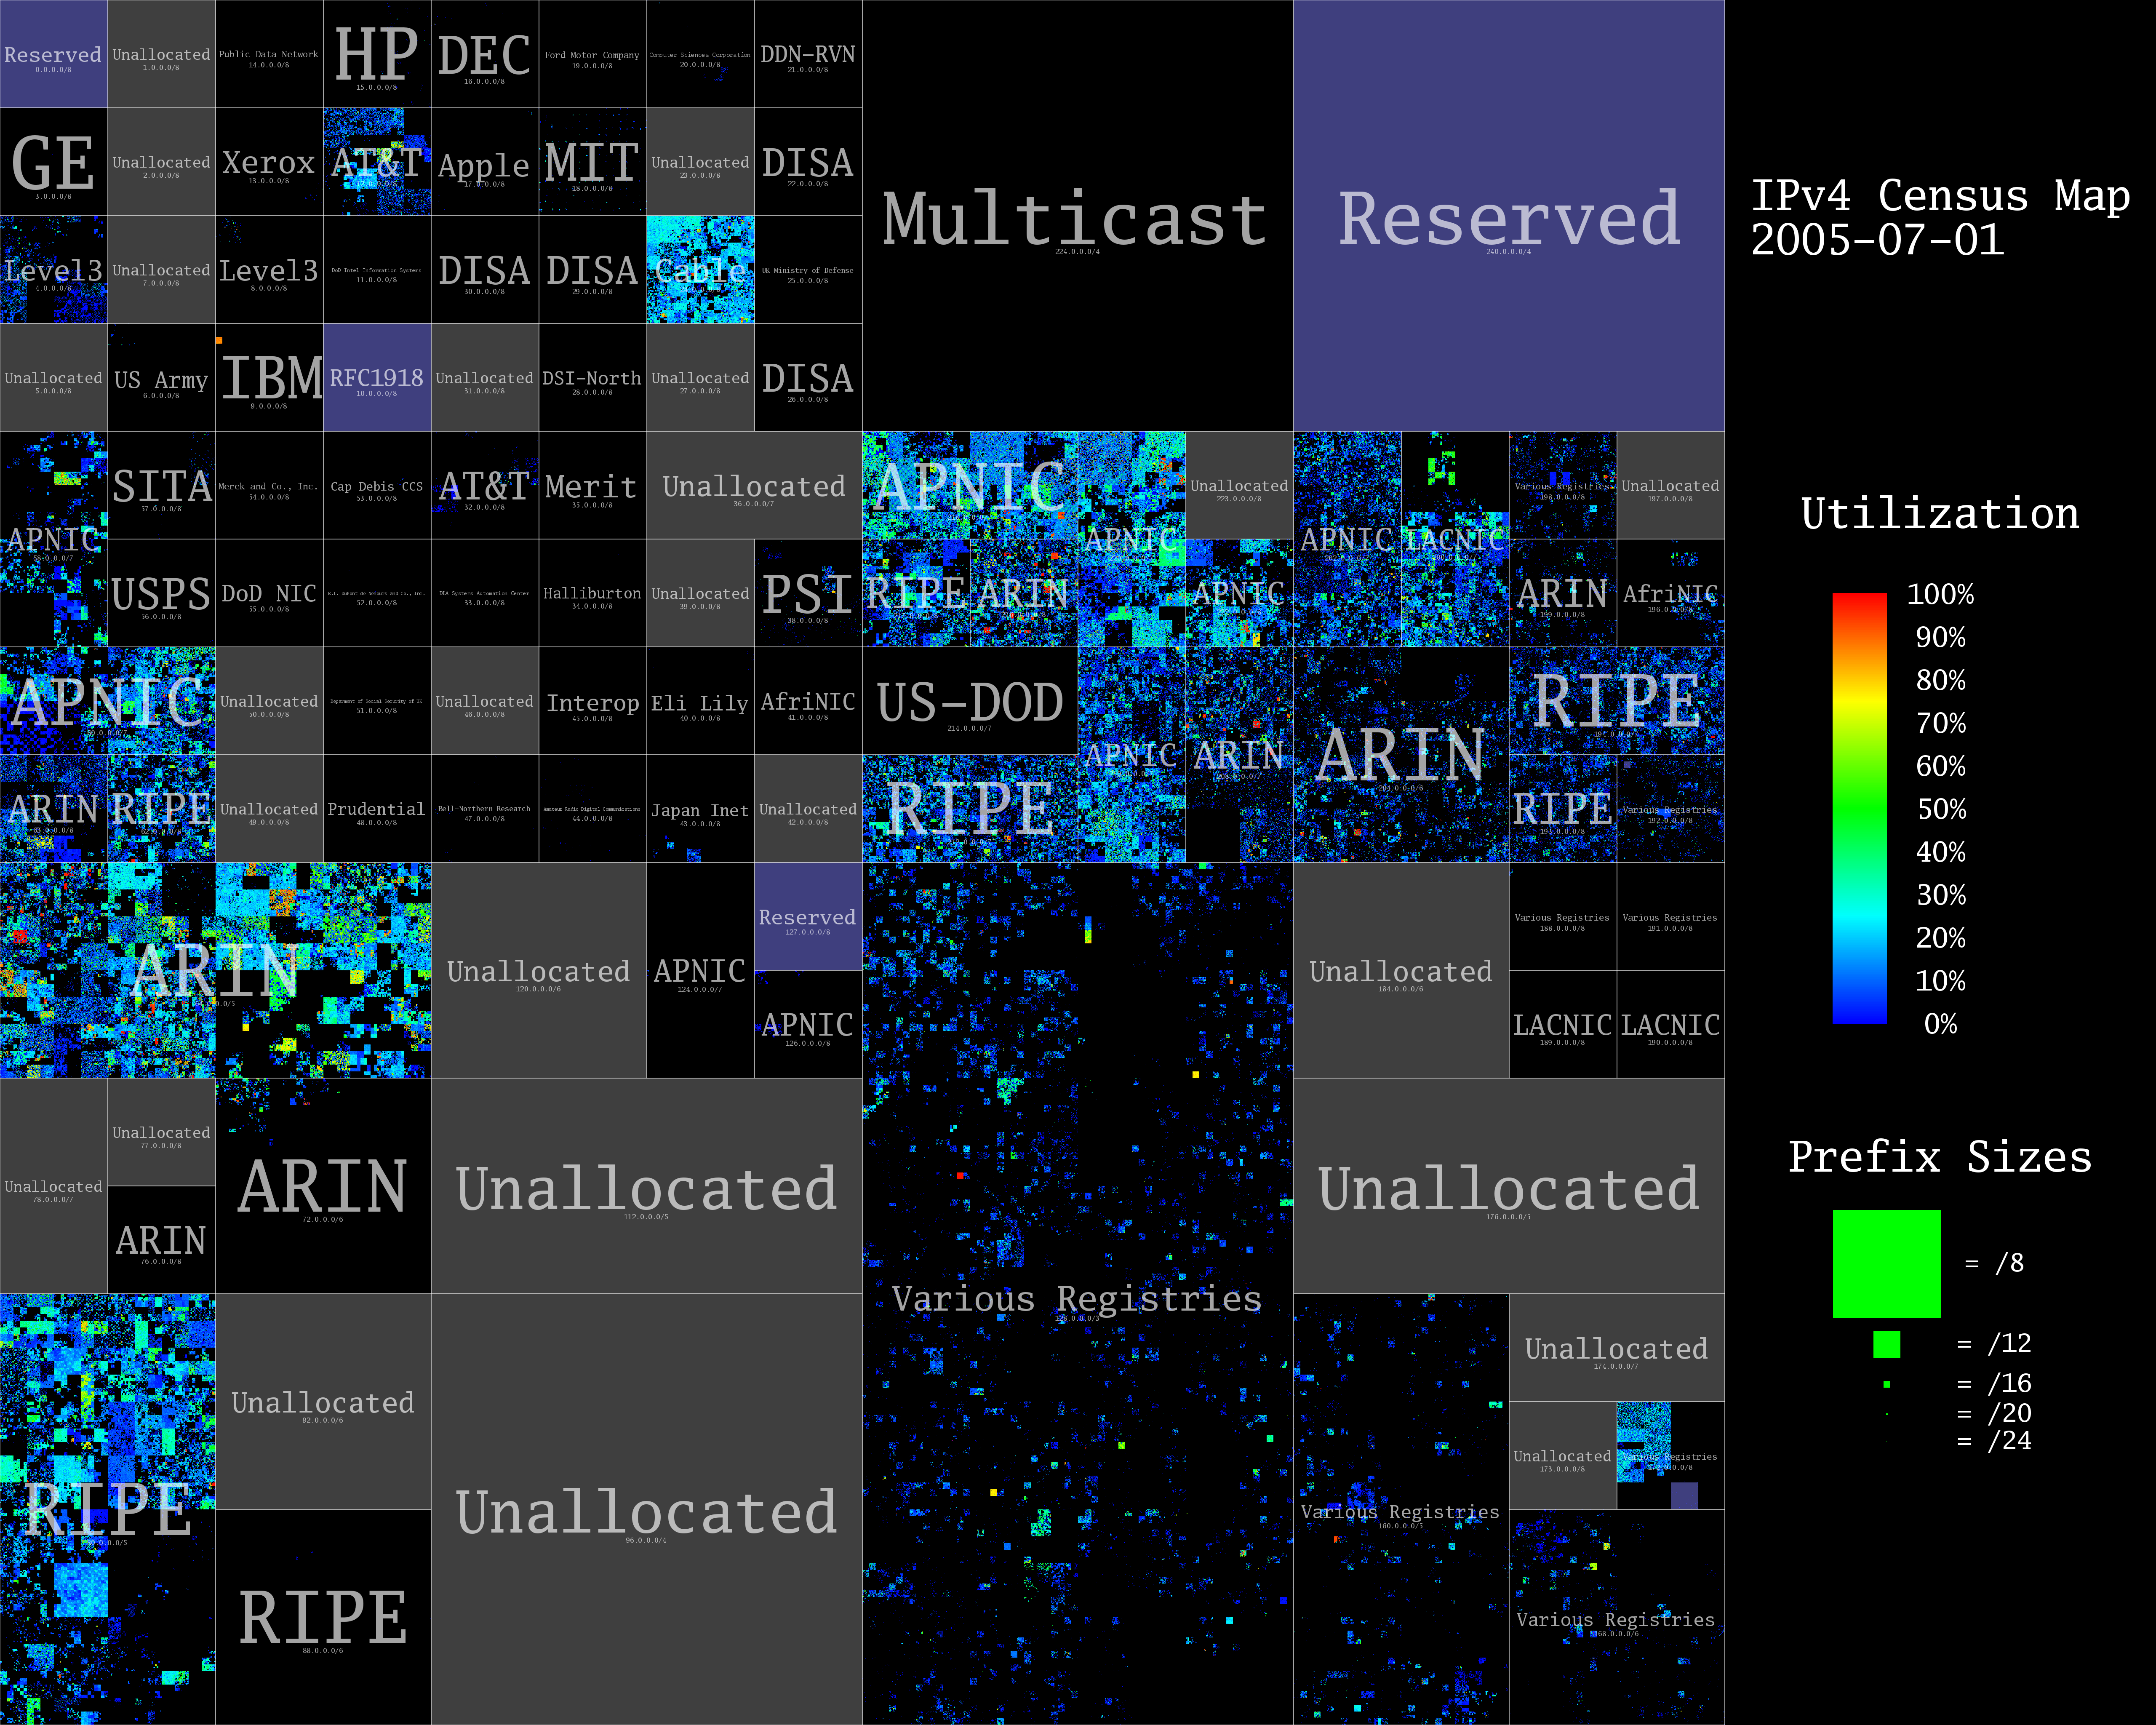
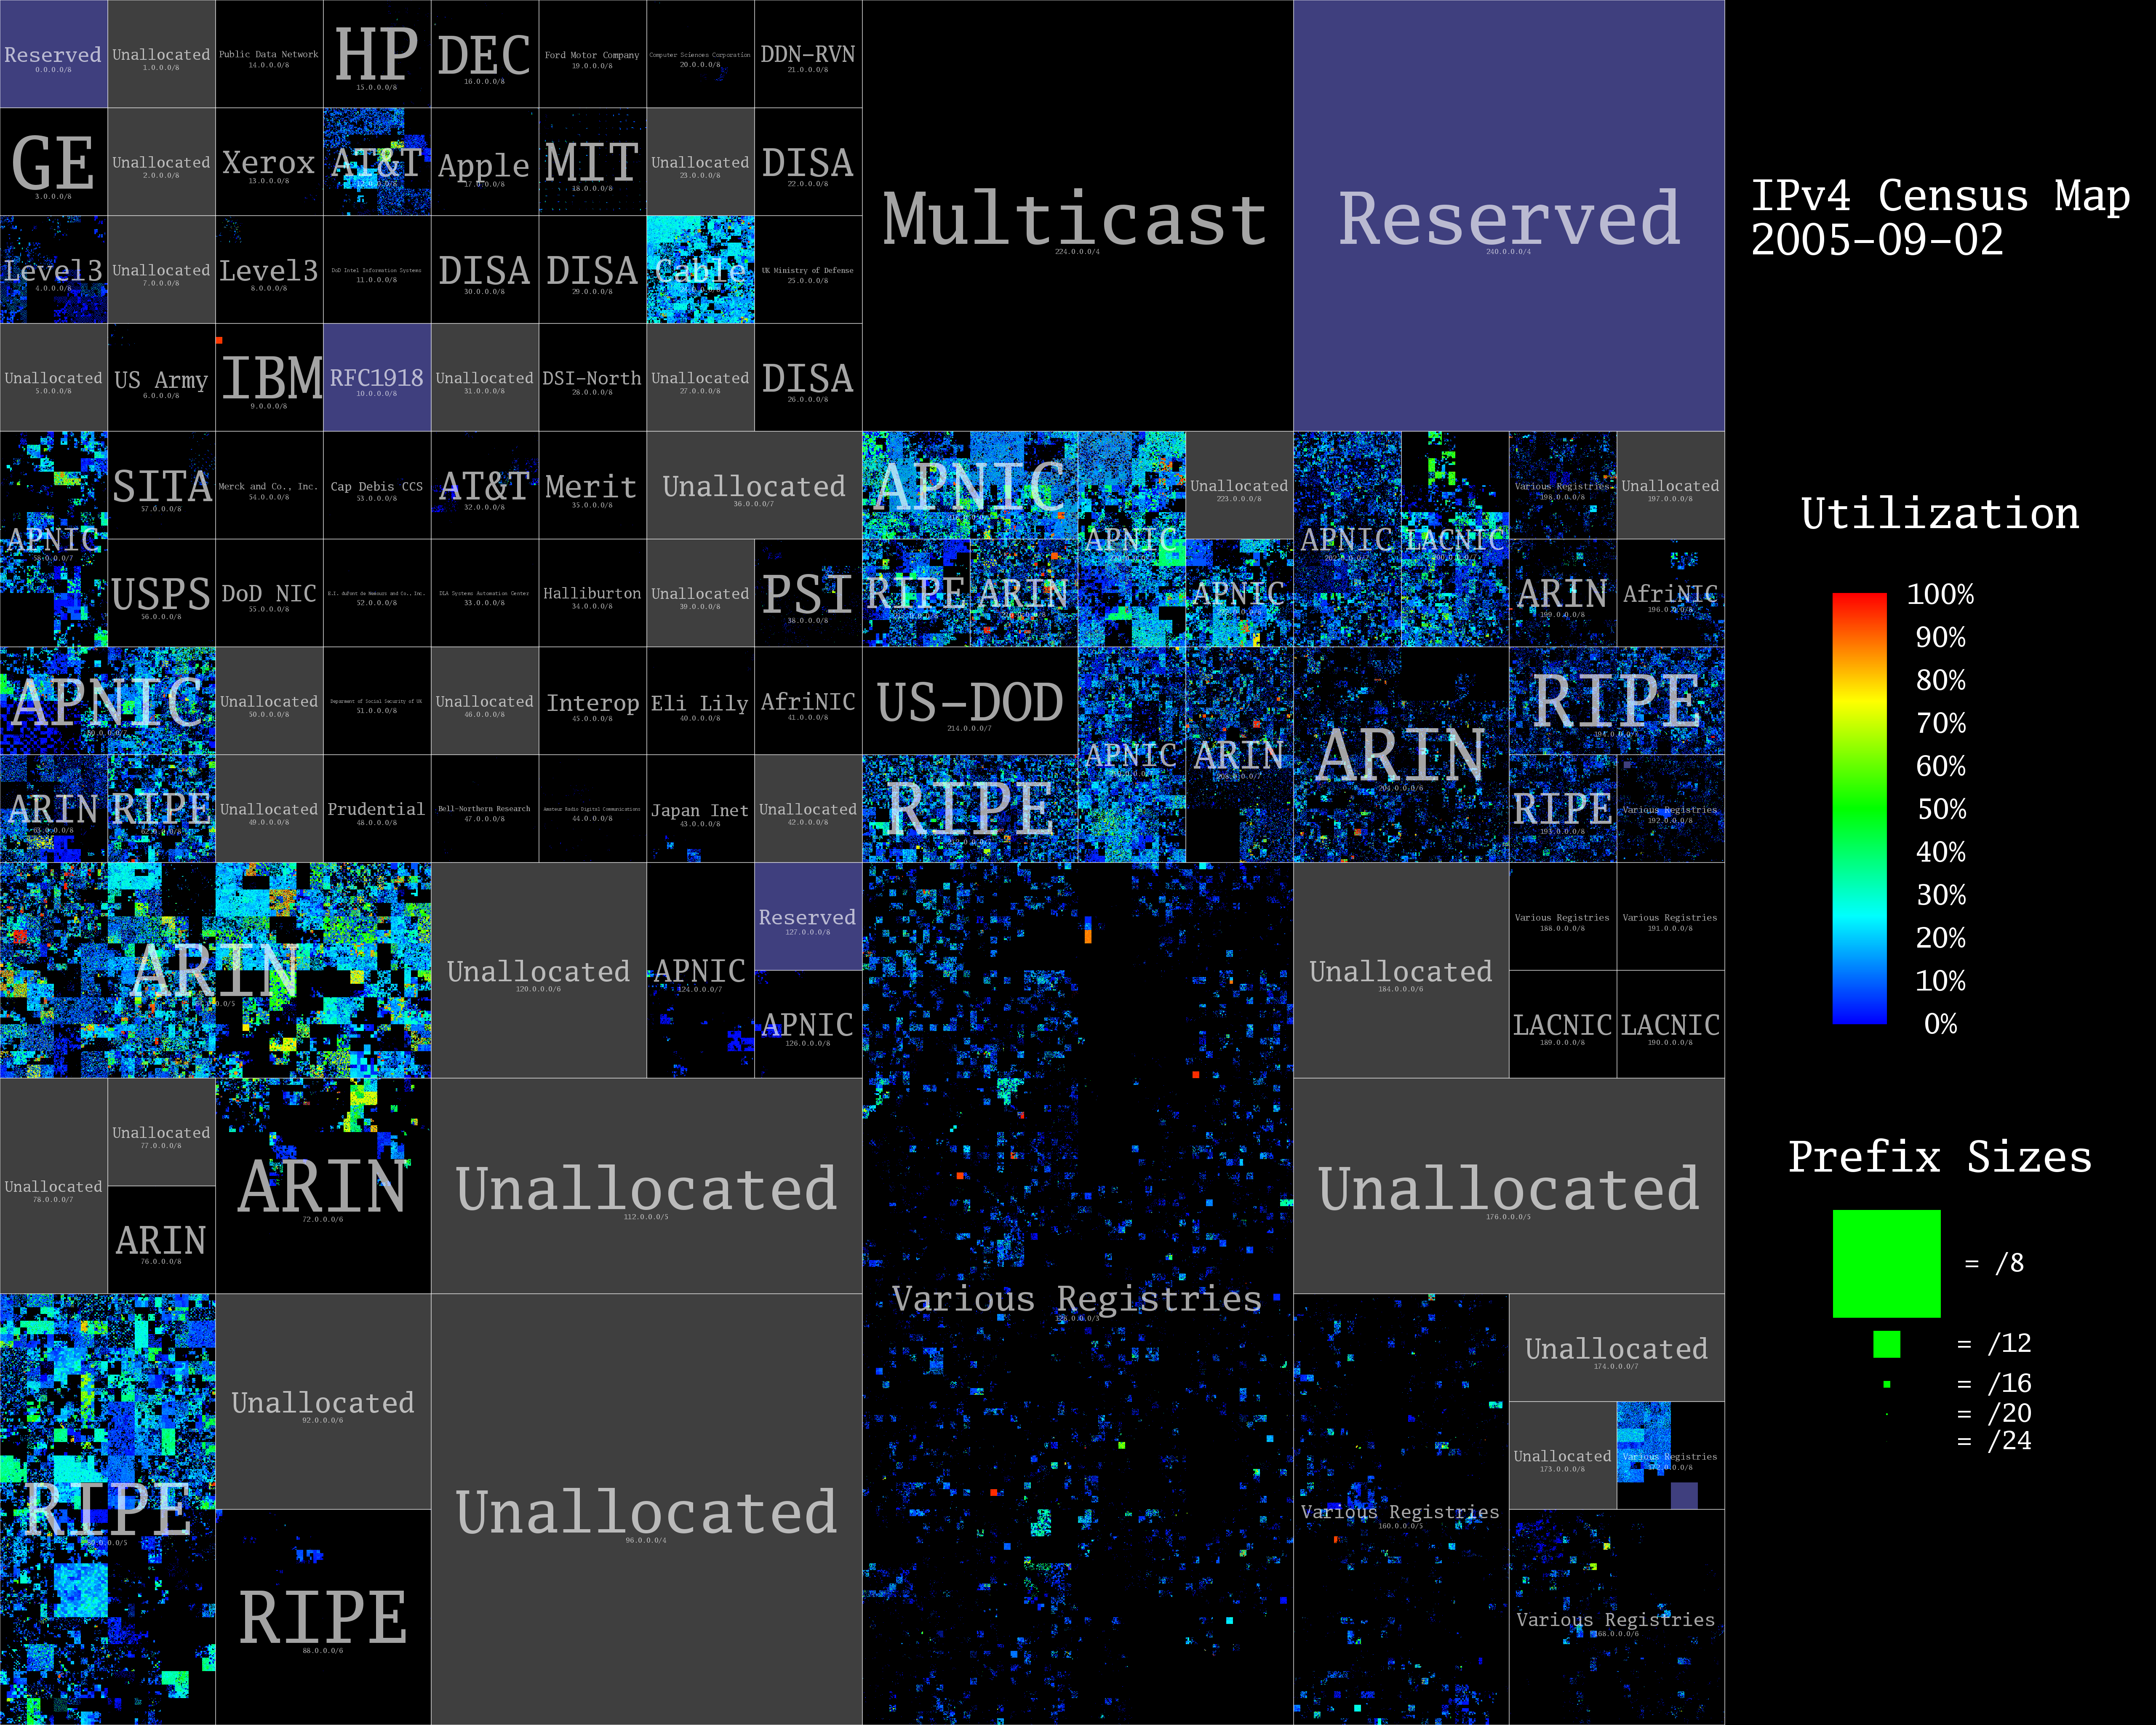
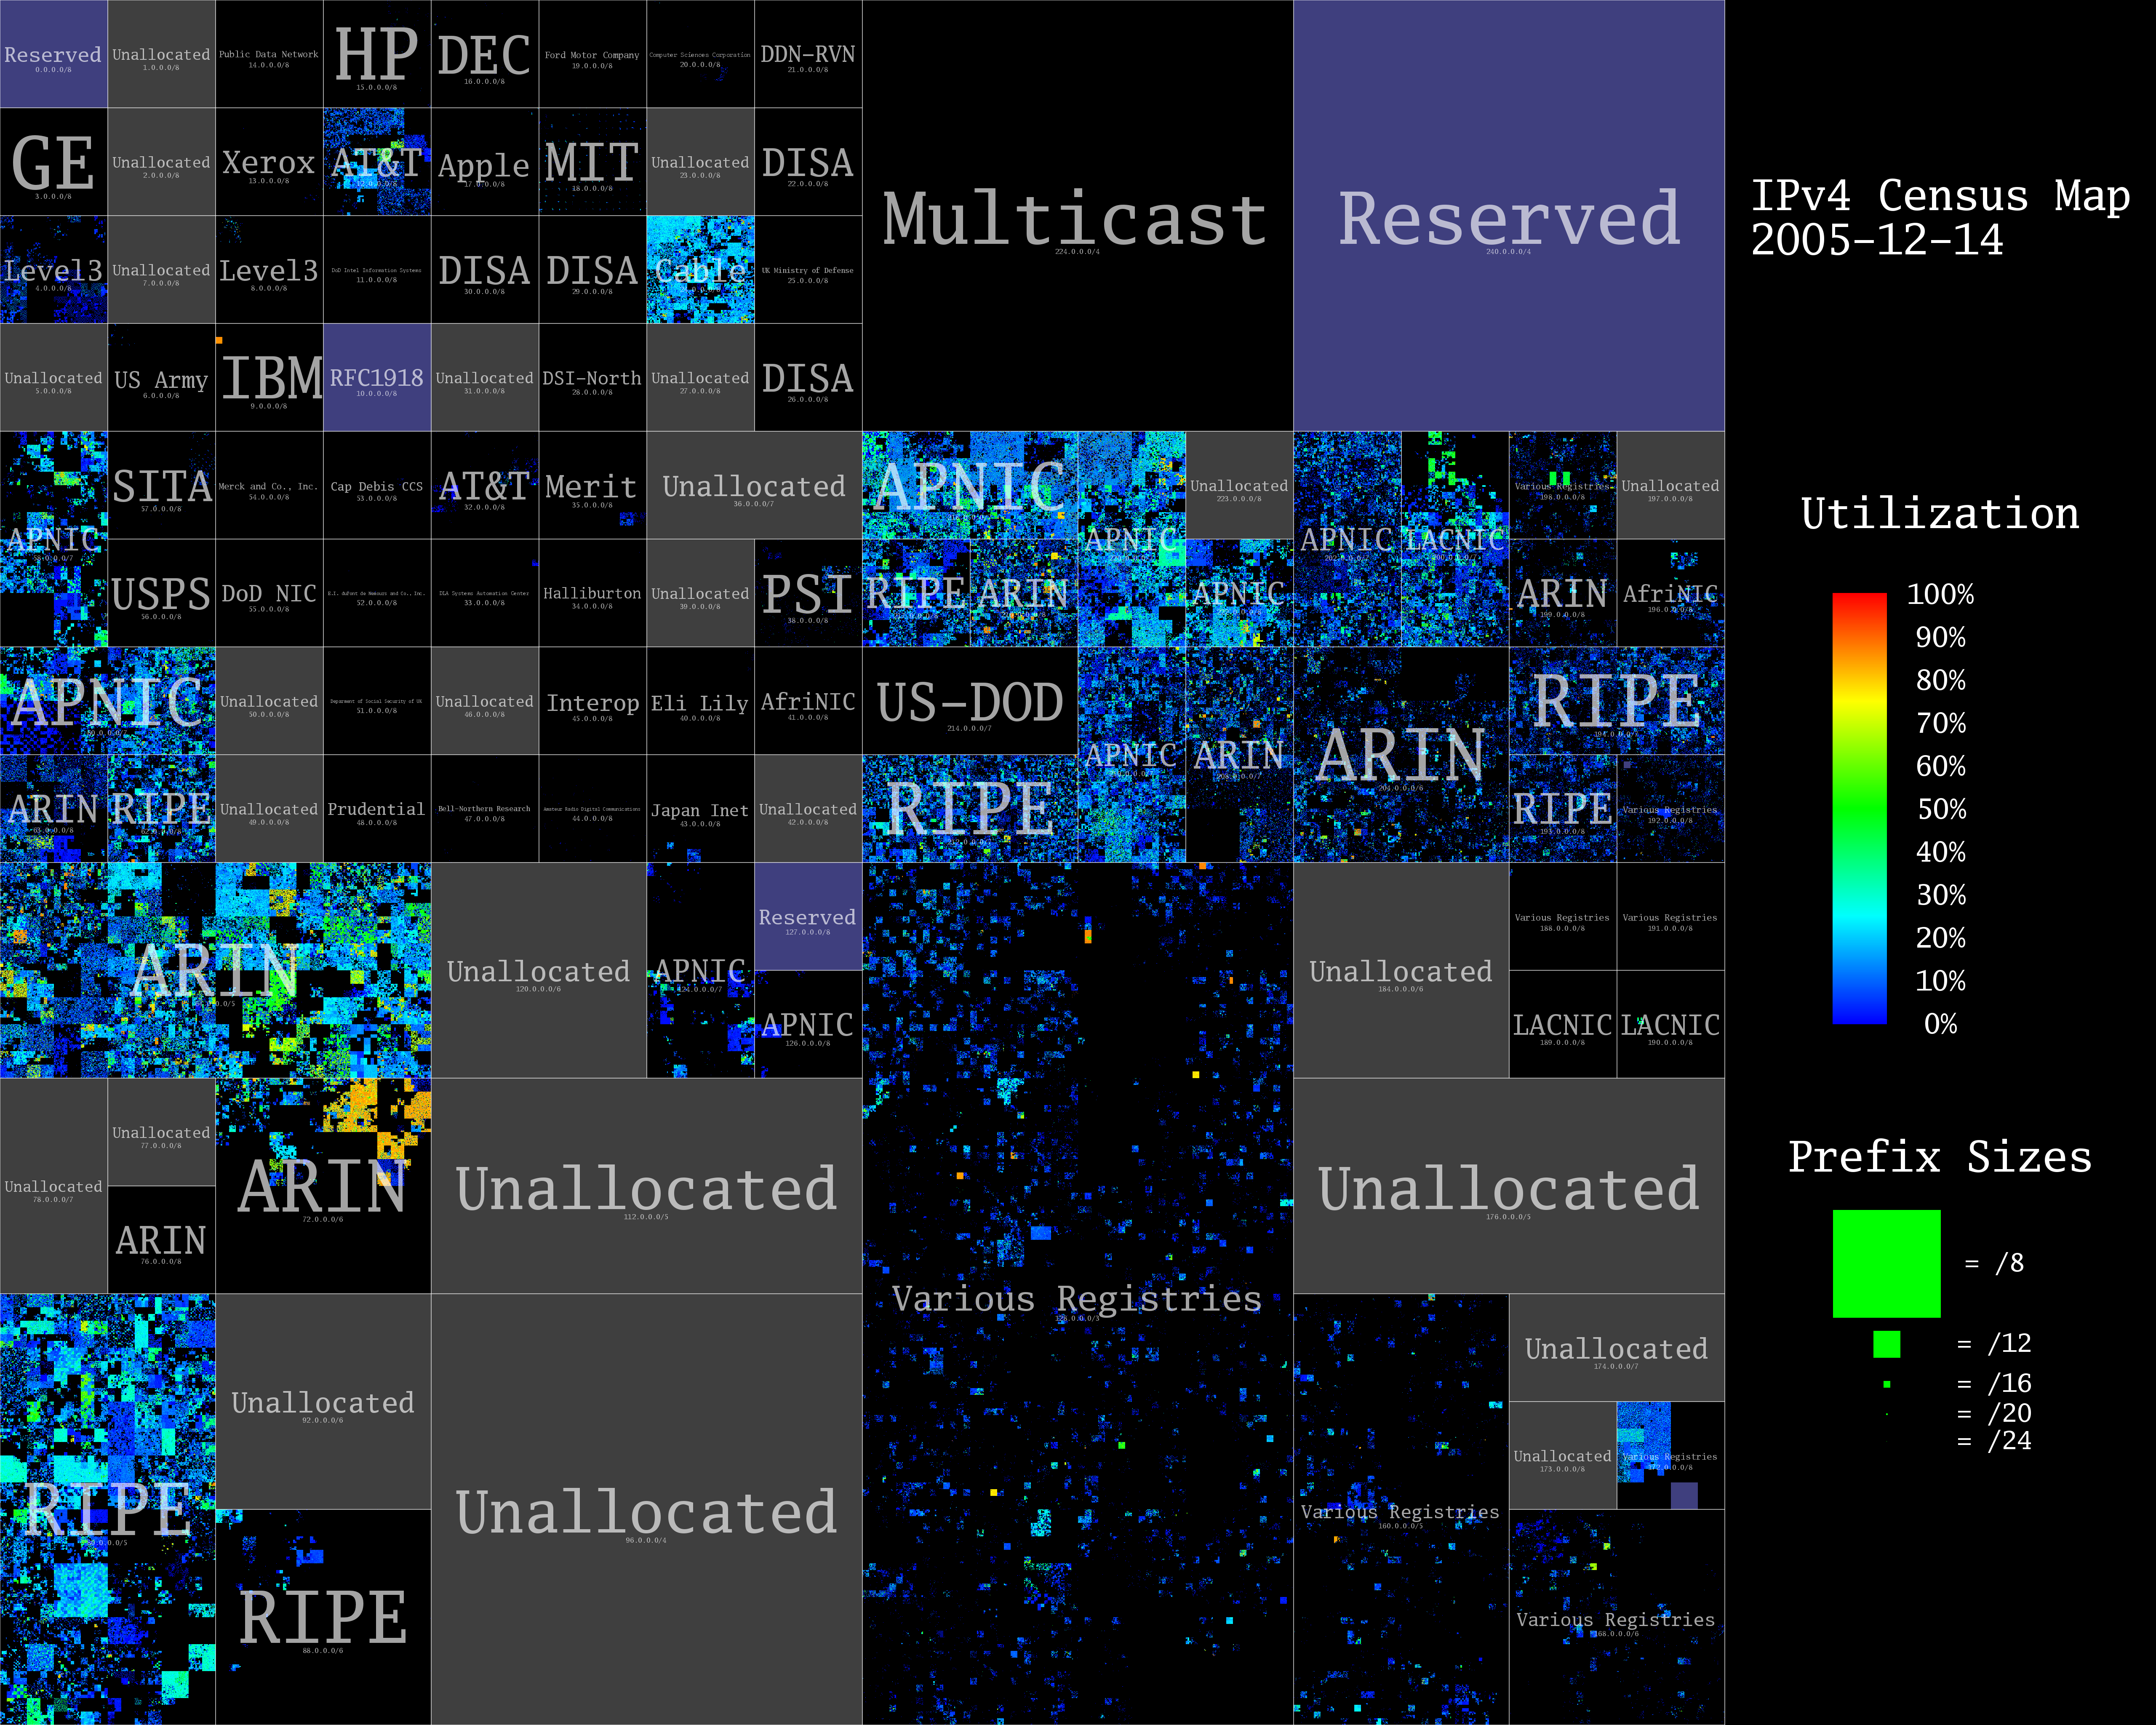
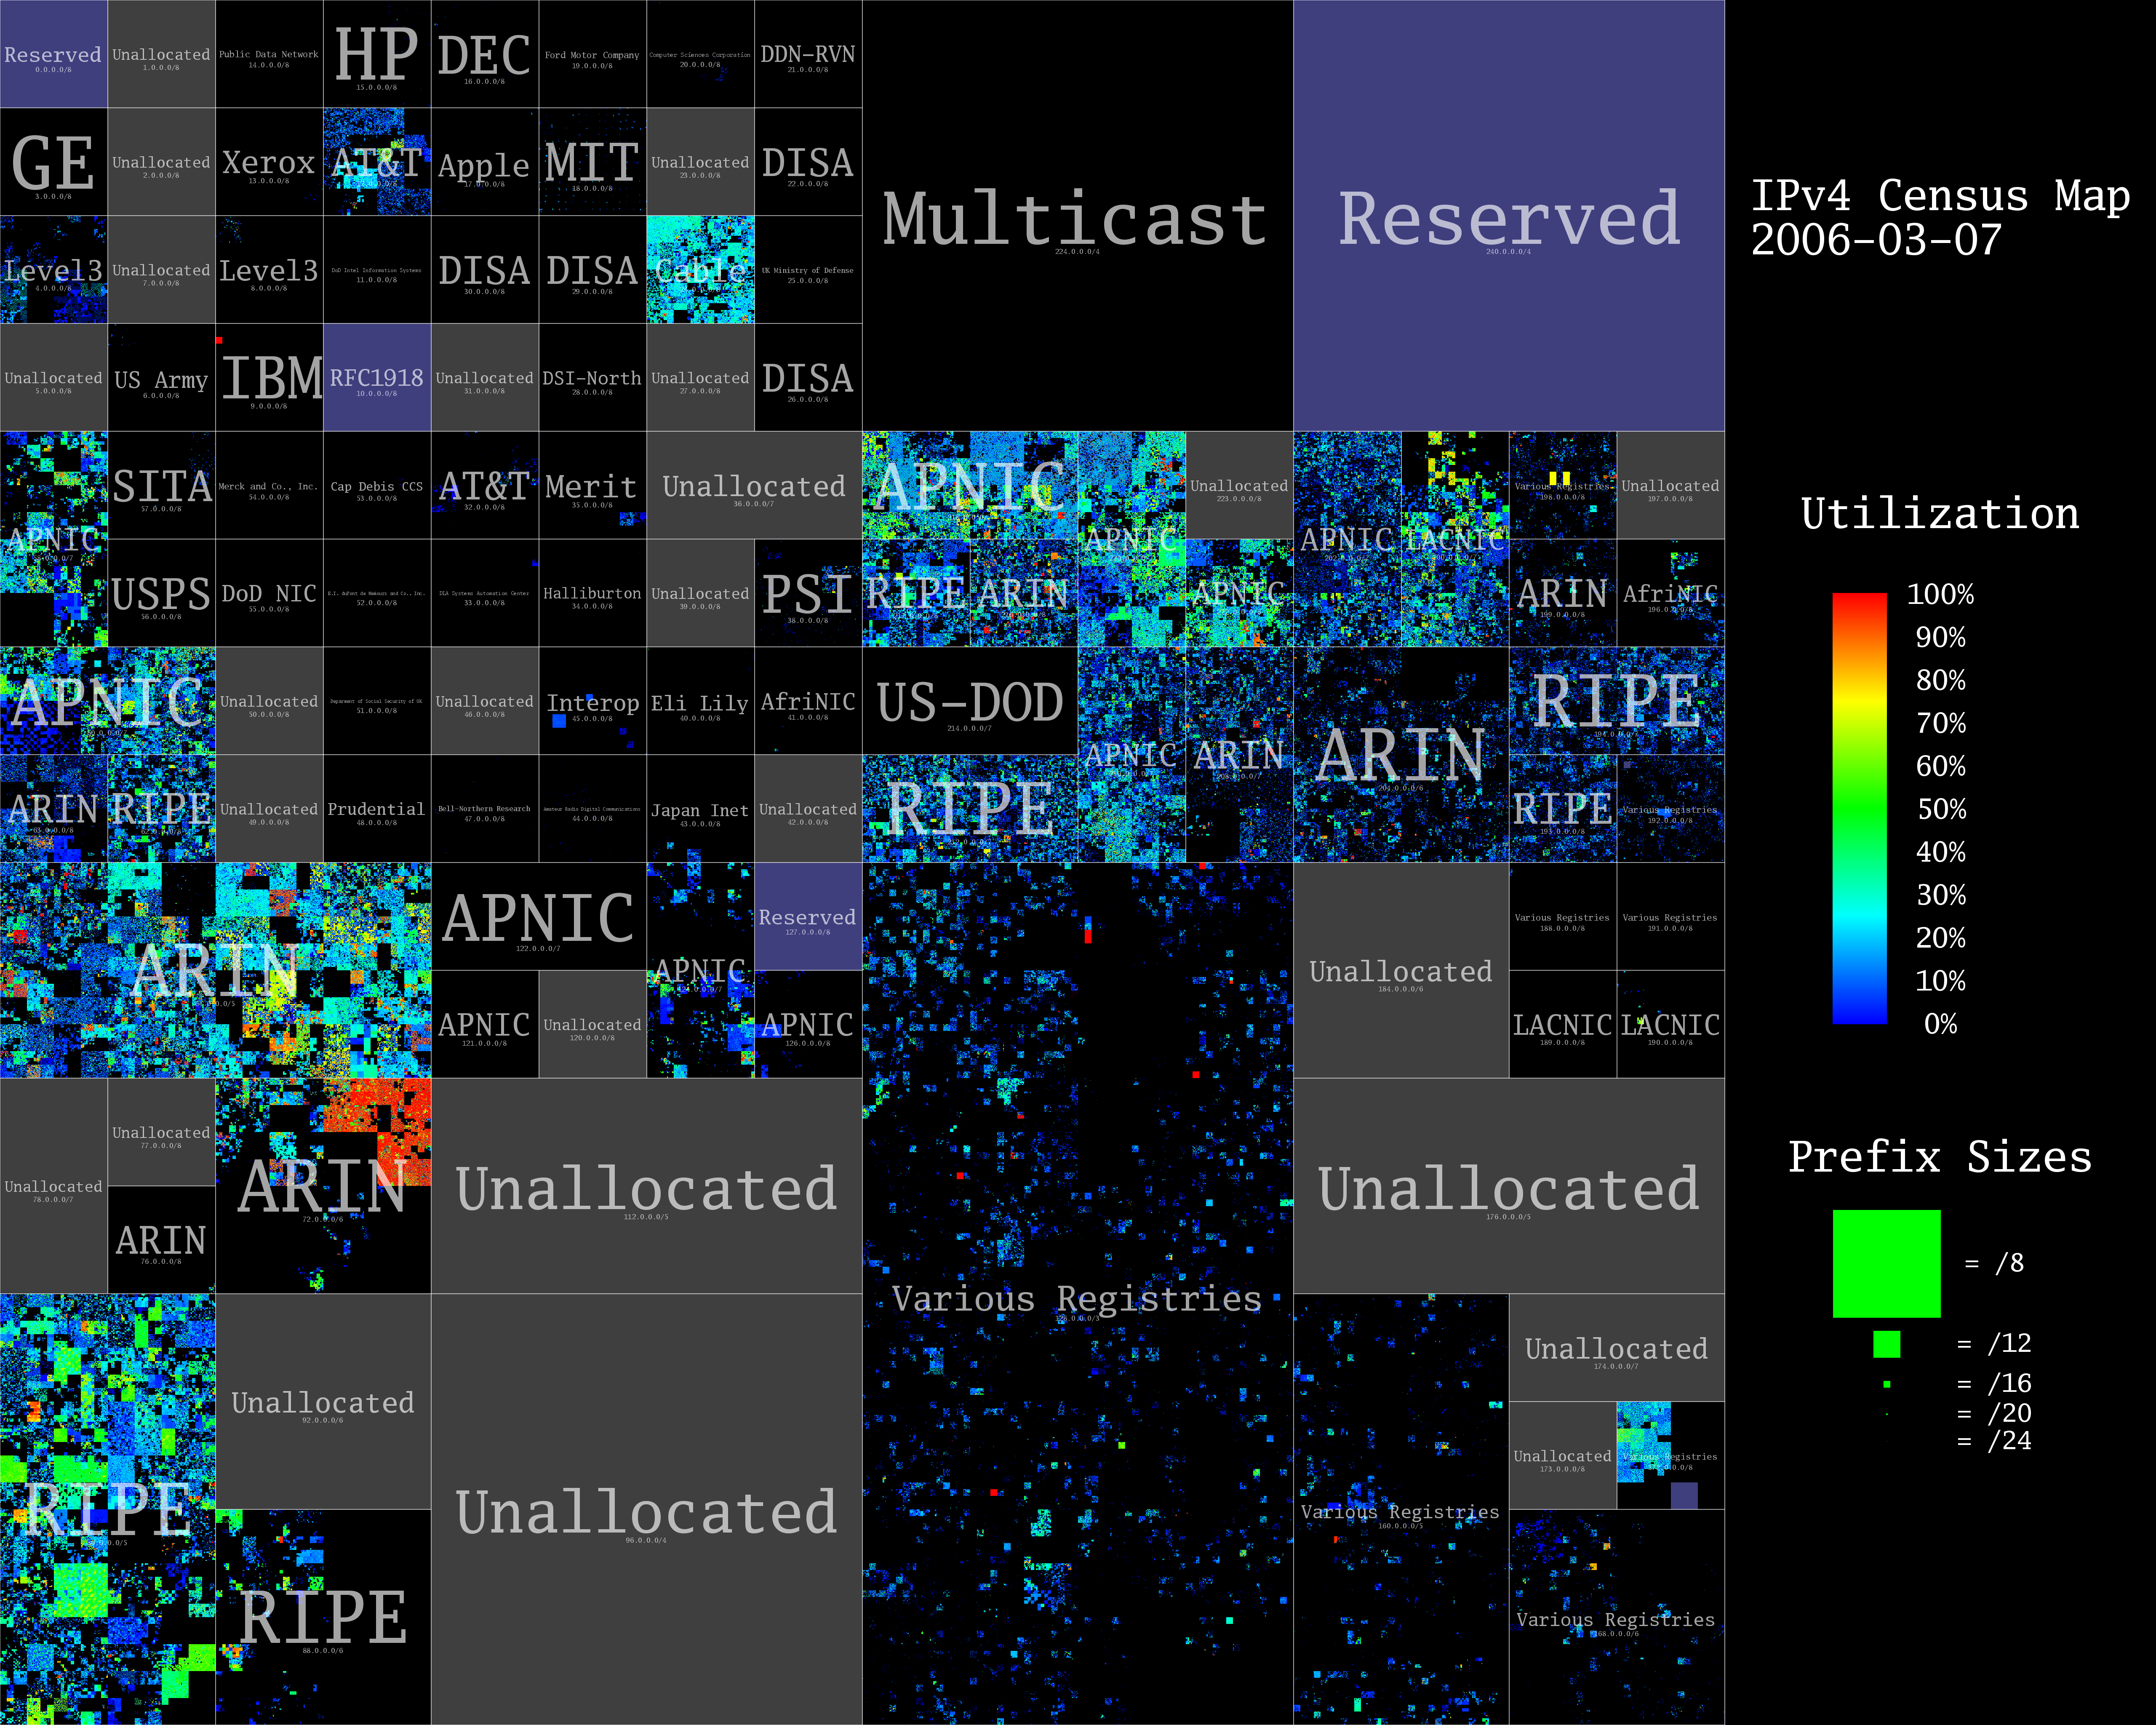
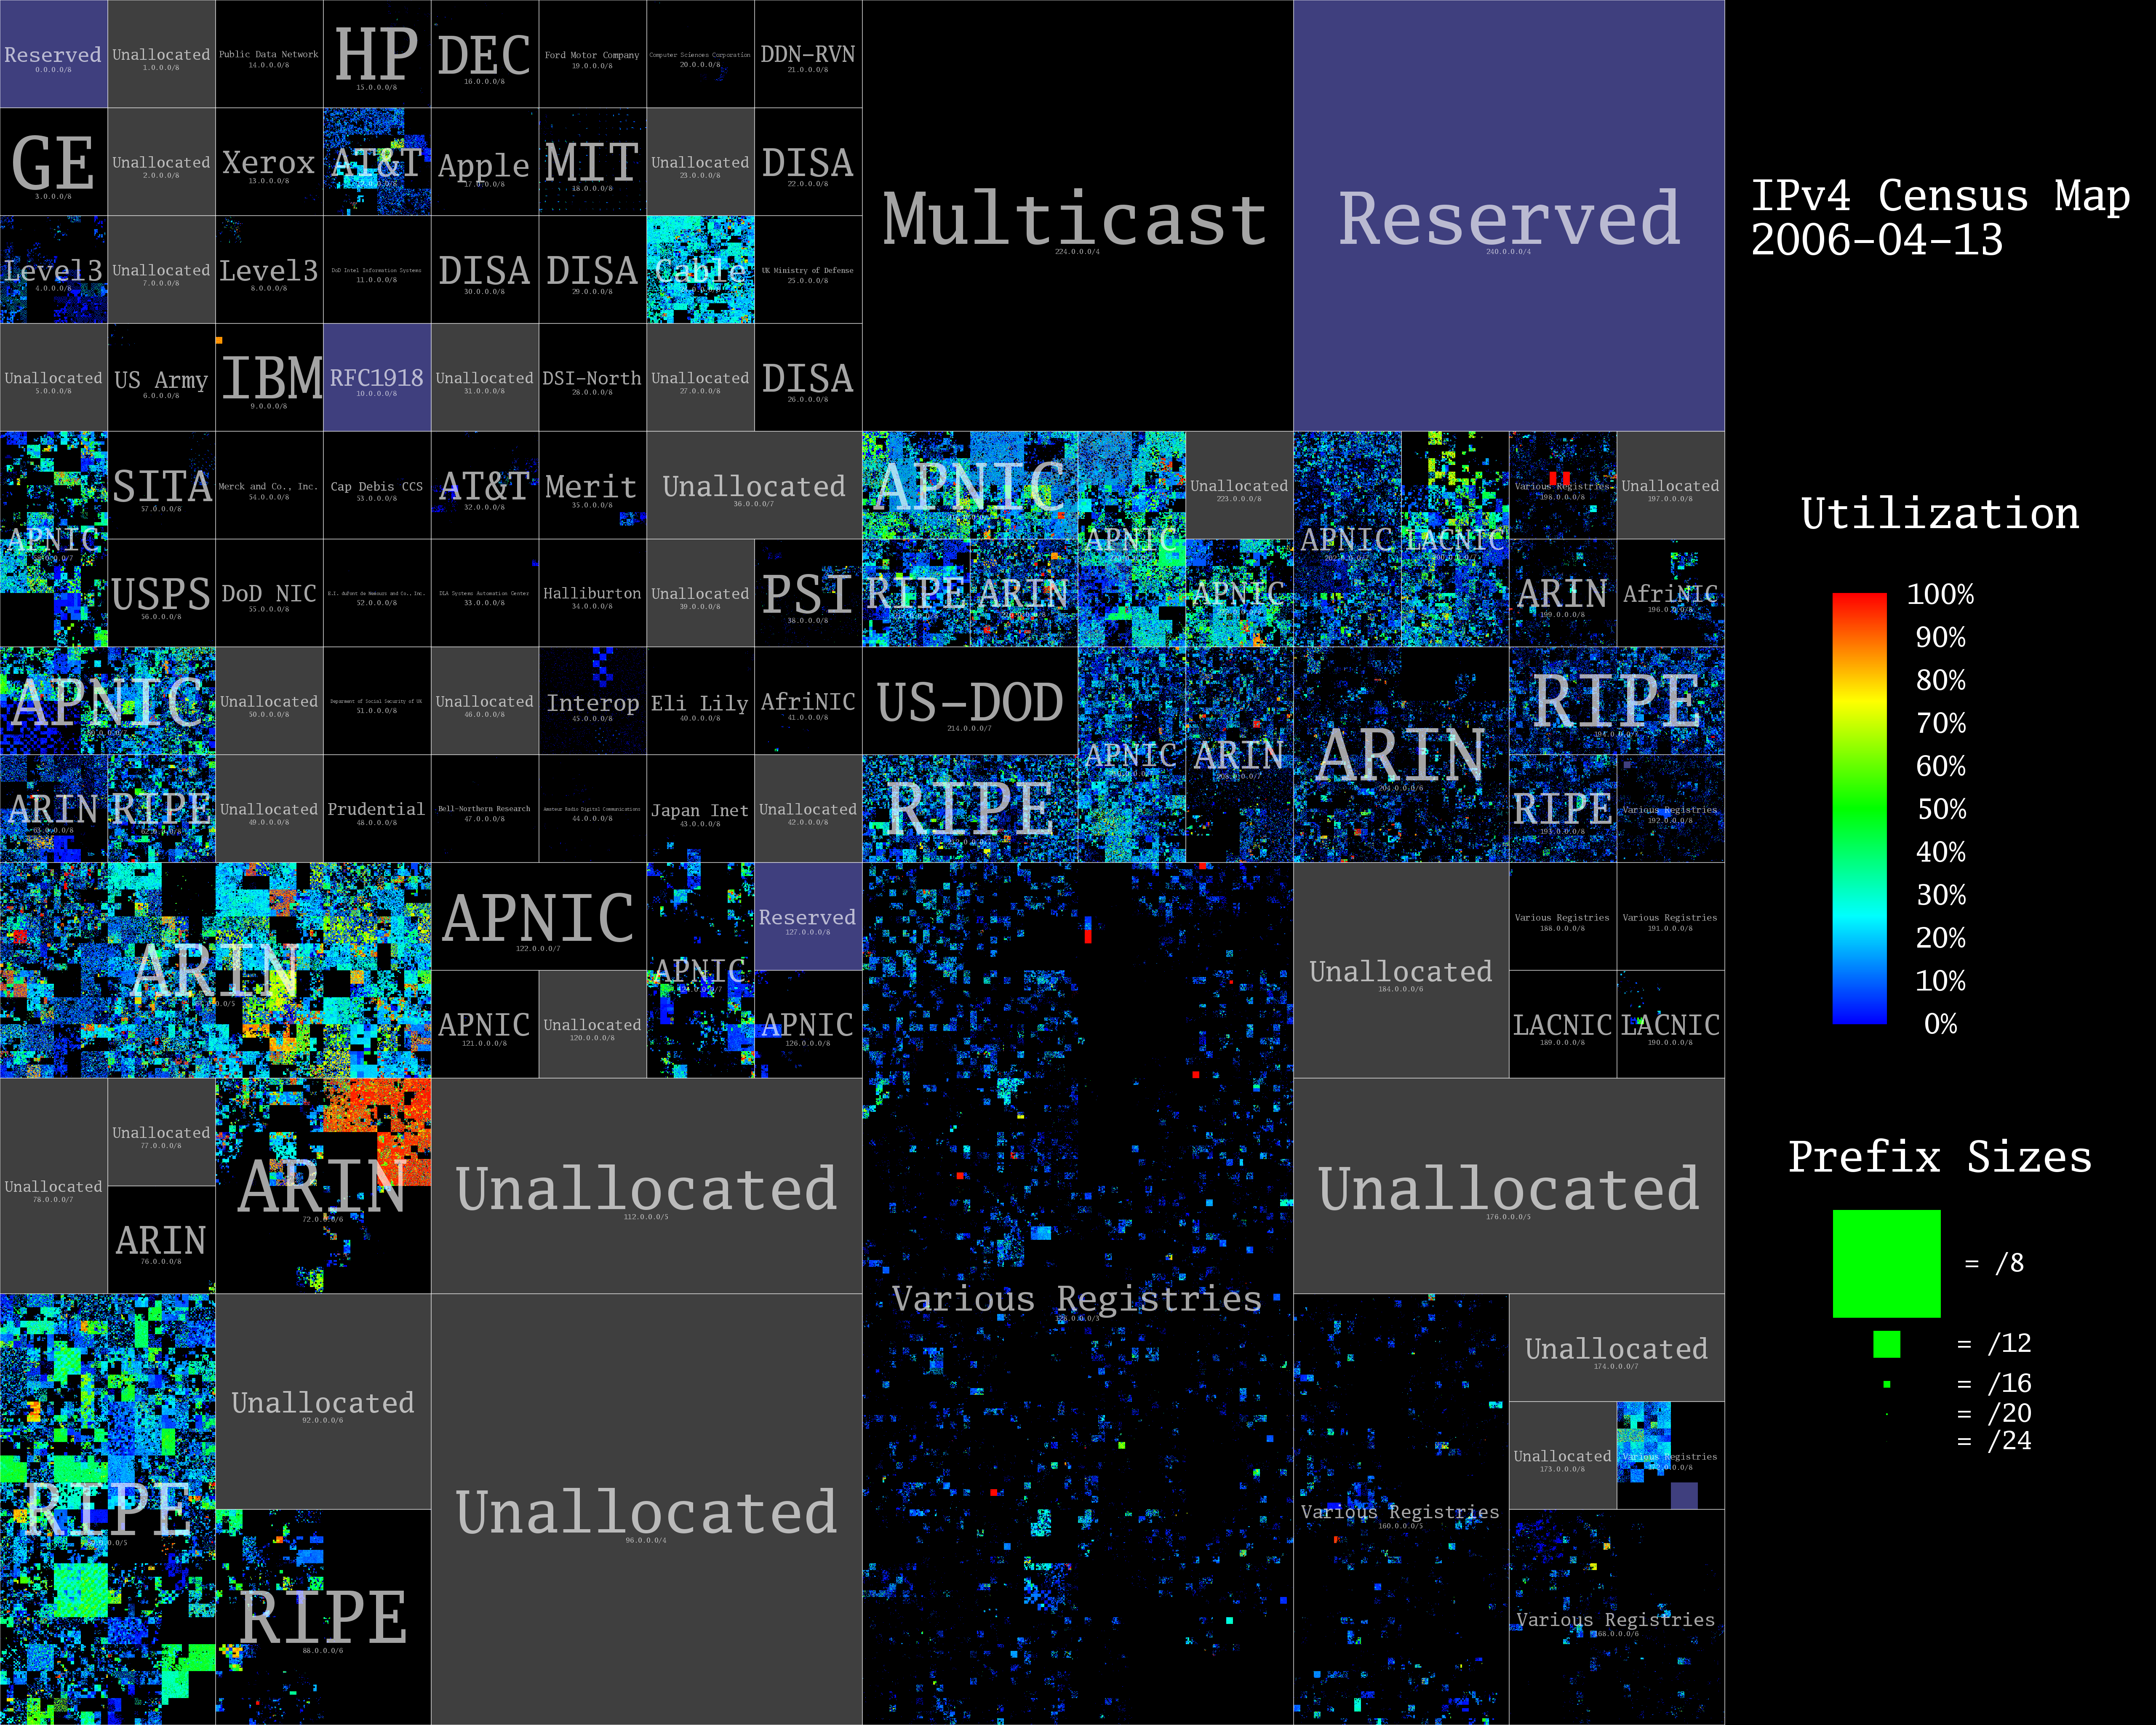
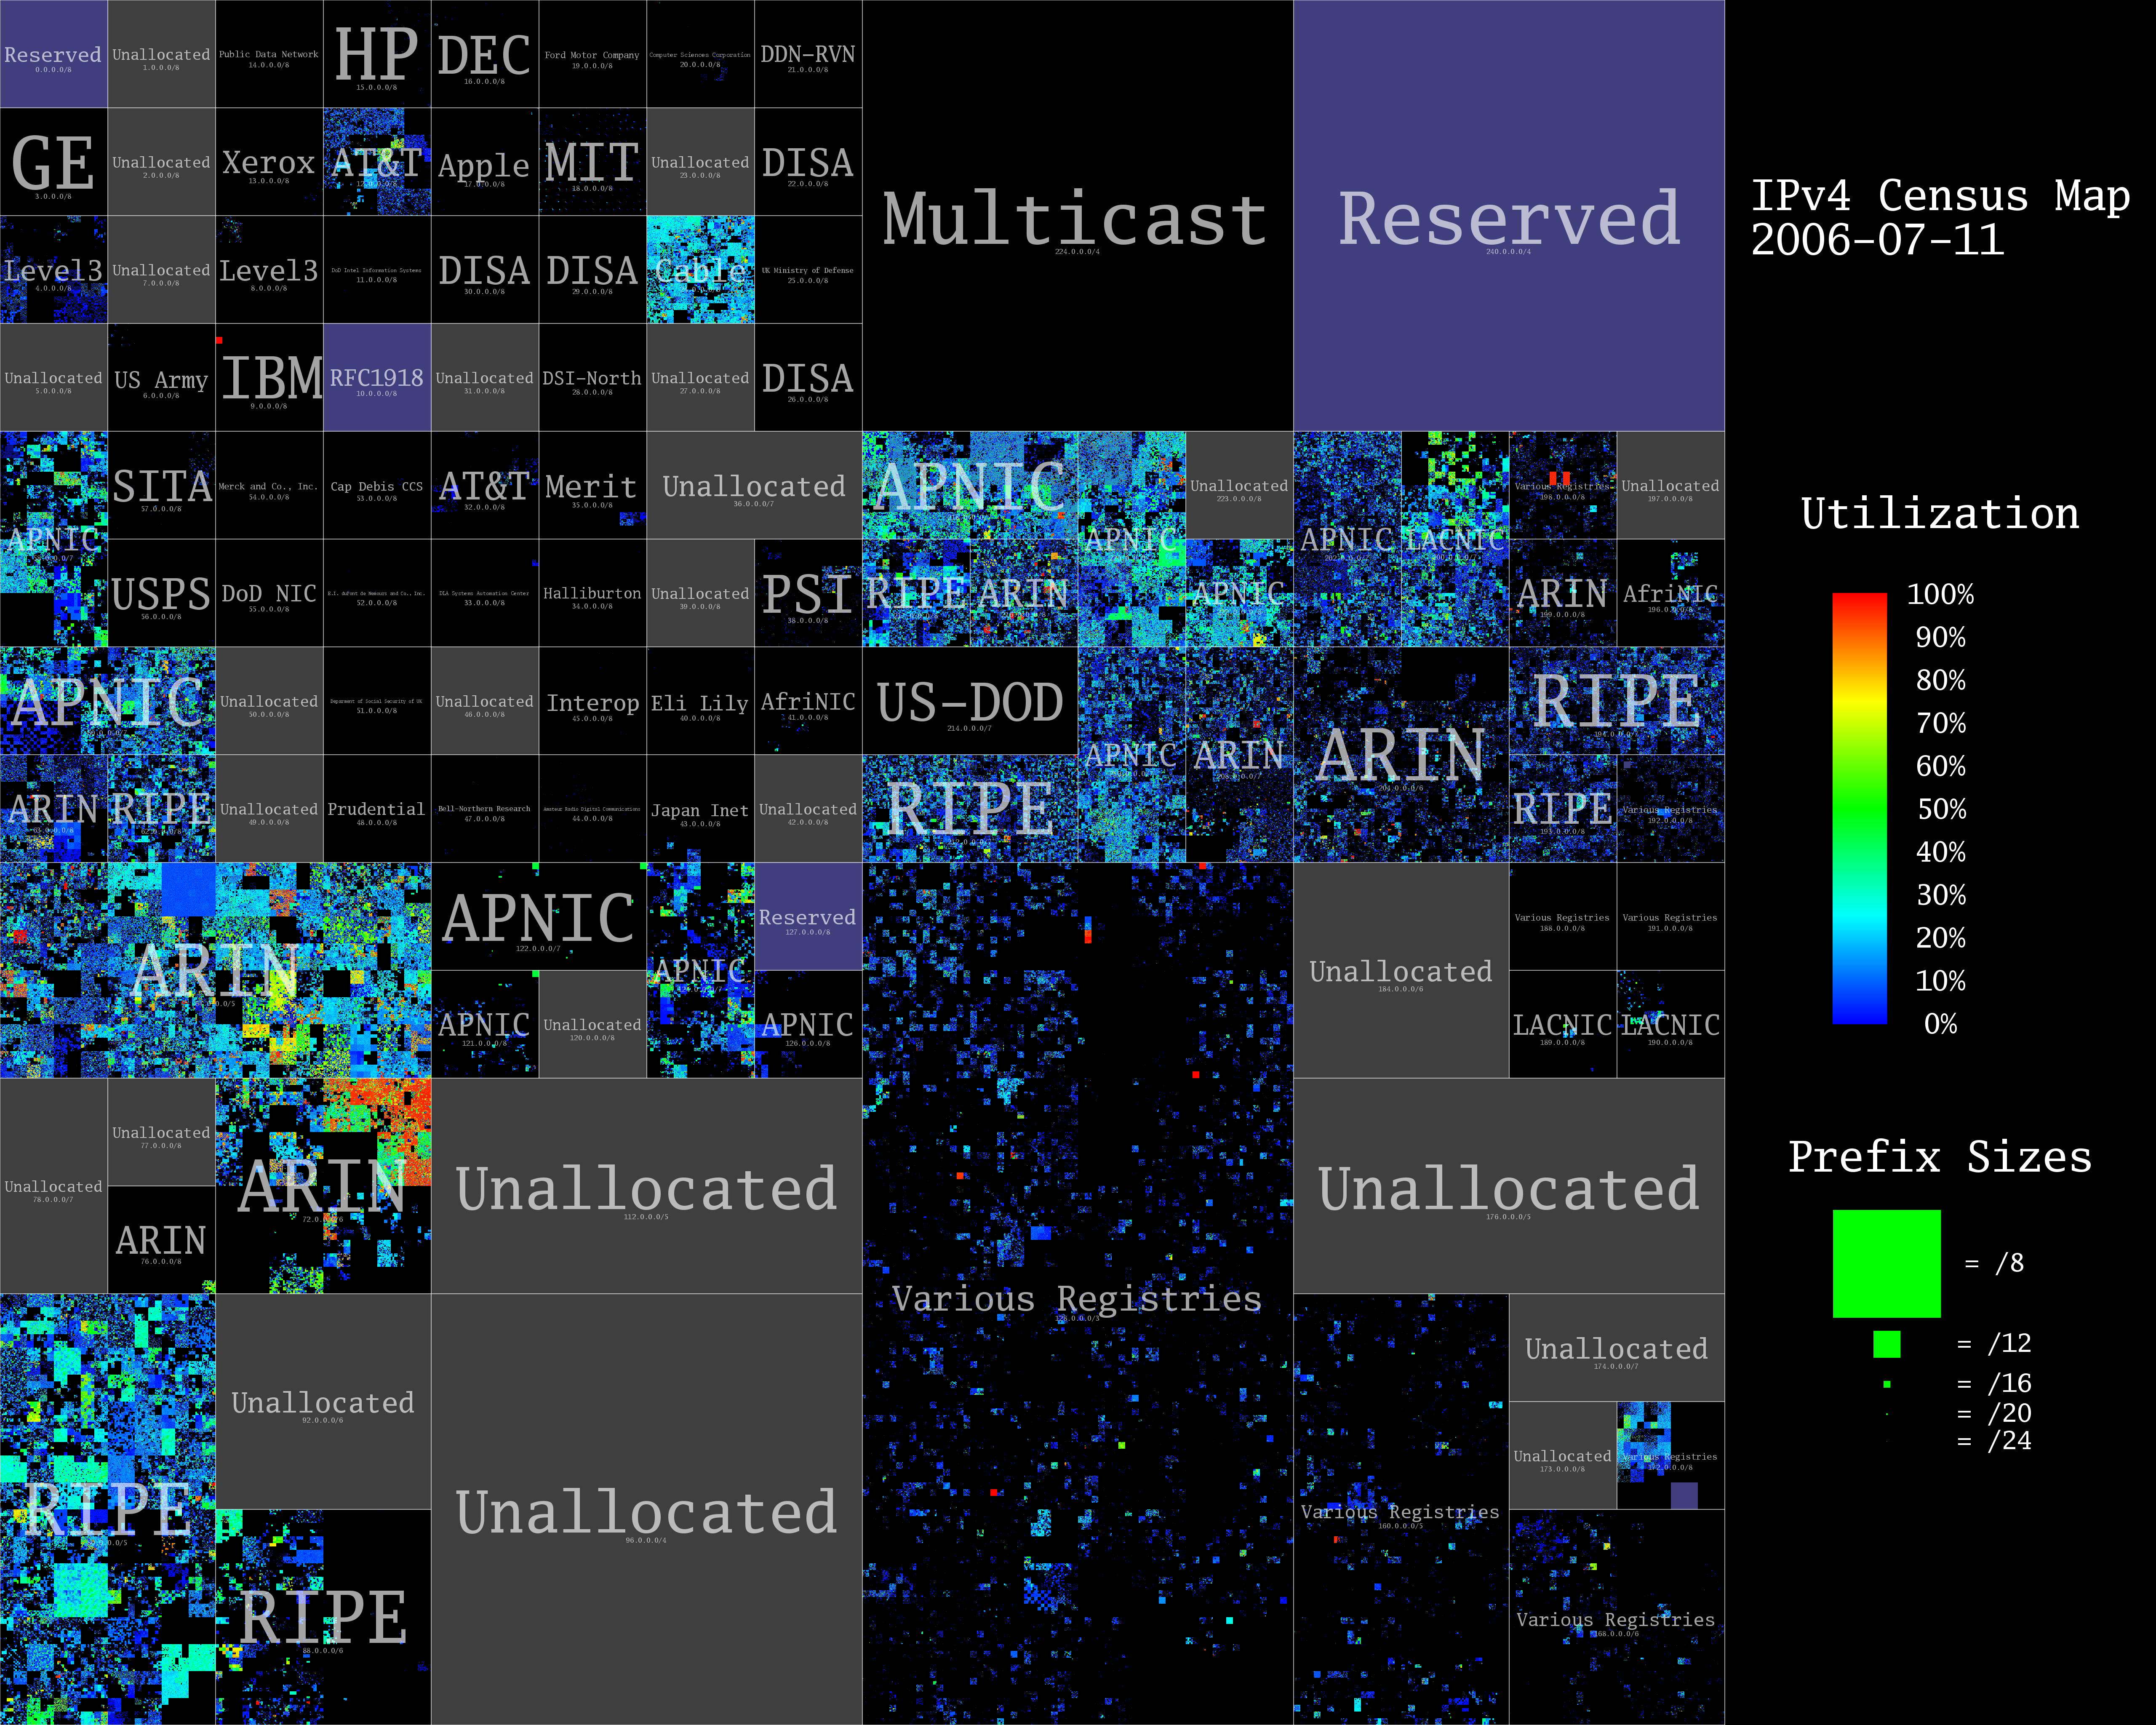
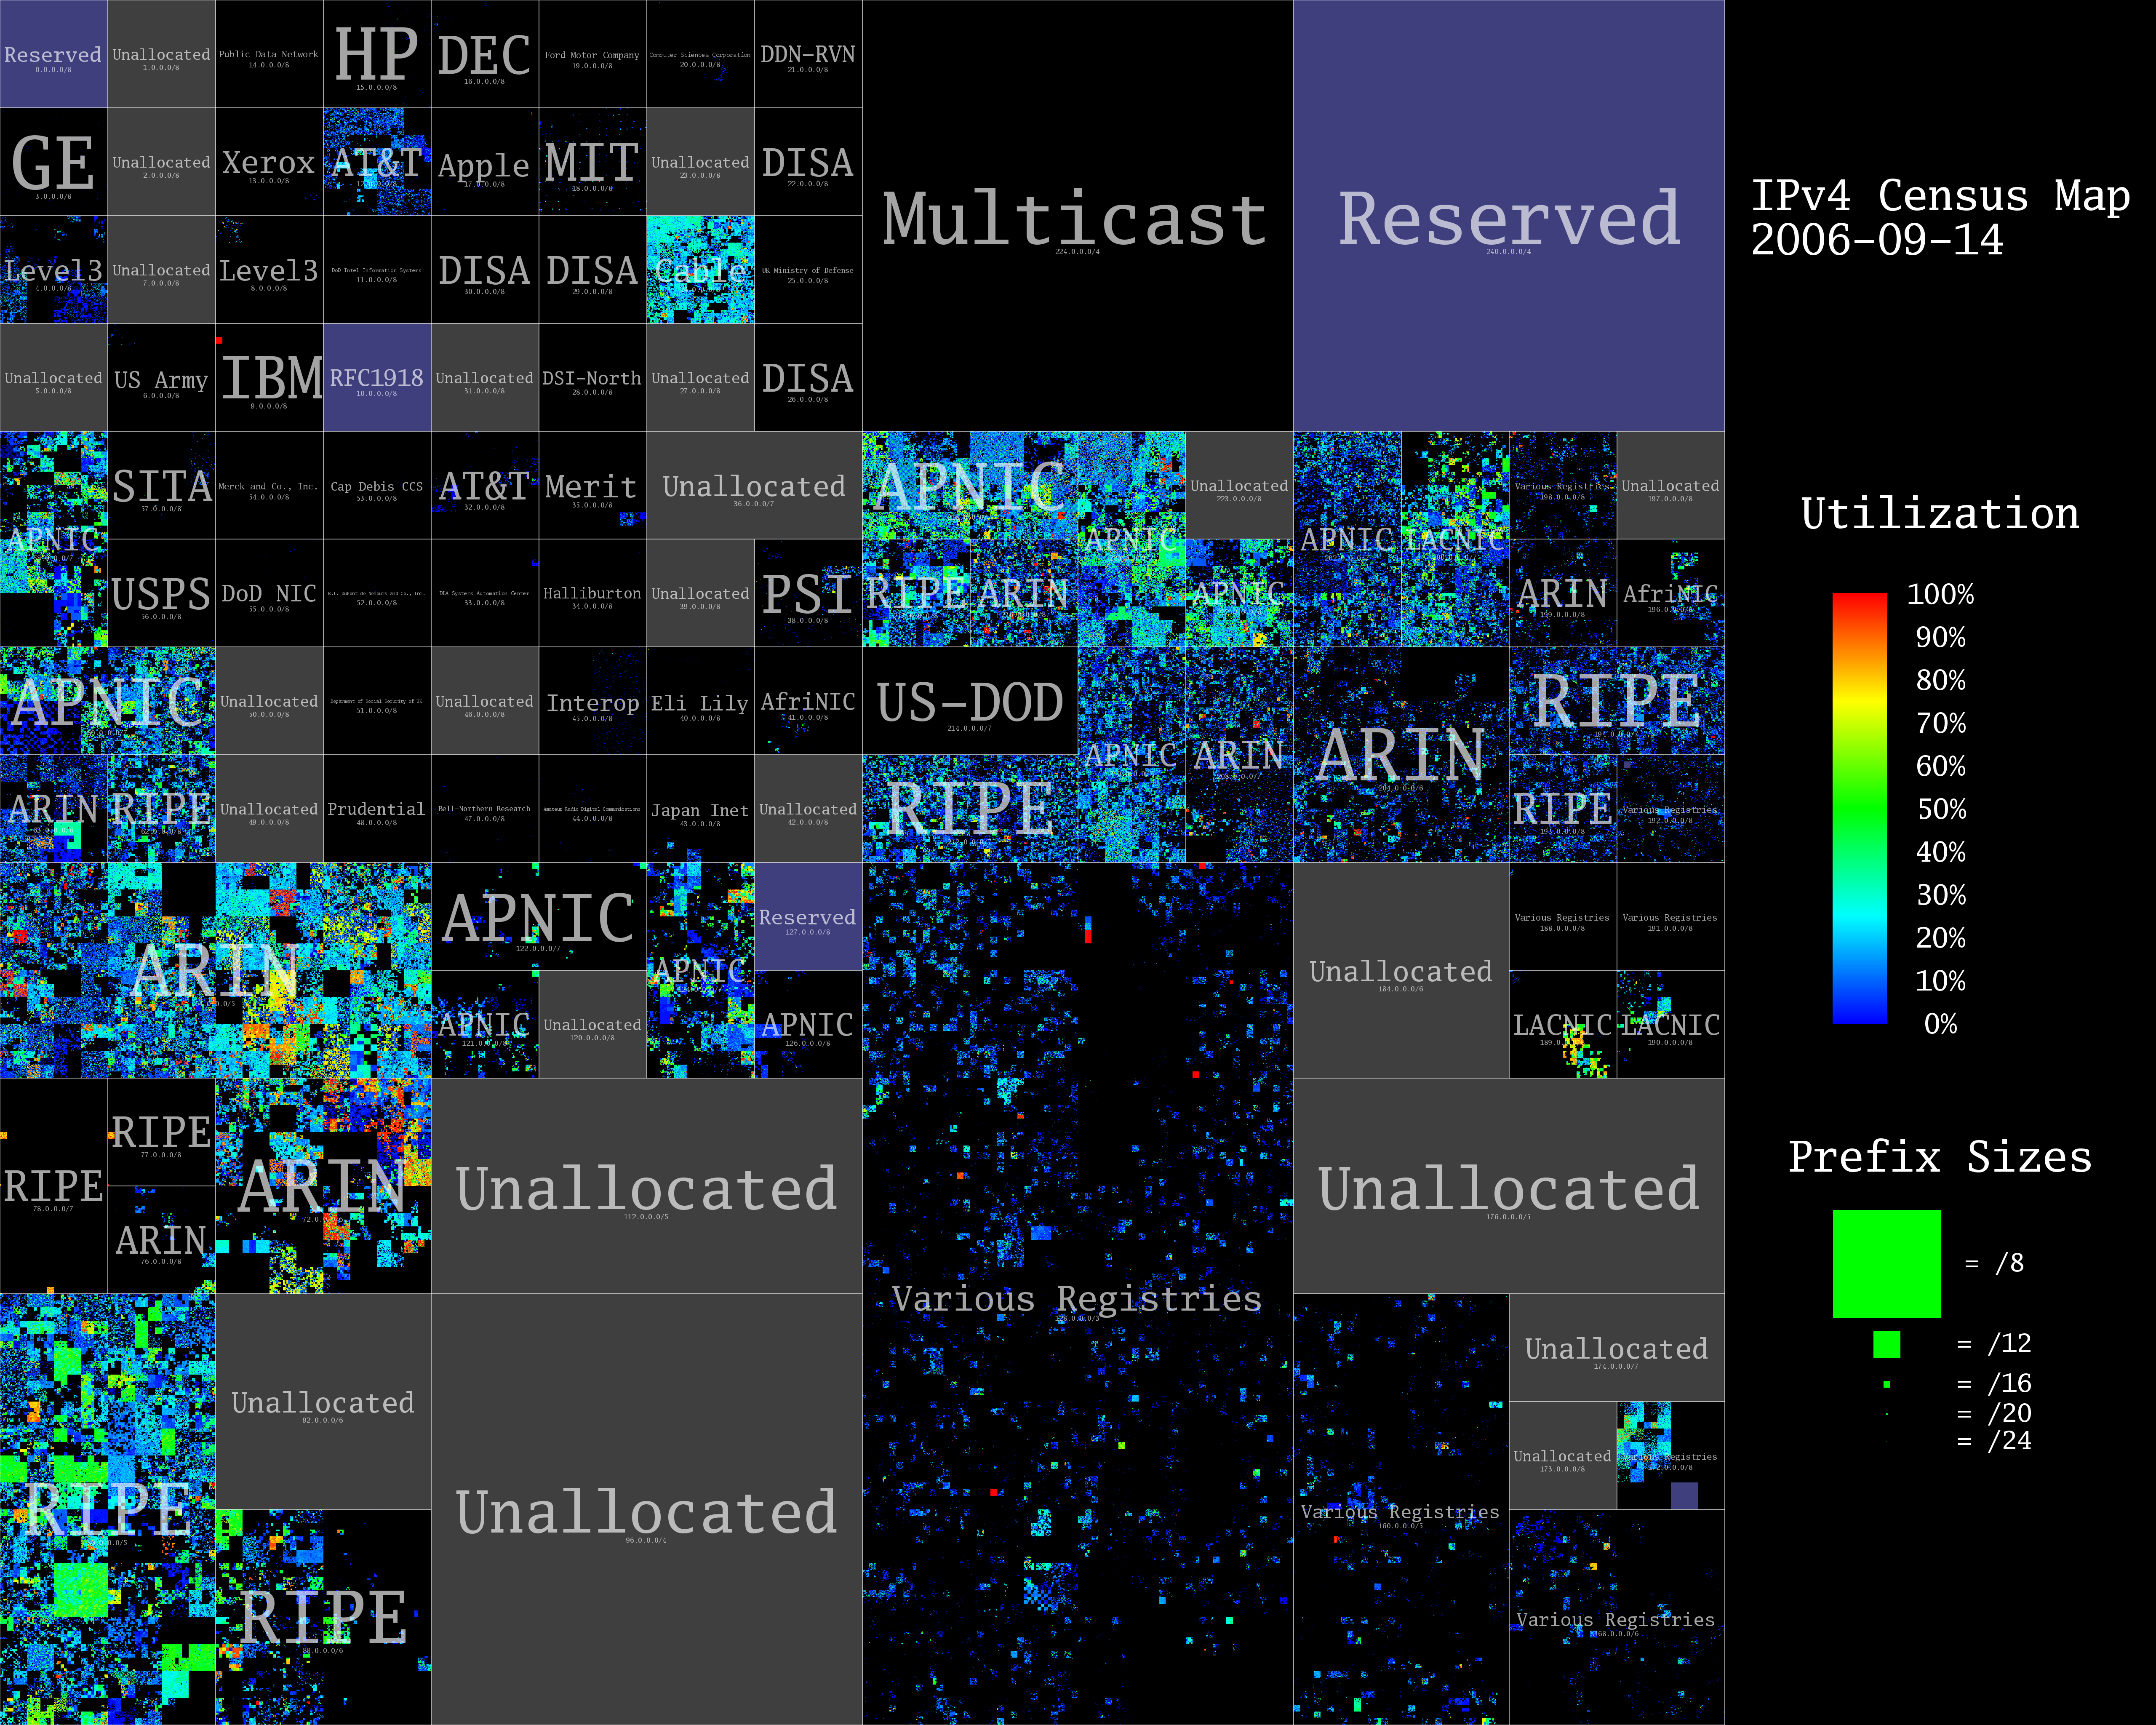
In this visualization, we mapped 1-dimensional IPv4 address space into a 2-dimensional image using a 12th order Hilbert curve, as inspired by xkcd. This mapping has the visually useful property that CIDR netblocks always appear as squares or rectangles in the image.
Address blocks are labeled based on IANA's list of IPv4 allocations. Early recipients of large "class A" address blocks appear in the upper left, while the areas labeled Various Registries indicate allocations from the former "class B" and "class C" (sometimes called legacy or swamp) regions. Since the mid-1990's Internet address space allocations are made from ICANN/IANA to the Regional Internet Registries: RIPE, APNIC, ARIN, LACNIC, and AfriNIC.
Each pixel in the original 4096 x 4096 image represents a single /24 network containing up to 256 hosts. The pixel color shows the utilization of each /24 based on the number of probe responses. Black areas represent addresses that did not respond to the probes. Blue represents low utilization (at least one response), and red represents 100% utilization.
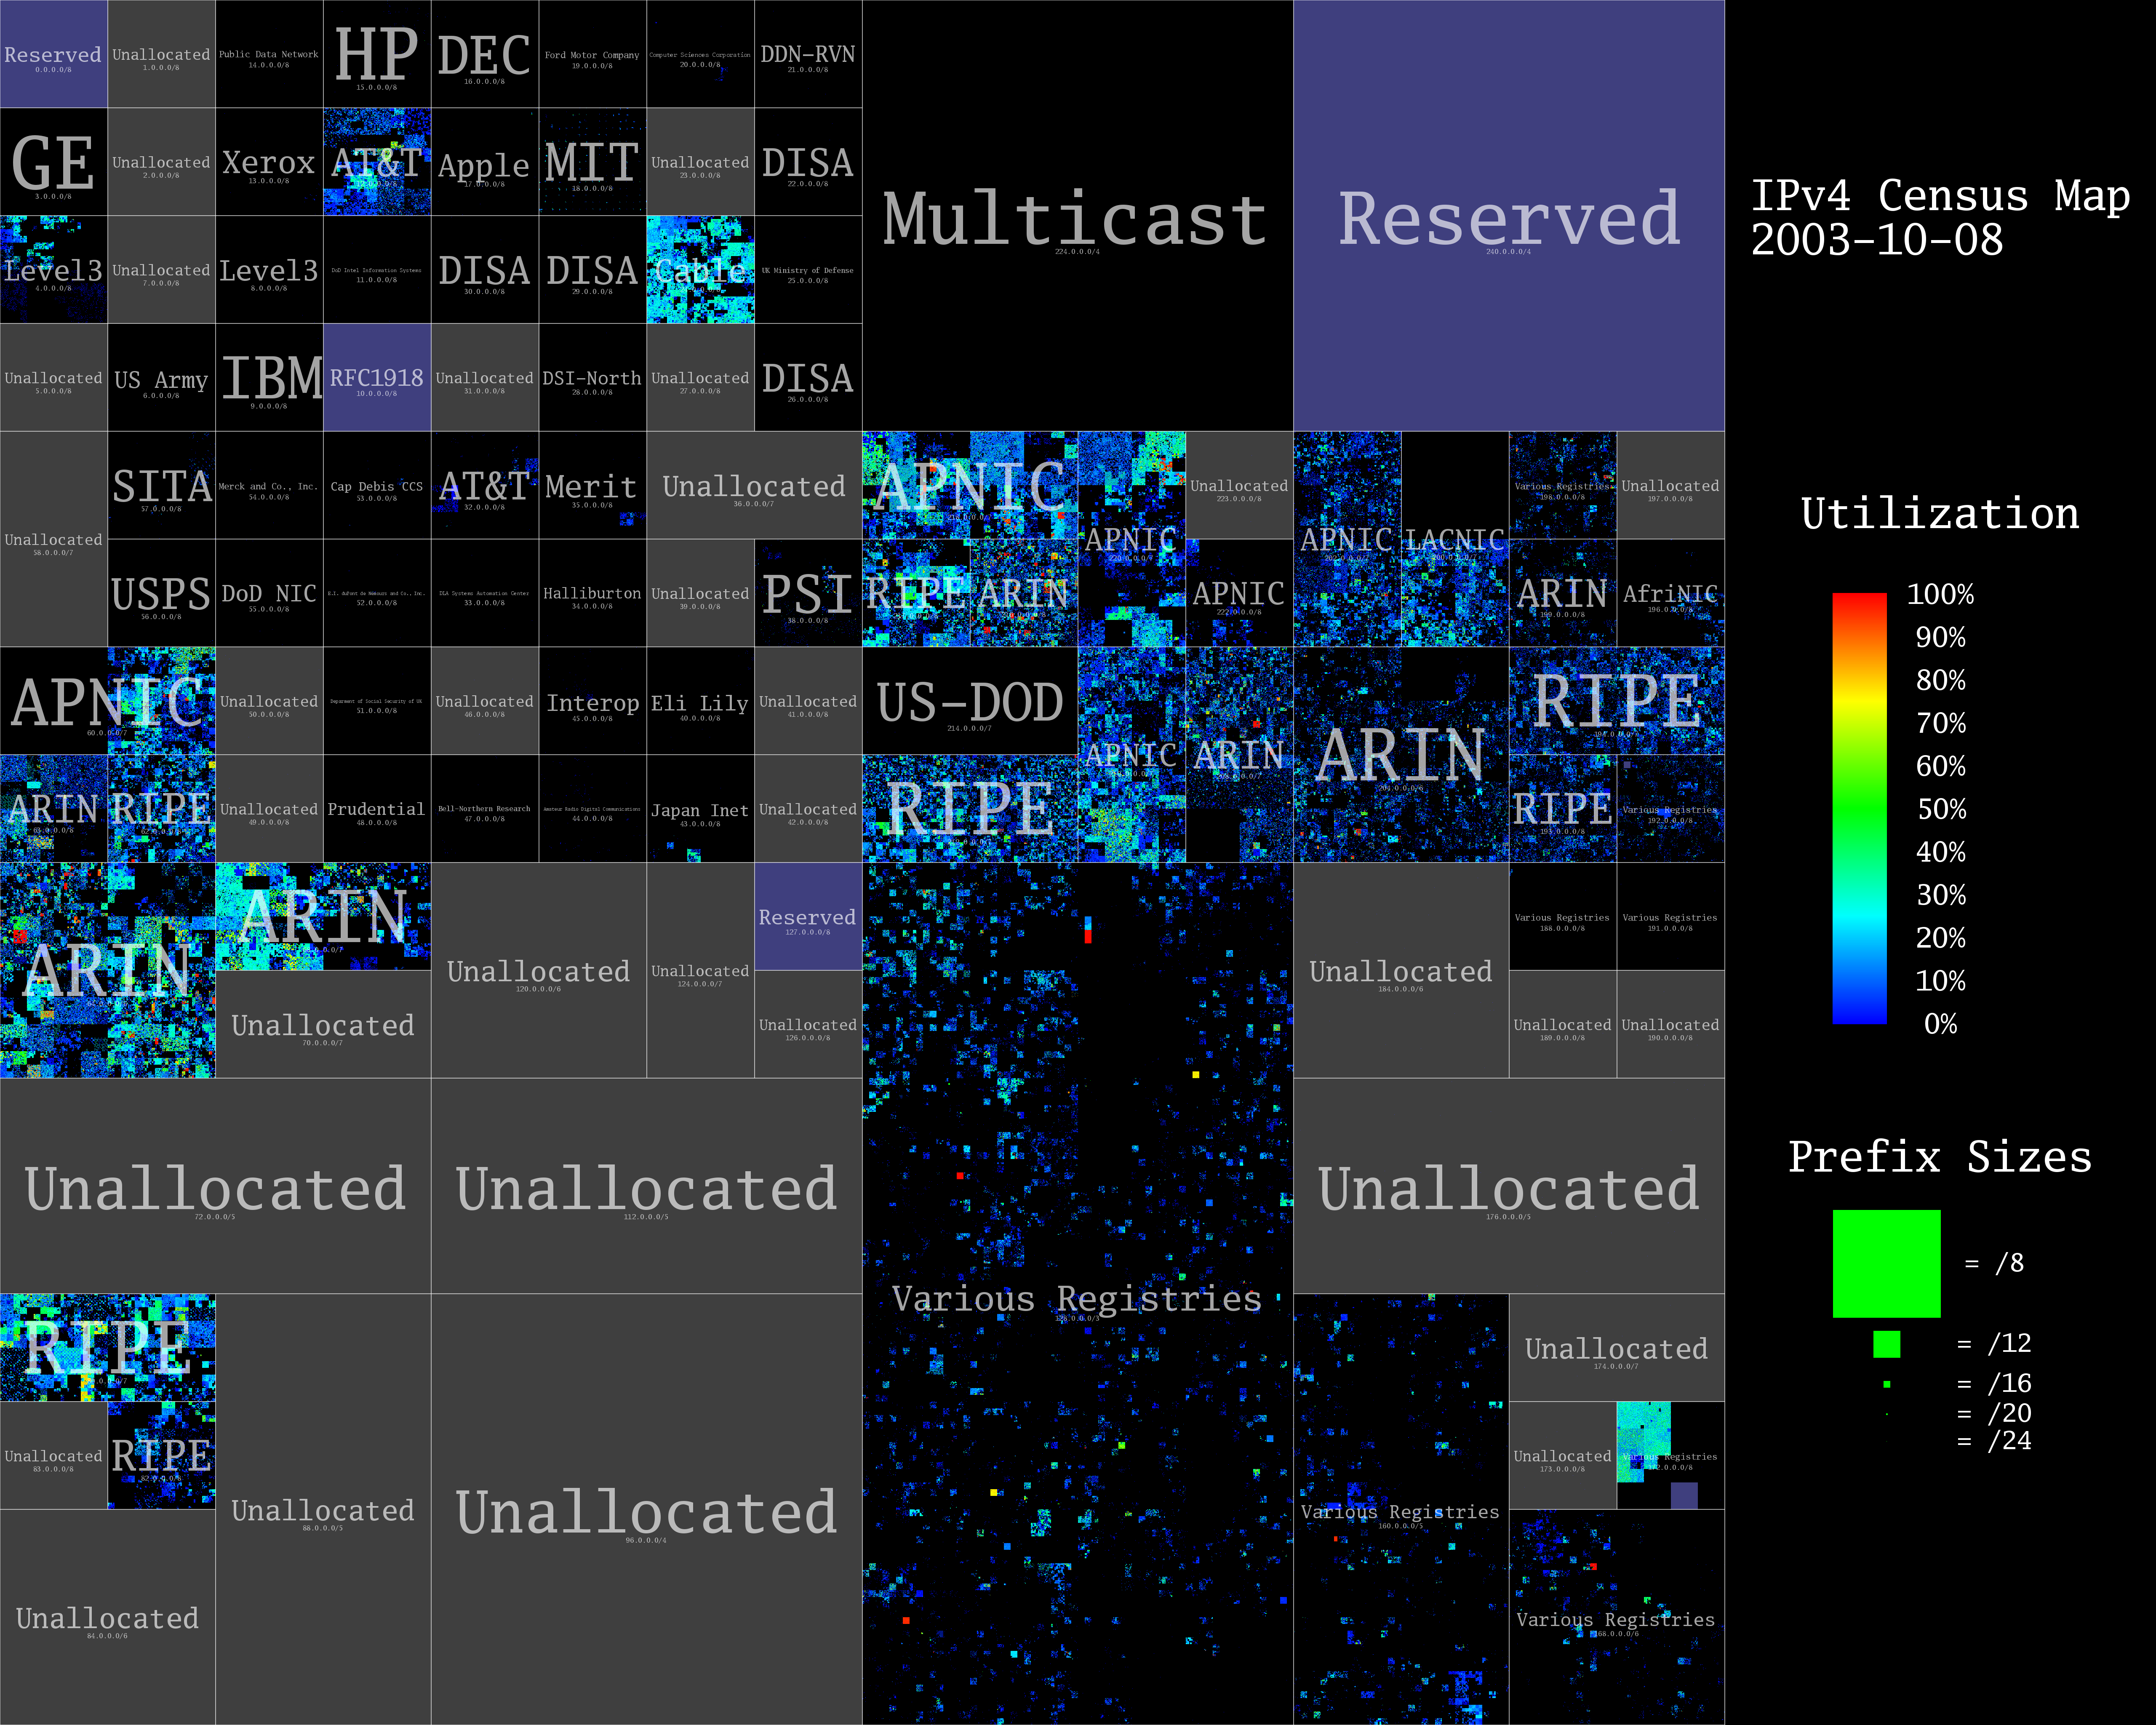
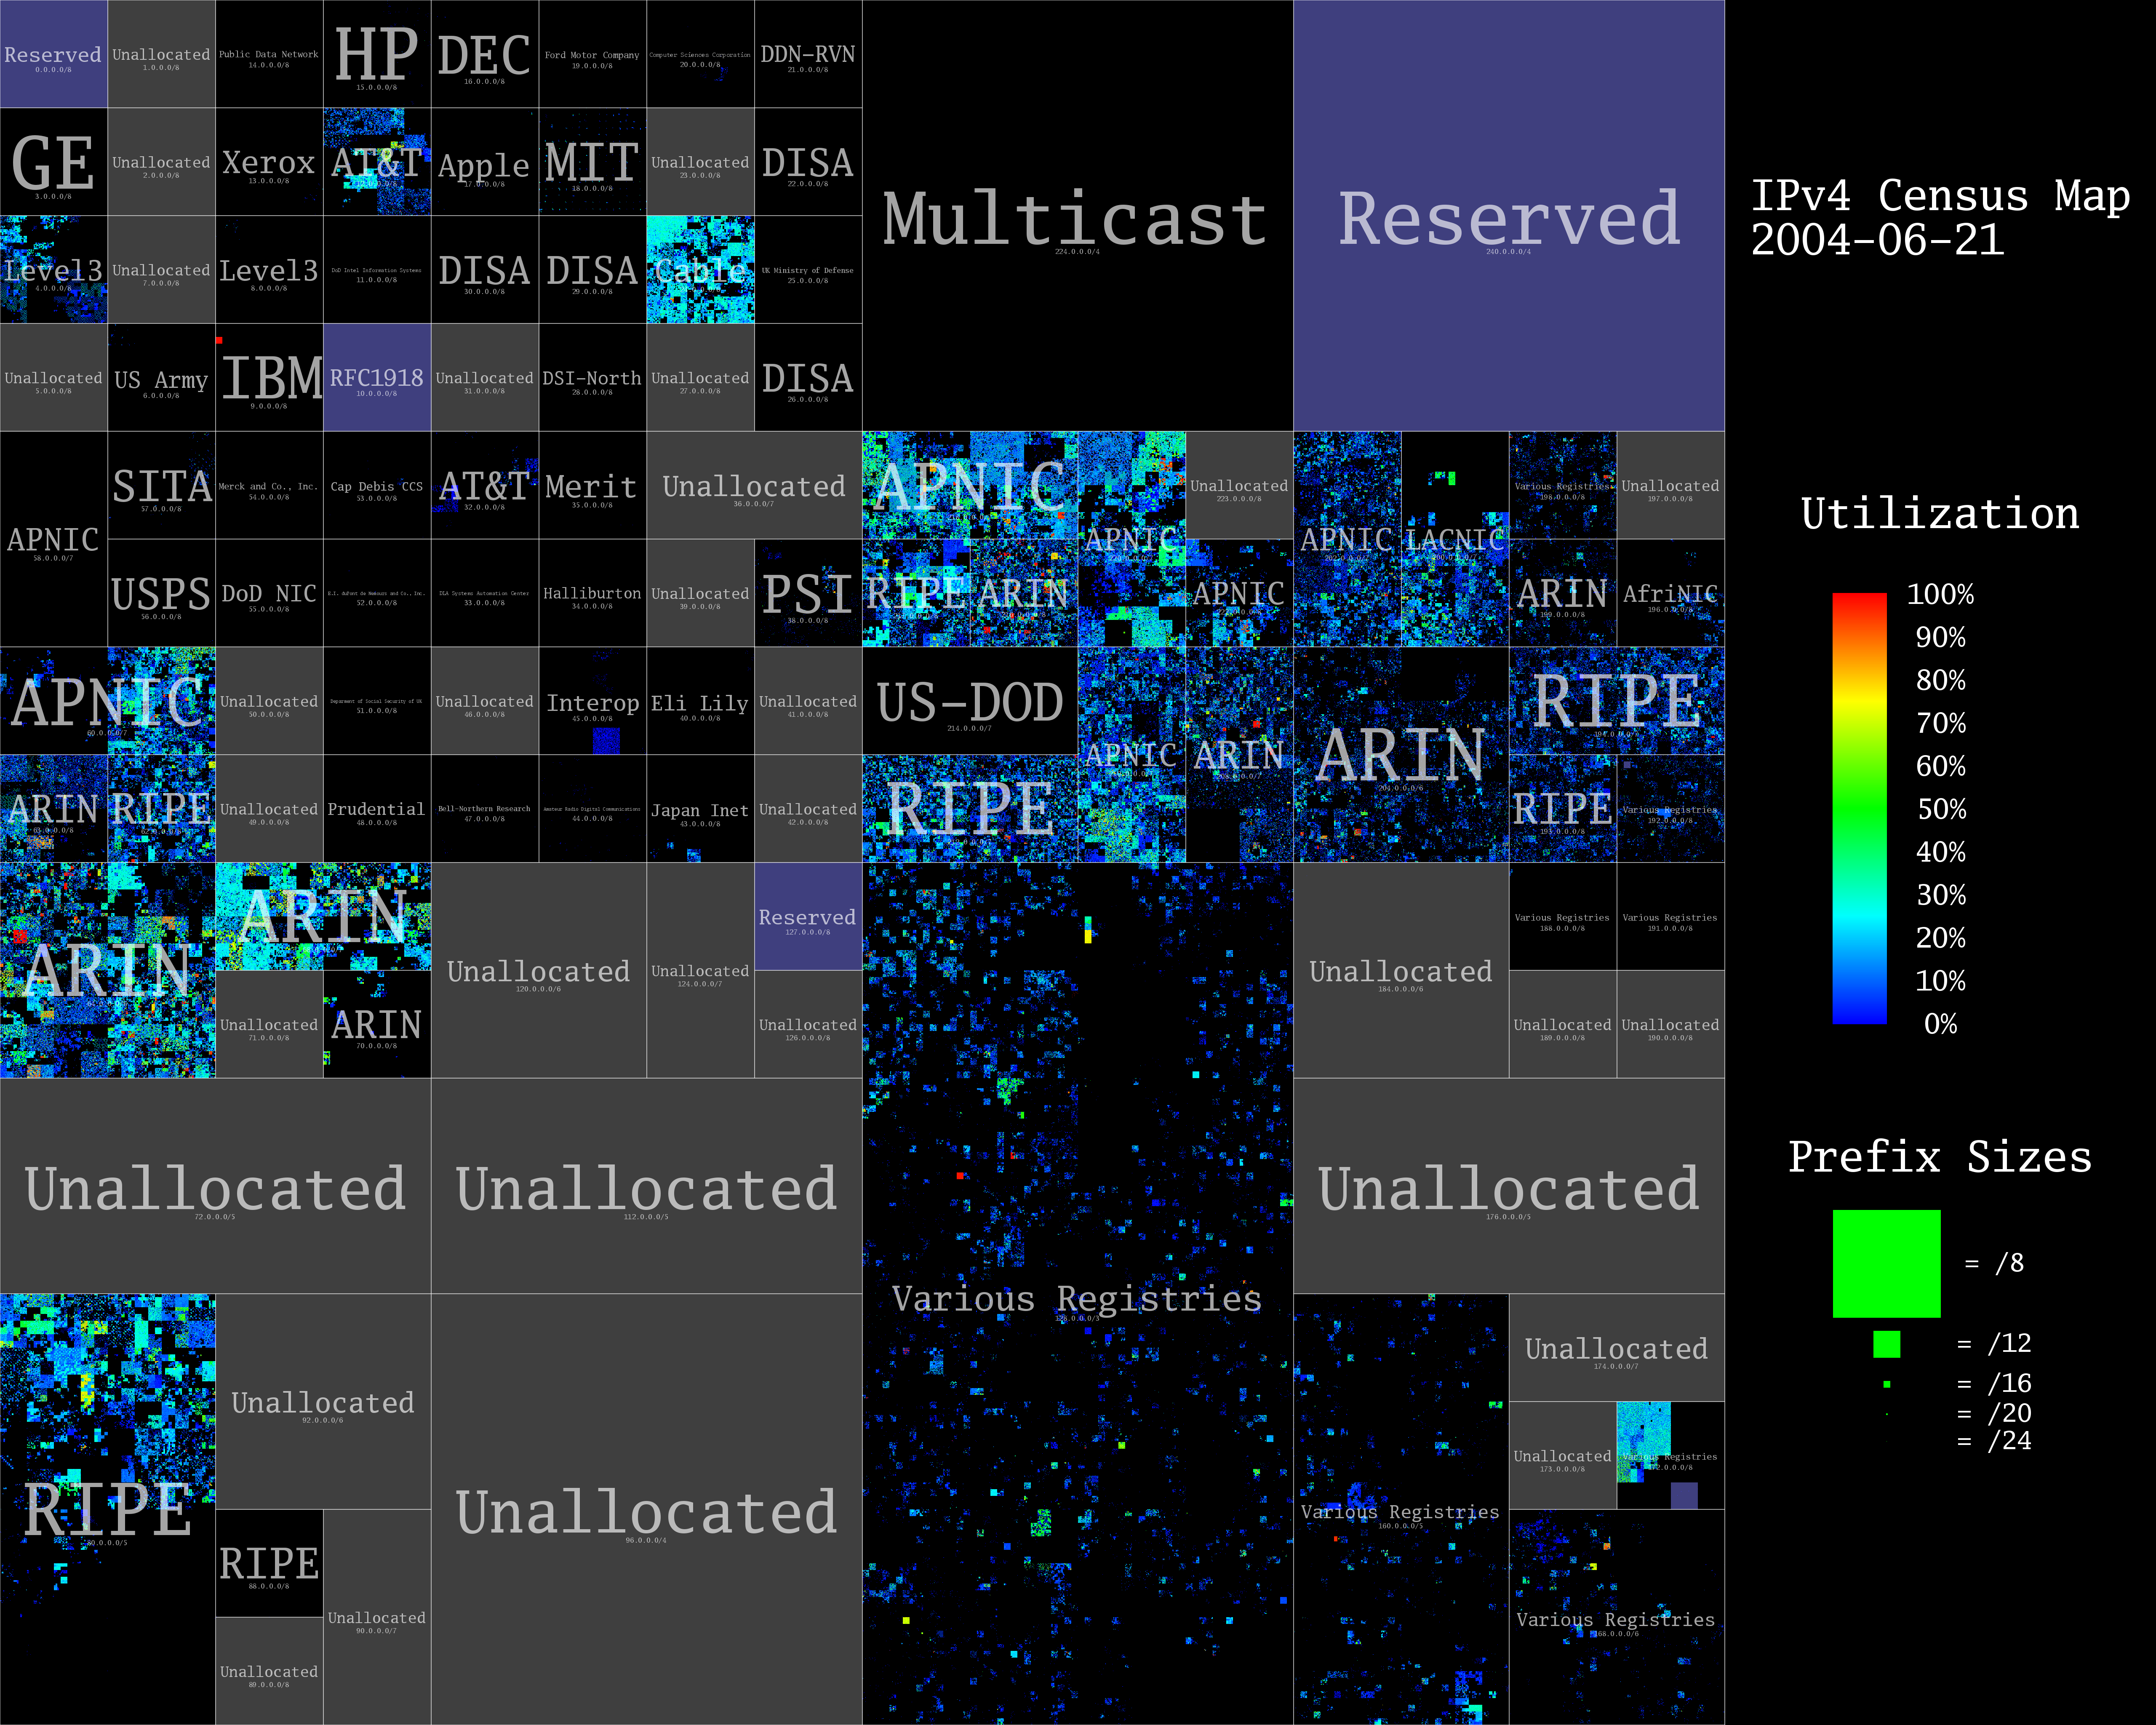
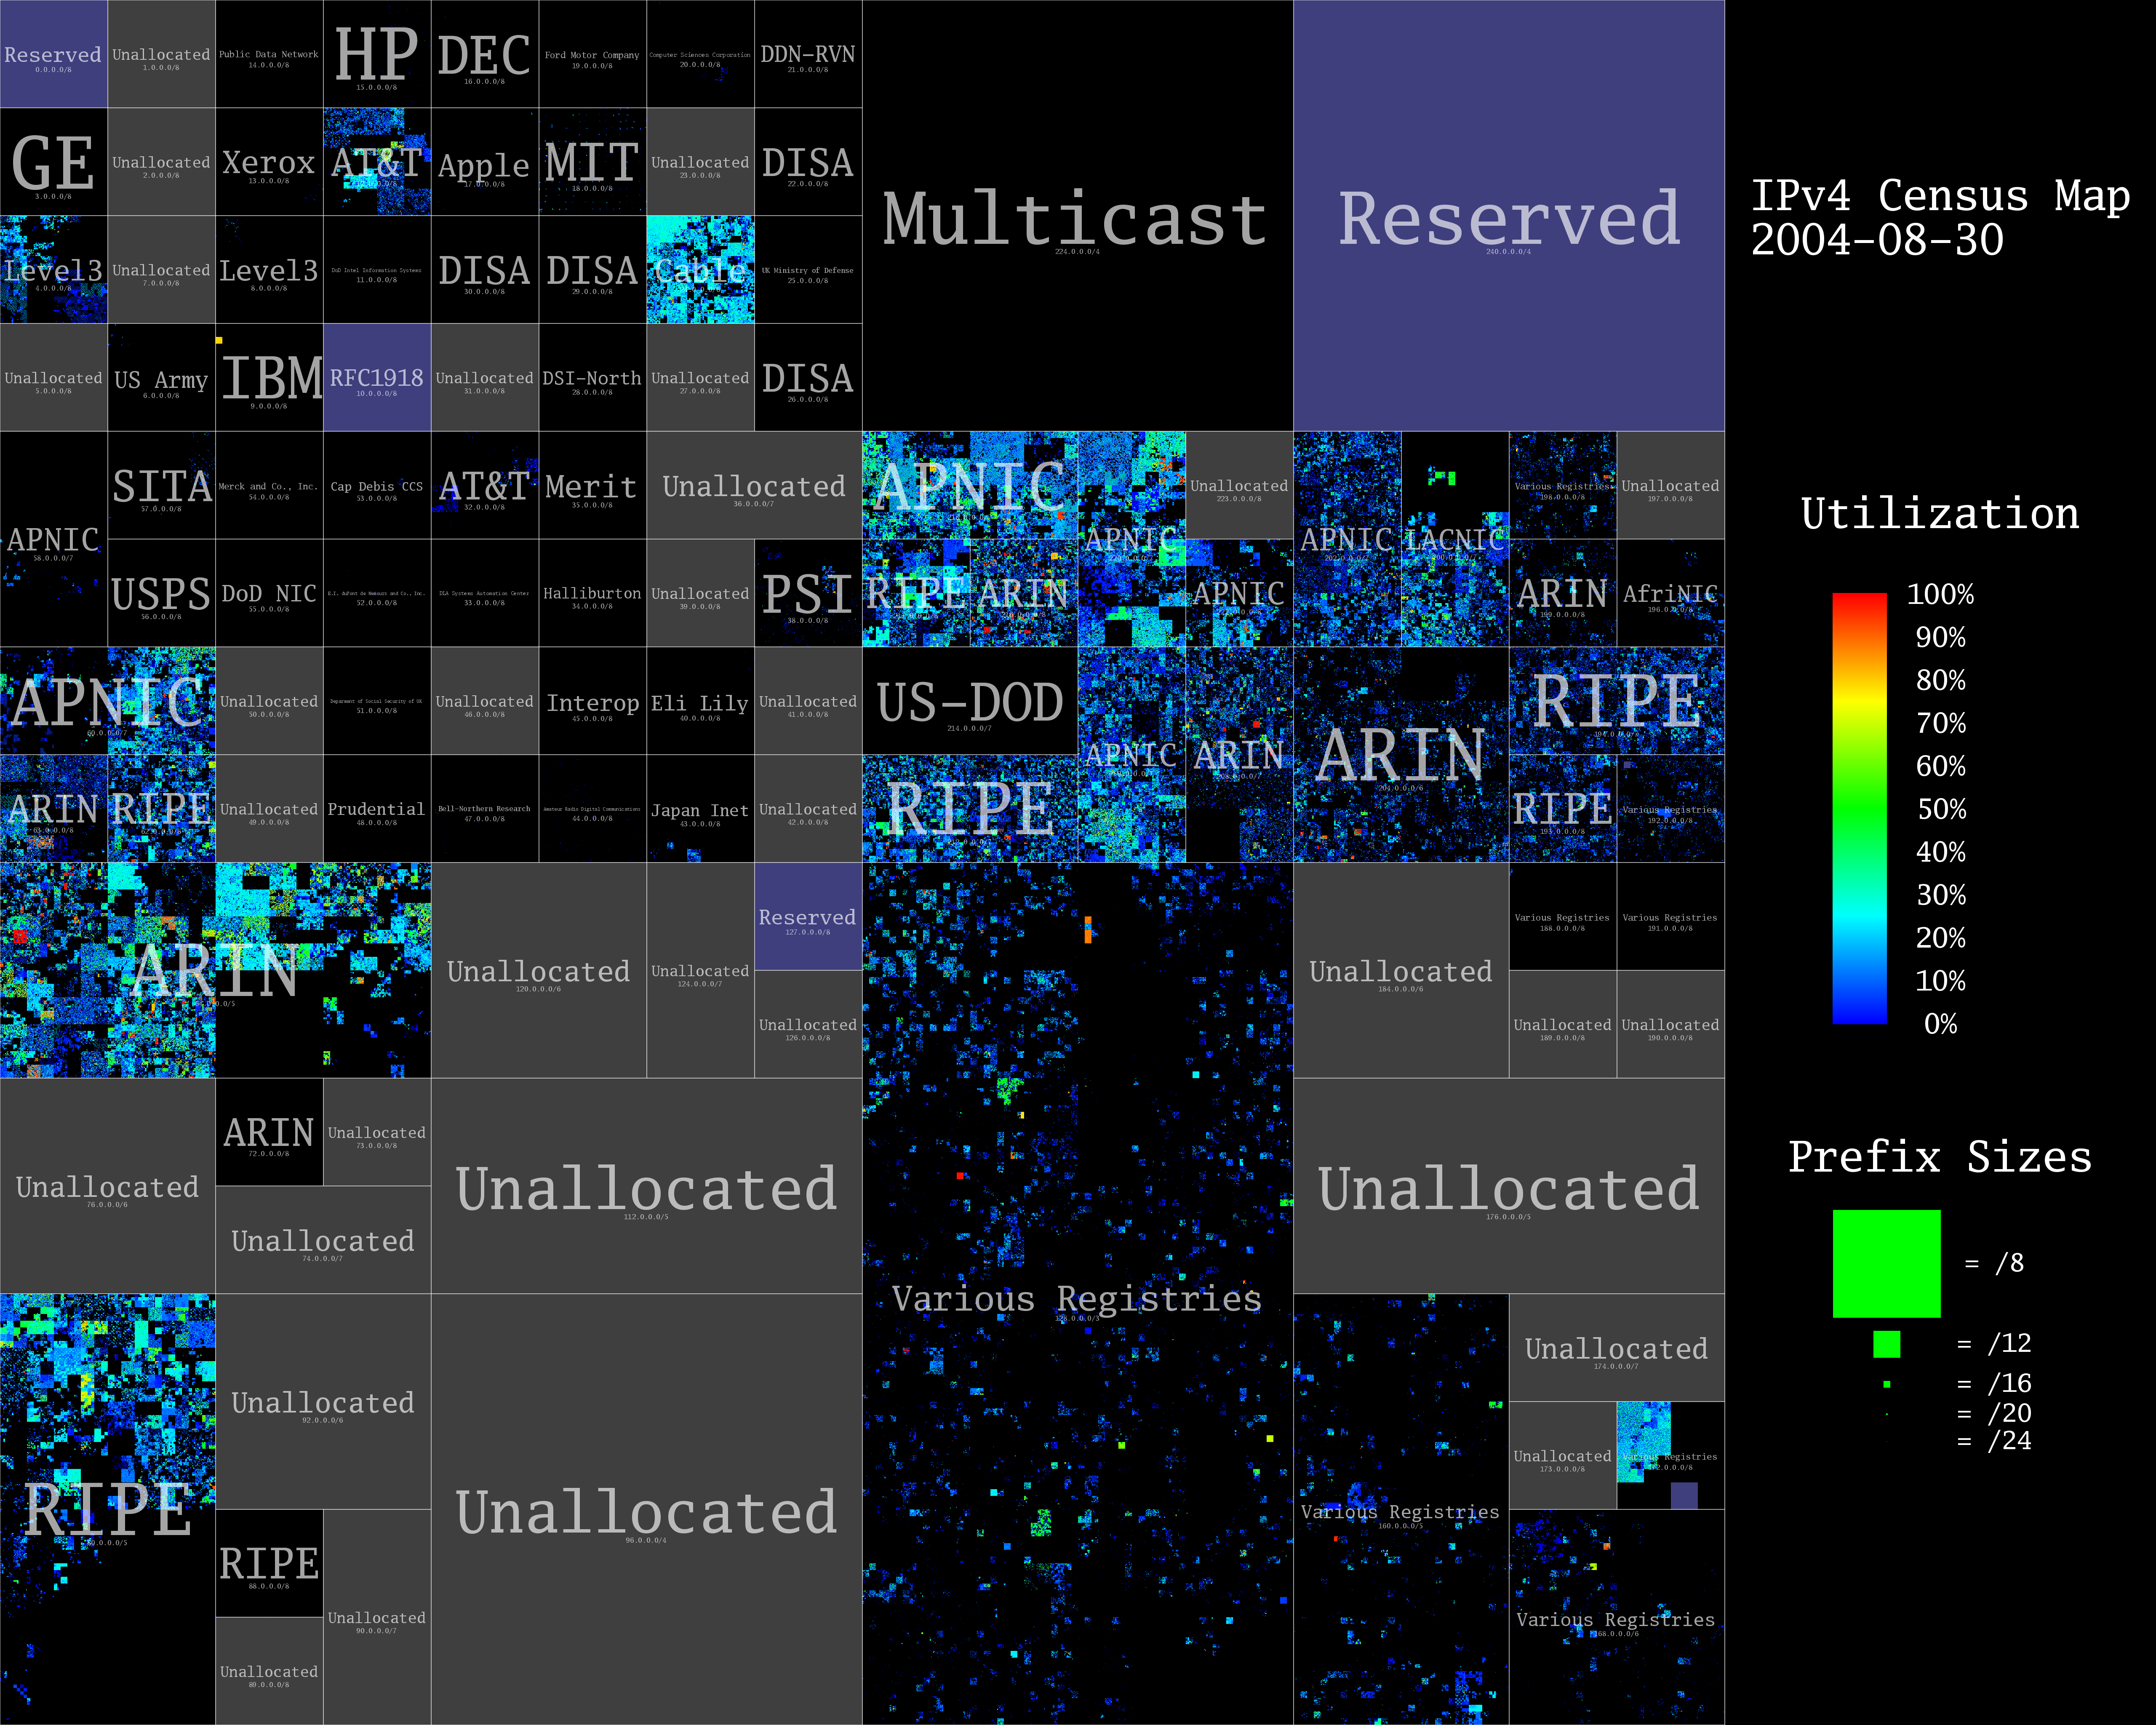
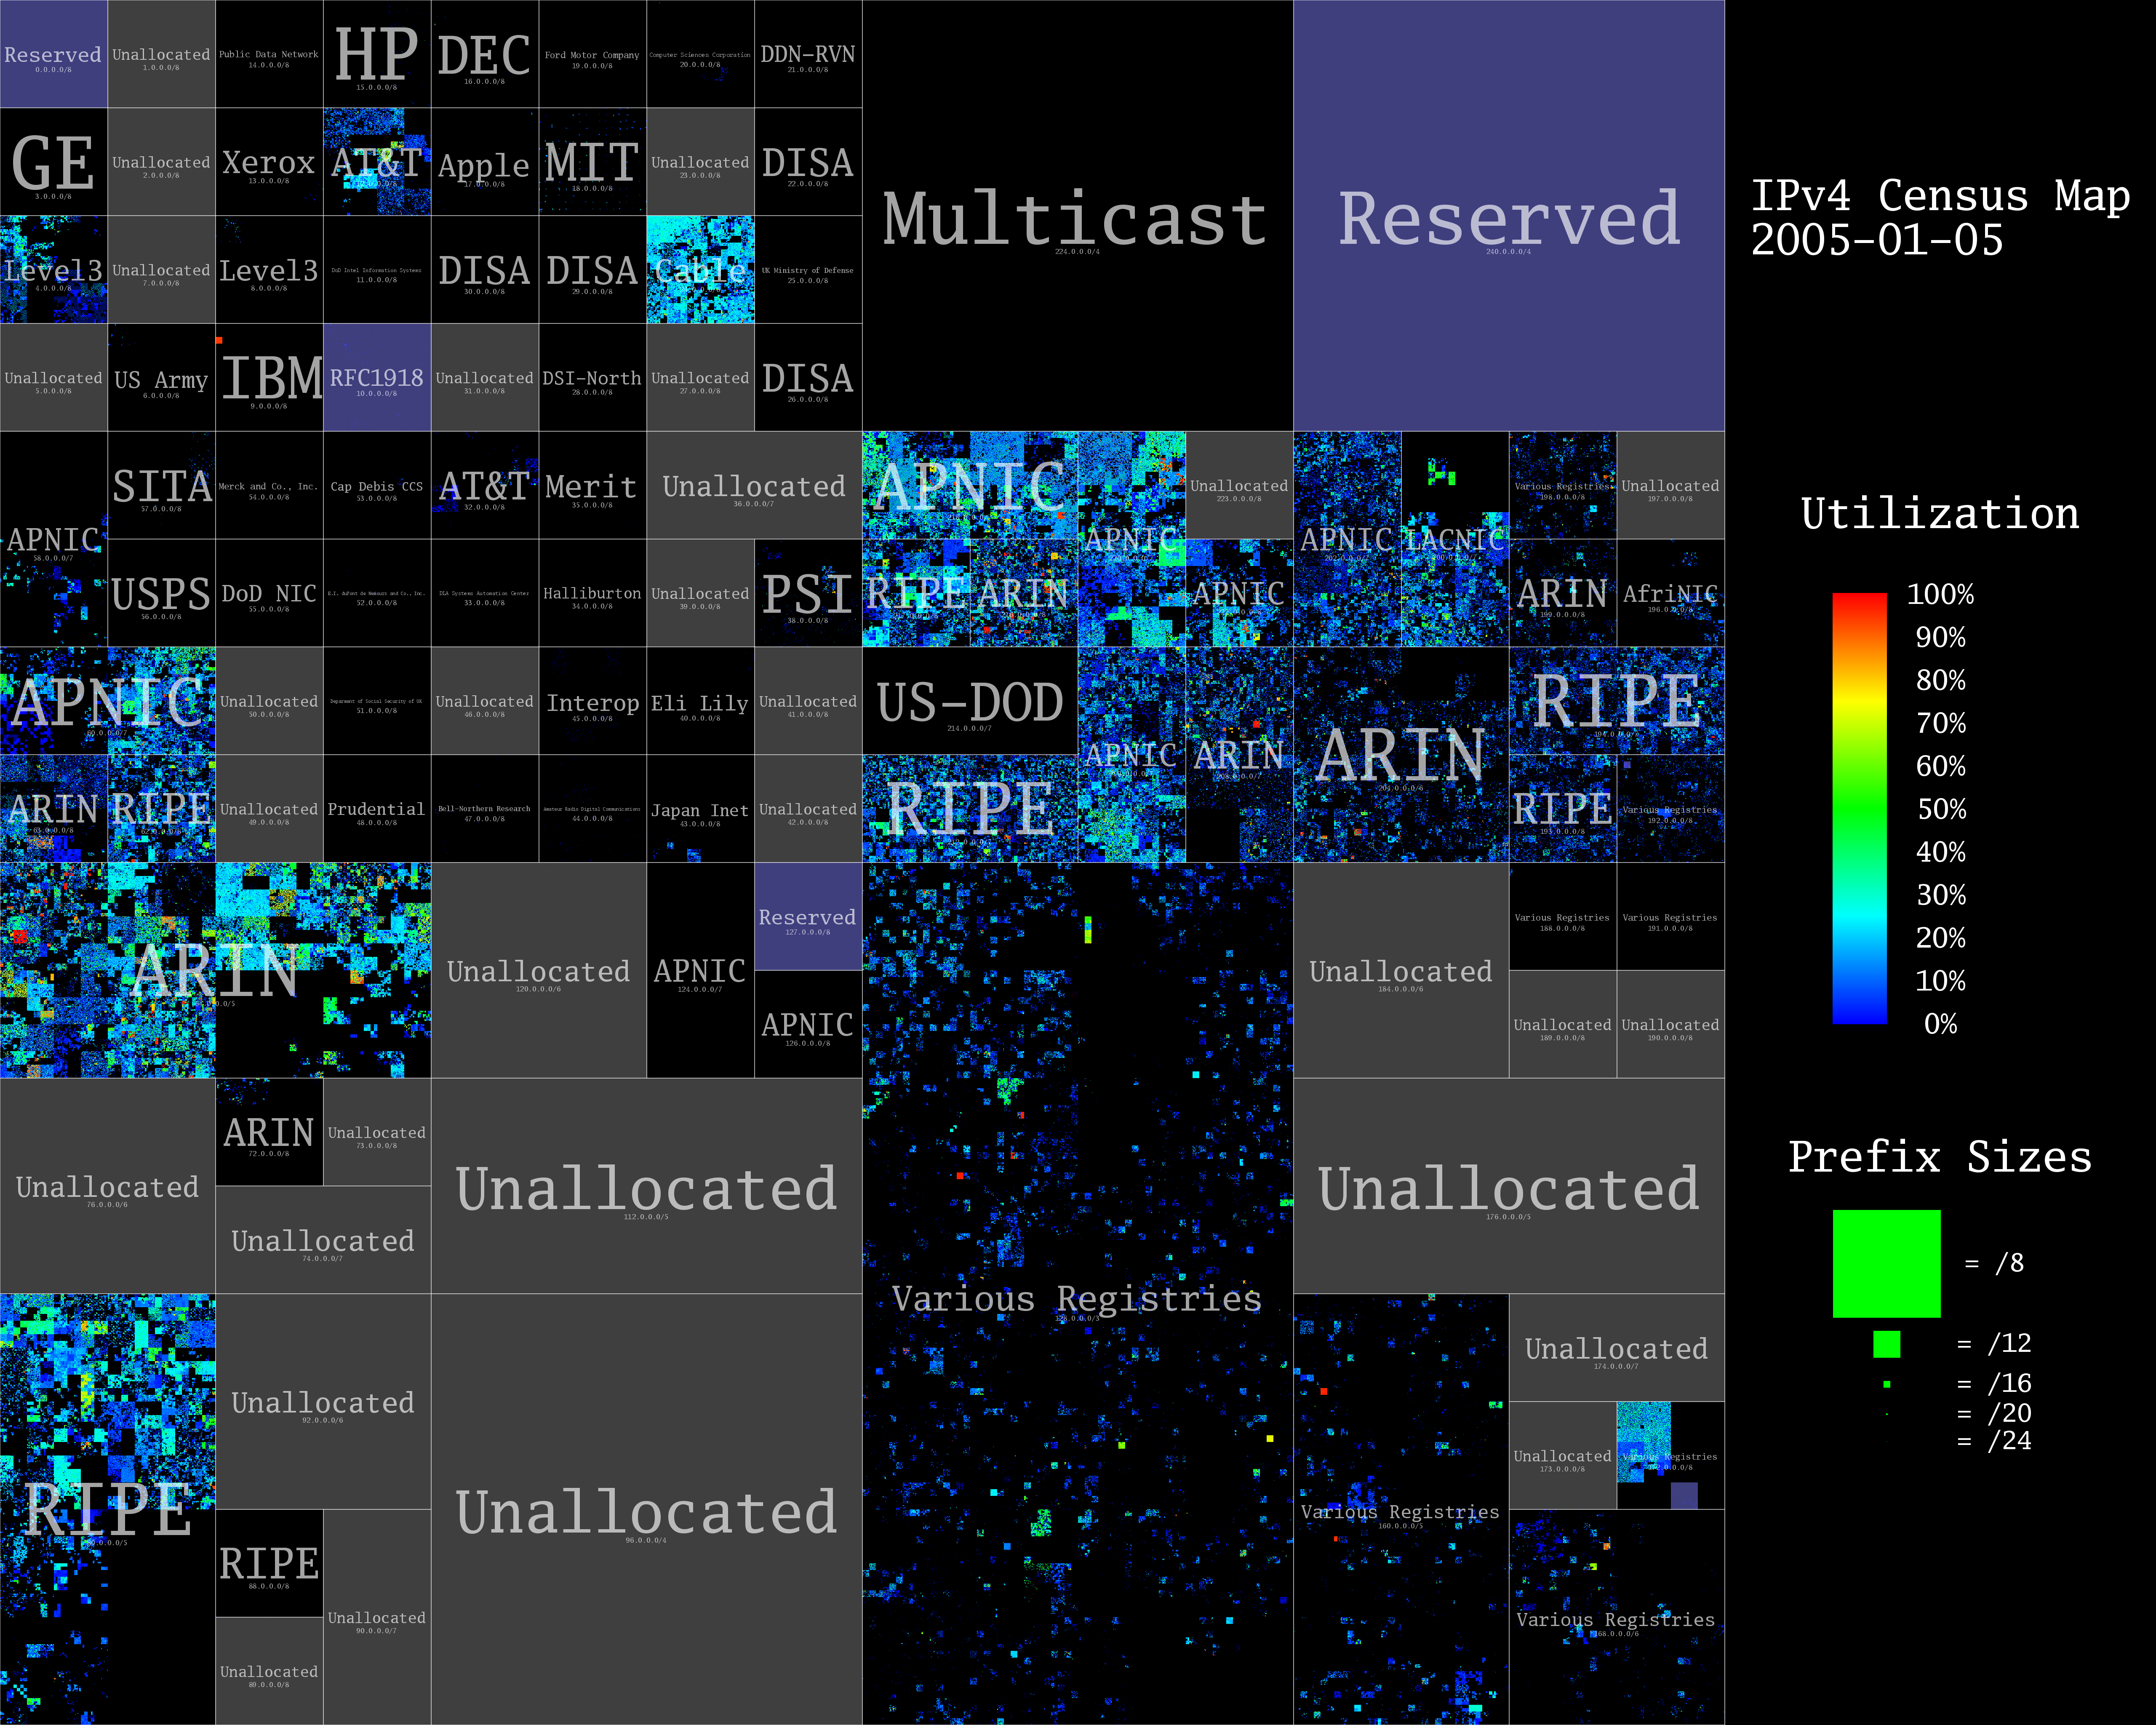
Lander Census 2003-2006
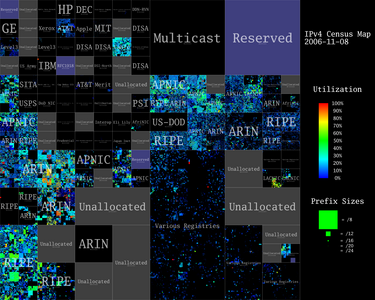
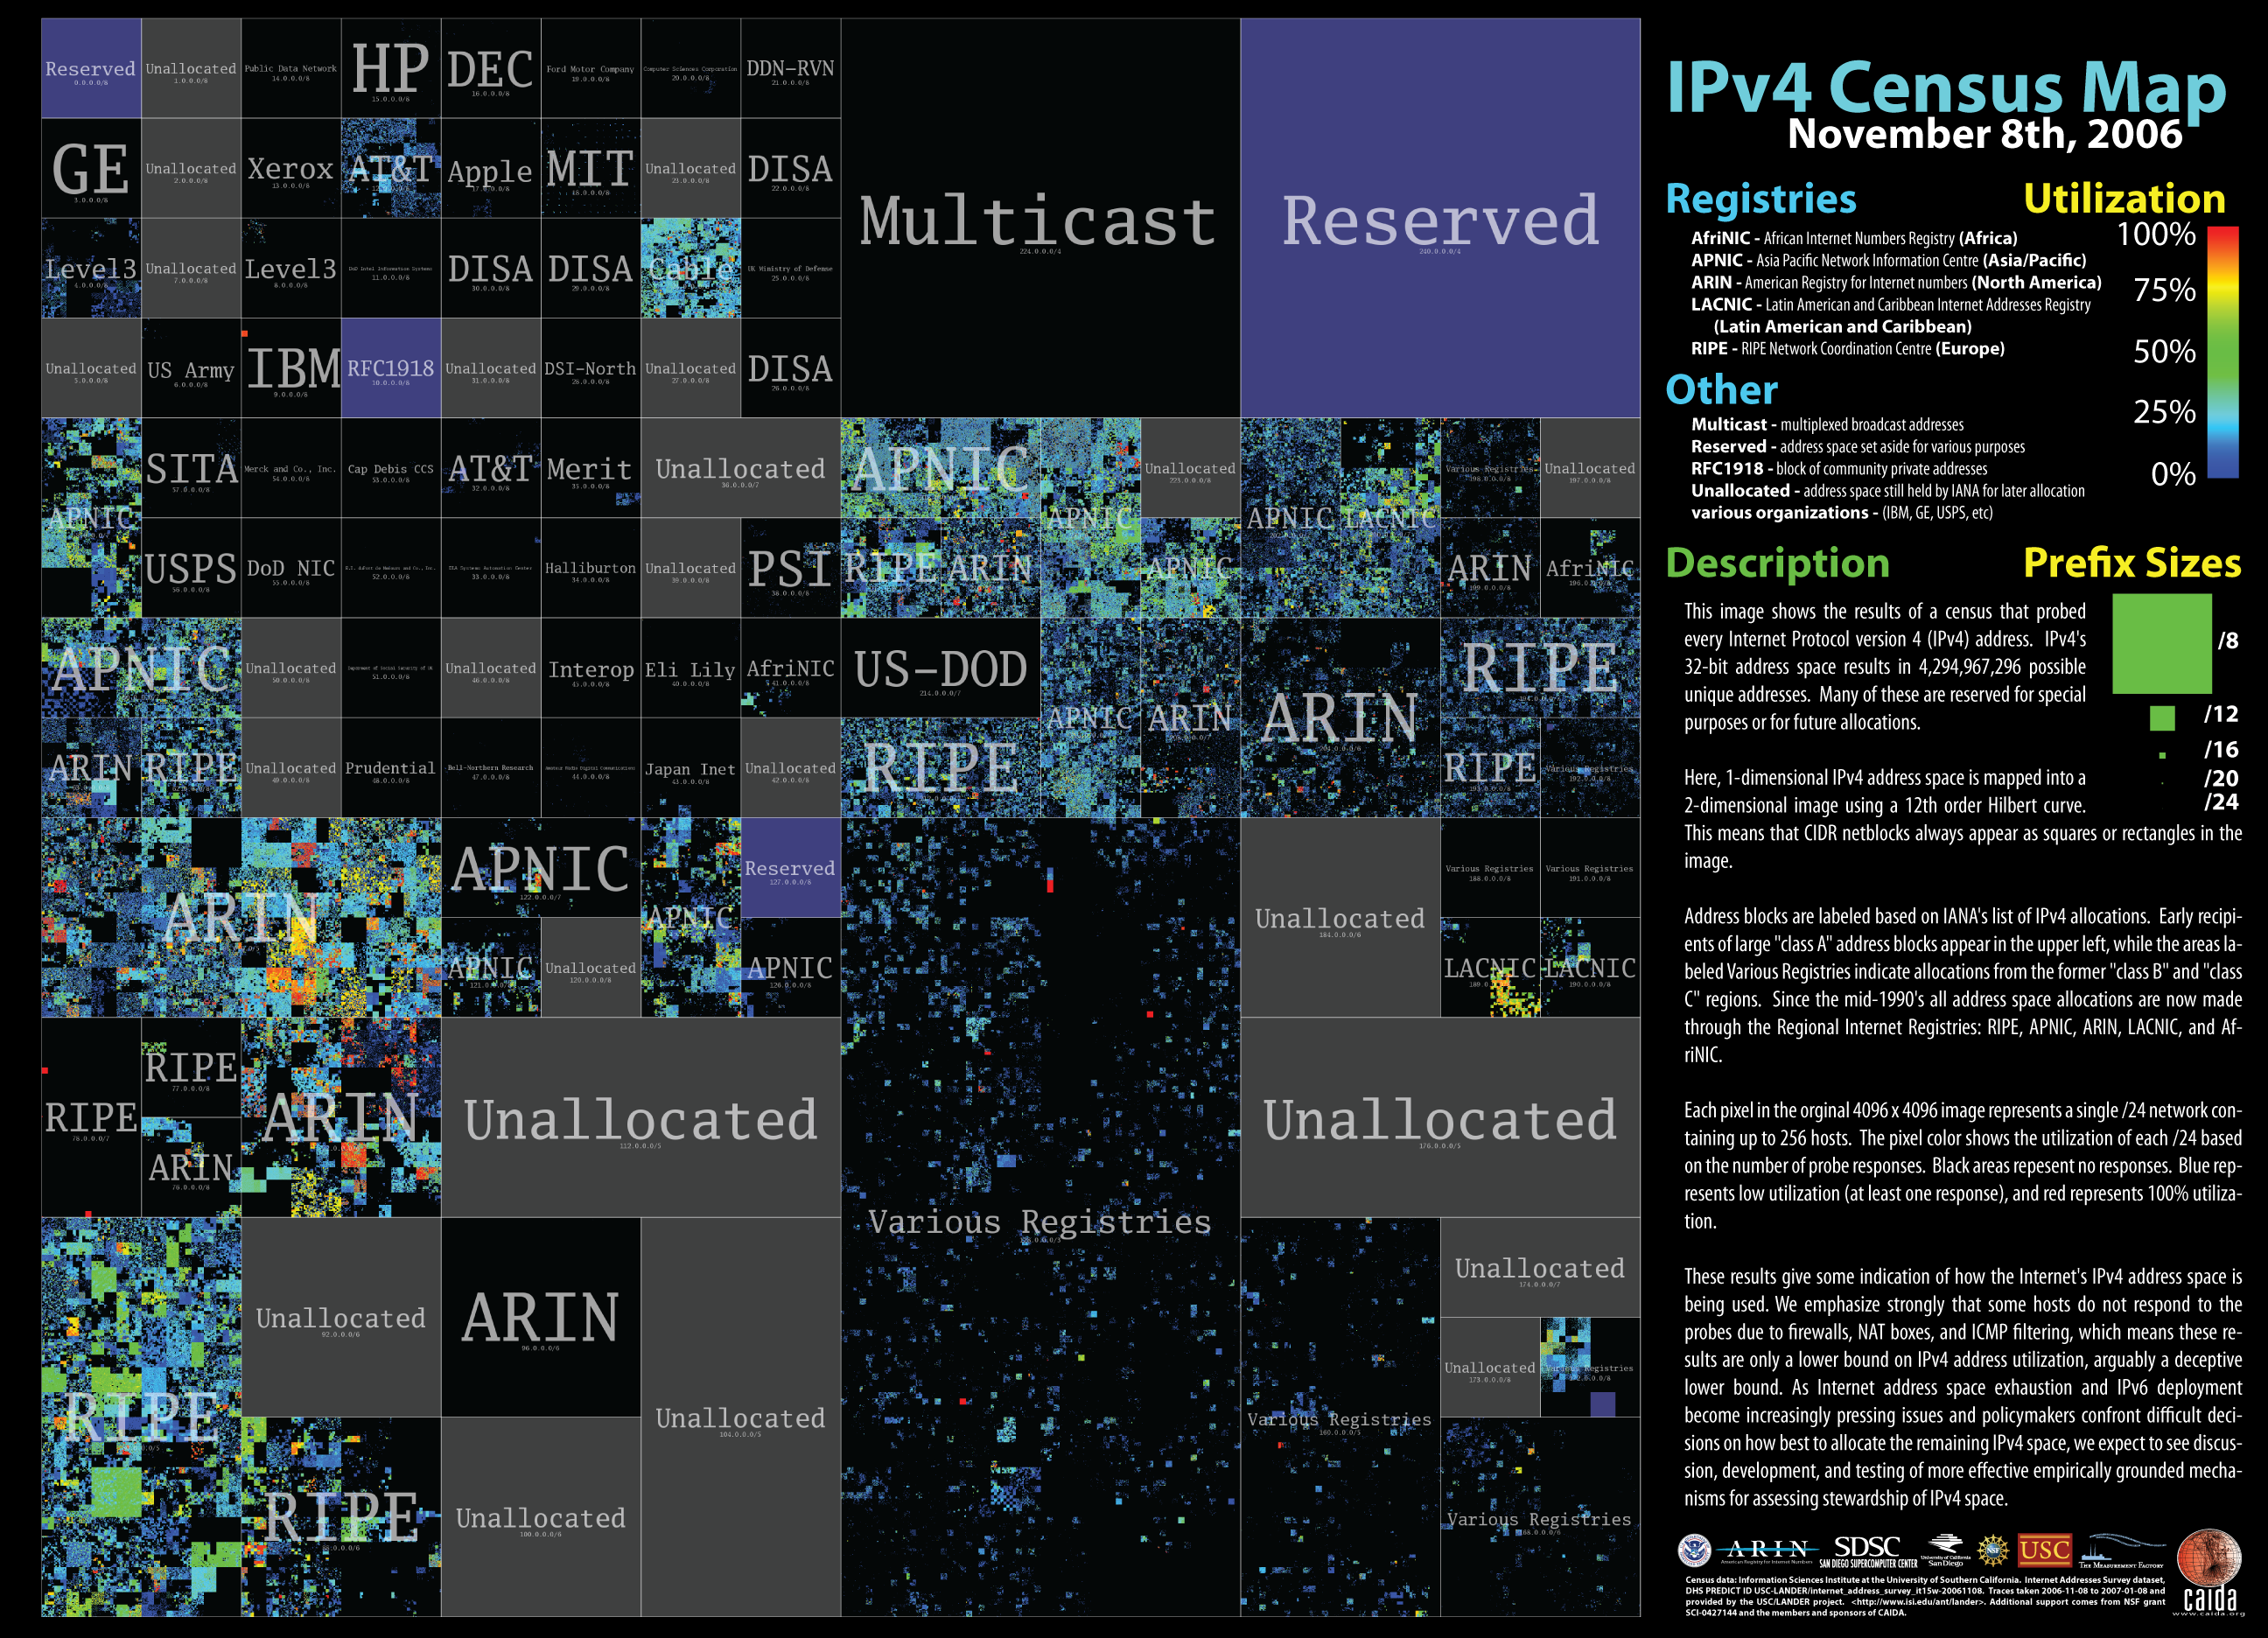
This image shows the results of a census taken by the LANDER project that probed every Internet Protocol version 4 (IPv4) address with an ICMP echo request (ping) packet. IPv4's 32-bit address space results in 4,294,967,296 possible unique addresses. Many of these are reserved for special purposes or for future allocations, and were not included in the census. The census sets out to ping all IPv4 addresses allocated by the Internet Assigned Numbers Authority (IANA) with a fixed number of outstanding probes (1200) and a 5 second timeout resulting in a rate of approximately 250 probes per second [1].
This visualization of the IPv4 address space was created by The Measurement Factory under subcontract to CAIDA. CAIDA also produced a poster version with legend and descriptive text. The ANT Lab's LANDER project also publishes a similar map of the address space with a summary of the research, the datasets, and related papers.
These results give some indication of how the Internet's IPv4 address space is being used. We emphasize strongly that some hosts do not respond to the probes due to firewalls, NAT boxes, and ICMP filtering, which means these results are only a lower bound on IPv4 address utilization, arguably a deceptive lower bound. As Internet address space exhaustion and IPv6 deployment become increasingly pressing issues and policymakers confront difficult decisions on how best to allocate the remaining IPv4 space, we expect to see discussion, development, and testing of more effective empirically grounded mechanisms for assessing stewardship of IPv4 space.
Animation
The animation combines the results of the surveys from mid-2003 through 2006.
- Entire IPv4 space (27 MB 750x600 mpeg)
Additional images
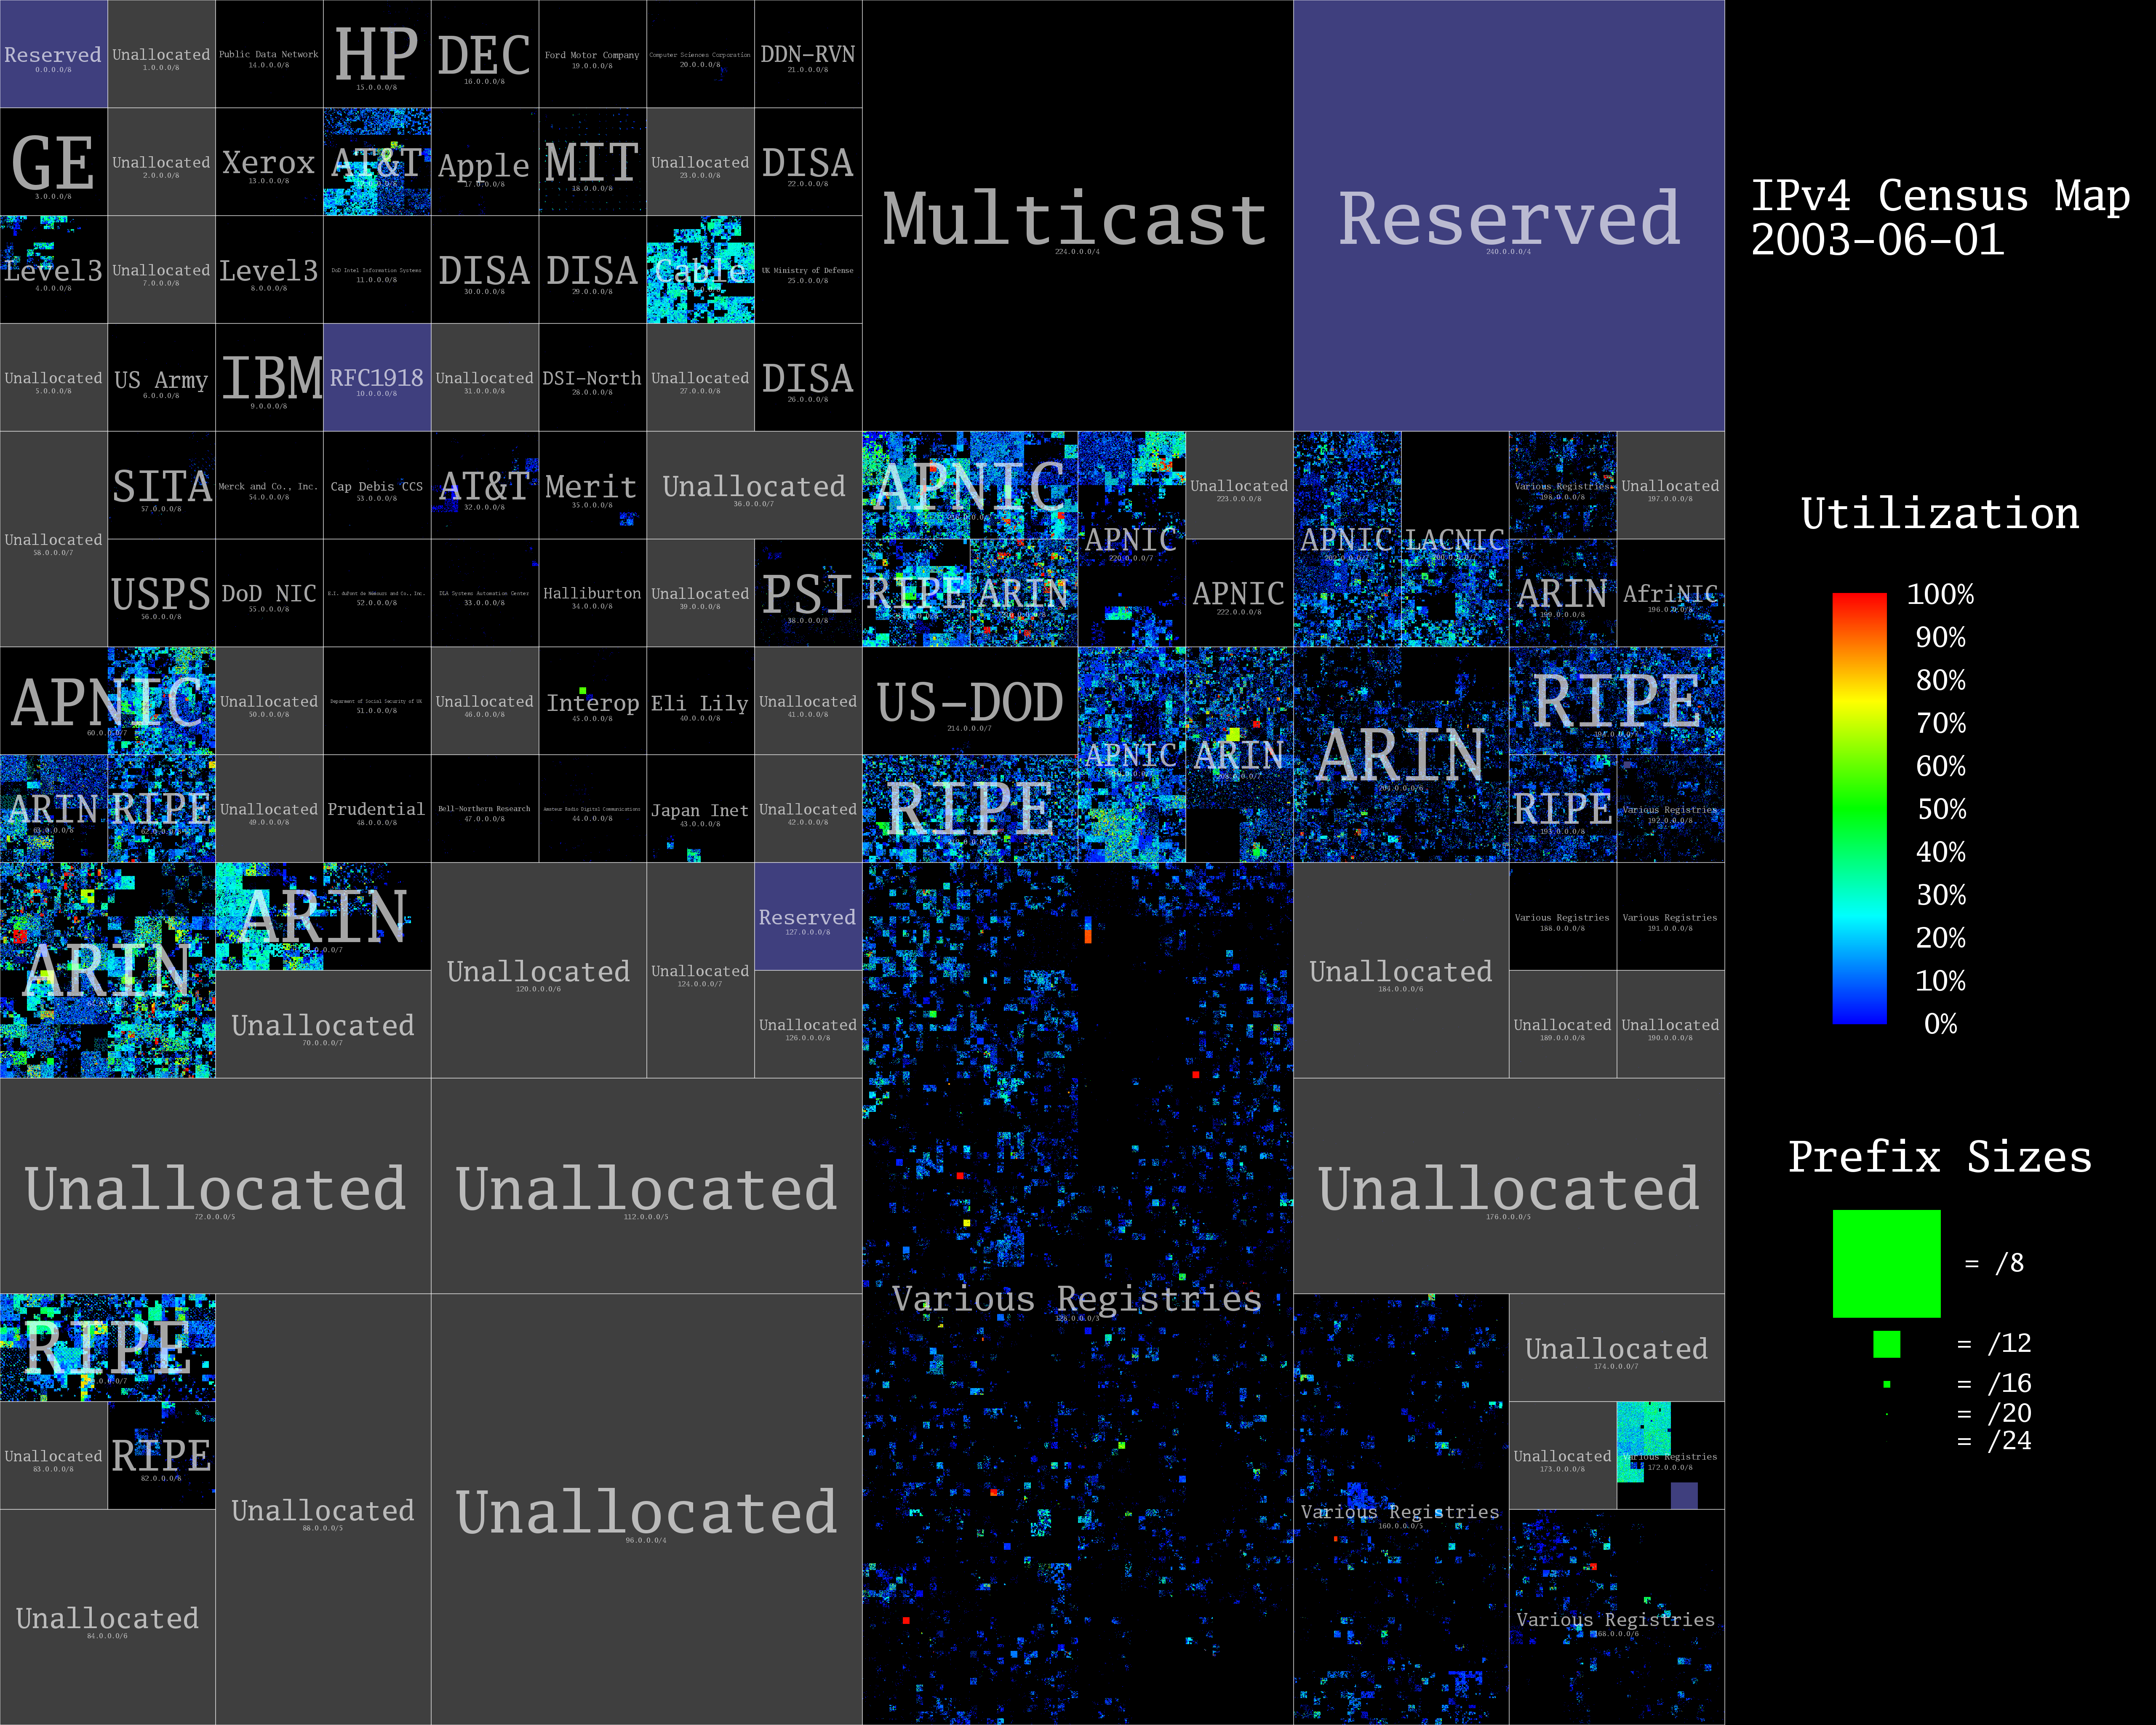
The following images show the results of numerous surveys going back to mid-2003. Each image is 5120x4096 pixels and about 5 MB.
- 2003-06-01 (ICMP1)
- 2003-10-08 (ICMP2)
- 2004-06-21 (IT1)
- 2004-08-30 (IT2)
- 2005-01-05 (IT4)
- 2005-02-25 (IT5)
- 2005-07-01 (IT6)
- 2005-09-02 (IT7)
- 2005-12-14 (IT9)
- 2006-03-07 (IT11)
- 2006-04-13 (IT12)
- 2006-07-11 (IT13)
- 2006-09-14 (IT14)
- 2006-11-08 (IT15)
Census Data
The census data was provided by Information Sciences Institute at the University of Southern California. Internet Addresses Survey dataset, DHS PREDICT ID USC-LANDER/internet_address_survey_it15w-20061108. Traces taken 2006-11-08 to 2007-01-08. Provided by the USC/LANDER project. http://www.isi.edu/ant/lander/. Additional support comes from NSF grant SCI-0427144 and ARIN but does not necessarily reflect the opinions of any of the sponsoring organizations.
References
1. John Heidemann, Yuri Pradkin, Ramesh Govindan, Christos Papadopoulos, and Joseph Bannister. Exploring Visible Internet Hosts through Census and Survey. Technical Report ISI-TR-2007-640, USC/Information Sciences Institute, May, 2007.