IPv4 Address Space Concentration
Introduction
The motivation for this work is the following broad question:
What drives the demand for IPv4 address space?
The many facets to this complex question make a full analysis infeasible, so the analysis presented here focuses on the following much more narrowly-defined question:
Do new players (organizations that have received only 1 allocation) or old players (organizations that have received multiple allocations over time) drive the growing demand and consumption of IPv4 address space?
We want to understand how the address space is distributed among and concentrated in two categories of organizations, the new players and the old players. Naively speaking, if new players hold most of the address space, then they drive the demand for new space and thus an expansion of the Internet itself through increases in the number of participant networks and thus diversity of connectivity around the world. Conversely, if old players hold most of the address space, then they drive demand for new space and thus expansion of existing networks through increases in host density of existing networks, rather than by increases in the number of independent networks. The underlying causes of demand for IPv4 space are more complex than these naive interpretations suggest; here we take only first steps toward analyzing this issue.
In summary, we find a definite trend in address allocations toward increasing concentration of address space in old players. As of August 2005, old players make up only between 2% and 11.2% of all organizations, but they hold more than half of the address space. We also find that most organizations have relatively few allocations. Depending on the method of counting, there are between 188k and 1.07M organizations in our dataset. Of these, only 28 organizations have 32 or more allocations, and fewer than 500 organizations have 8 or more allocations. So the vast bulk of organizations have fewer than 8 allocations. In answer to our narrower question, we can say that old players make use of most of the address space, and we naively interpret this to mean that expansion of existing networks, rather than emergence of new networks, drives demand for IPv4 space.
The remainder of this page describes our methodology, presents the details of our analysis, and provides links to our analysis scripts and data.
Methodology
We first delineate three aspects of IPv4 address space: allocated space, routed space, and occupied space. Allocated space is the address space given by a Regional Internet Registry (RIR) to an organization for use. Routed space is allocated space that actually appears, via BGP announcement, as a route in global routing tables. Occupied space is allocated space that has actually been assigned to end hosts, routers, or other network devices. Information on allocated space appears in whois records, while BGP tables contain information on routed space. Information on occupied space is not readily available, though it can be partly inferred through active network measurements.
Which of these aspects of address space to study depends on the goal of the analysis. We first seek to understand the group dynamics and other macroscopic properties of address space allocation to support informed policy making. Specifically, we are interested in studying the way IPv4 space has been distributed to, and concentrated in, organizations over time, and thus we only analyze allocated address space.
This analysis makes use of the allocation event as the measurement unit, which we define as all of the address blocks (1 block in the common case) allocated to a given organization on the same date. For example, if some organization X received 3 non-overlapping address blocks on Jan 1st and 2 non-overlapping address blocks on Feb 15th, then we say X has 2 allocations rather than 5 allocations. We formulate our definition in this way because of our interest in allocation behavior, since the allocation of multiple address blocks on the same date likely represents a single allocation event. We then replay the sequence of address allocations made over time, as recorded in whois records, to reconstruct the distribution of address space to organizations at each time step. To classify organizations as new players and old players, we keep track of the number of allocations each organization has received up to a given point in time.
We base our analysis on address allocation data from a full whois dump from ARIN on Aug 31, 2005. (The concise ARIN allocation statistics files publicly available for download do not include information on which organization has received each block of address space and thus are unsuitable for our analysis.) To identify organizations, we rely on the value of the OrgID field, which is a key in the ARIN database that links together address blocks and organizations. No other RIR provides whois dumps with such a well-defined mandatory link between address blocks and organizations, and this is the main reason why we have confined our analysis to ARIN data only. We leave the analysis of data from the other RIRs to future work.
ARIN whois dumps are a rich source of allocation data and include some of the earliest allocations ever made. However, to provide a more insightful analysis, and one perhaps more representative of the recent trends across all RIRs, we exclude the following from our analysis:
- /8 allocations made directly by IANA to end sites prior to the establishment of the RIRs (e.g., the 18.0.0.0/8 allocation to MIT),
- allocations managed by the US Department of Defense NIC (DoDNIC), and
- allocations managed by JPNIC.
The ARIN whois dumps contain a large number of fine-grained suballocation records; for example, there are DSL providers who have entered a whois record for each of their customers--a mix of home users and small organizations. These special customer records have an easily identifiable OrgID value in the ARIN records; namely, they consist of the letter "C" followed by 8 decimal digits, e.g., C00797141. The first dataset contains these customer records, but including them in our analysis has some potential drawbacks because not every customer record represents an organization and because some organizations have multiple customer OrgID values. Therefore, to balance our analysis, we also examine a second dataset, obtained by pruning out all 883k customer records from the first dataset. The second dataset has 188k OrgID values and on the order of 250k overlapping allocated blocks covering the same amount of address space as the first dataset (there is actually a slight discrepancy of 0.026% or the equivalent of a /14.5). The excluded customer records cover about 3.3 /8's worth of space (that overlaps with the retained blocks in the second dataset).
Results
We present our analysis results mainly in the form of plots. These plots show address allocations as a time series broken down by the category of the receiving organization. The 7 categories (1, 2, 3, 4-7, 8-15, 16-31, and 32+) are defined by the number of allocations received by an organization over time. For instance, the 1 category represents organizations that have only received 1 allocation up to a given point in time, while the 32+ category represents organizations that have received 32 or more allocations up to a given point in time. These 7 categories are a refinement of the informal categories defined in the introduction, with the 1 category corresponding to the new players and the remaining categories corresponding to the old players.
We create the plots as follows: for a date t, we examine all prefixes that are allocated on or before t [the set P(t)], and based on the number of prefixes held by each organization at the time t, determine the exact fraction of the total address space [covered by P(t)] held by each category of organization. This breakdown appears on a plot as a vertical slice at x=t. We then repeat this process for every date t on the x-axis. Note that the breakdown computed at x=t is never influenced in any way by prefixes allocated after t. See the Methodology Details appendix for full details on how the address space covered by overlapping prefixes is attributed to the organizations holding those prefixes.
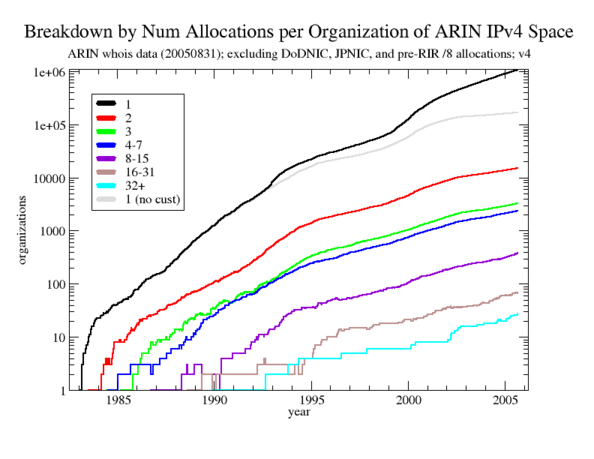
Figure 1. Breakdown by count of organizations in each category for both datasets. The biggest difference is in the count of the 1 (new players) category, which ends at 1.05M for dataset 1 (black line) and at 167k for dataset 2 (grey line). The differences in the other categories are minor and are not shown. (This is not a stacked plot, unlike all remaining plots.)
Figure 1 shows the breakdown of allocations by the count of organizations in each category for both datasets, and illustrates the main difference between the two datasets. Dataset 1 includes customer records while dataset 2 does not, and the impact of these records is to significantly increase the number of organizations in the 1 (new players) category for dataset 1 (black line), which reaches 1.05M at the end. In contrast, the corresponding count is only 167k for dataset 2 (grey line). There are around 35 times more new players than old players when customer records are included (dataset 1) and around 6 times more new players when customer records are excluded (dataset 2). Thus, even without the special customer records, new players dominate in count.
Only 28 organizations have 32 or more allocations (the 32+ category), and fewer than 500 organizations have 8 or more allocations (the 8-15, 16-31, and 32+ categories). These counts are small even when compared to the lesser of the new player counts, 167k for dataset 2, which is at least 3 orders of magnitude greater than 28 and at least 2 orders of magnitude greater than 500. Hence, organizations do not commonly have many allocations (which does not necessarily imply anything about the amount of address space held by organizations, since individual allocations can vary greatly in size, e.g., from a /9 to a /29).
There are also slight differences in the counts of the other categories between the two datasets, but they make little qualitative difference.
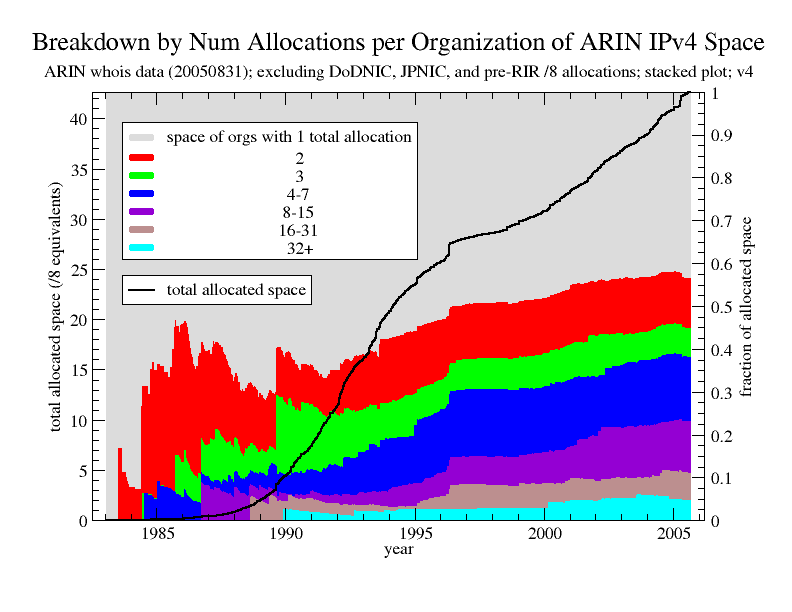
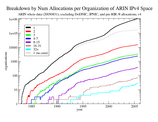
Figure 2 is a stacked plot for the first dataset showing (on the right y-axis) the breakdown of allocations by the amount of space held by each category of organization, plotted as a fraction of total allocated space at a given point in time. The figure also shows (on the left y-axis) the total amount of allocated space over time. Fewer than the equivalent of 5 /8's were allocated prior to 1990, so we consider the breakdown only for the period after that year. The trend in the breakdown is toward an increasing concentration of the address space in old players -- by August 2005, old players hold 56.4% of the address space.
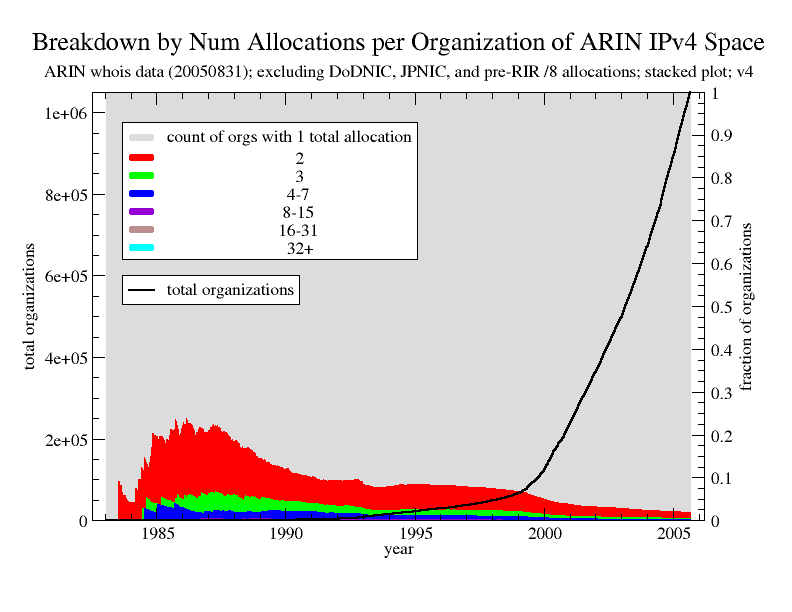
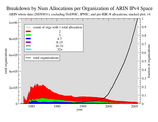
Figure 3 is complementary to Figure 2 and presents a stacked plot for the first dataset showing (on the right y-axis) the breakdown of allocations by the count of organizations in each category. The graph shows a count of organizations as a fraction of the total number of organizations at a given point in time. The figure also shows (on the left y-axis) the total number of organizations over time. The tremendous apparent growth in the number of organizations after 2000 is largely due to the increasing number of customer records. The trend in the breakdown is toward the old players making up a decreasing fraction of the total, and by August 2005, old players make up fewer than 2%. More impressively, fewer than 2% of all organizations hold 56.4% of the address space. However, the large disparity suggested by this figure may be an overestimation caused by the possible incorrect inflation of the new player count by the 883k customer records in the dataset. Therefore, we cautiously interpret the figure as suggesting an upper bound on the disparity. See Figure 5 for a lower bound.
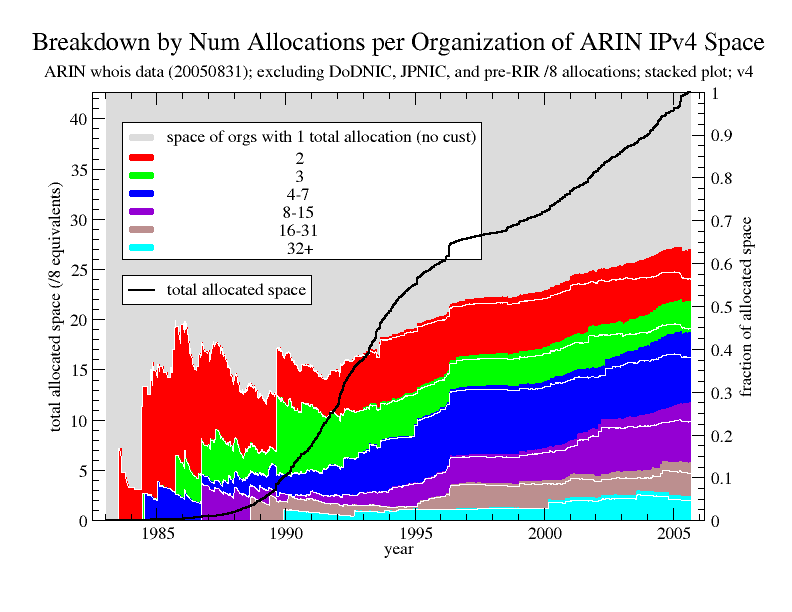
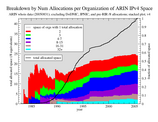
Figure 4. Breakdown by normalized amount of space in each category for dataset 2 (which does not include customer records). Even more so than for dataset 1, the trend shows an increasing concentration of the address space in old players, and by August 2005, old players make up 63.4% of the address space. For comparison, the white lines show the corresponding counts for dataset 1. (Stacked plot.)
Figure 4 shows the same type of information as Figure 2 but for dataset 2. For comparison, the figure also includes white lines showing the corresponding counts for dataset 1. The trend shows an increasing concentration of the address space in old players, even more so than for dataset 1, and by August 2005 , old players hold 63.4% of the address space. As one would expect, the even higher concentration in dataset 2 is caused by a shift to the old players of much of the 3.3 /8's covered by customer records. Most of this shift is to the 4-7, 8-15, 16-31, and 32+ categories.
Because of the exclusion of customer records, the degree of address space concentration suggested by this plot is most likely an overestimation and therefore should be considered an upper bound. Similarly, the degree of concentration suggested by Figure 2 should be considered a lower bound.
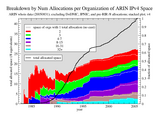
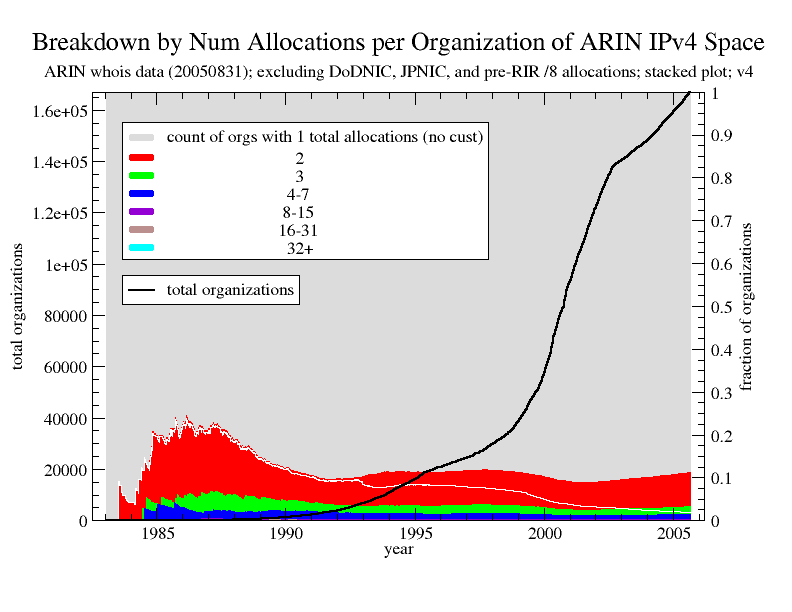 Figure 5. Breakdown by normalized count of organizations in
each category for dataset 2 (which does not include customer
records). Despite more than a 100-fold increase in the total
number of organizations, the ratio of new players to old
players remains relatively steady from 1990 onwards. For
comparison, the white line shows the normalized count of the
1 category for dataset 1. (Stacked plot.)
Figure 5. Breakdown by normalized count of organizations in
each category for dataset 2 (which does not include customer
records). Despite more than a 100-fold increase in the total
number of organizations, the ratio of new players to old
players remains relatively steady from 1990 onwards. For
comparison, the white line shows the normalized count of the
1 category for dataset 1. (Stacked plot.)
Figure 5 shows the same type of information as Figure 3 but for dataset 2. For comparison, the figure also includes a white line showing the normalized count of the 1 category for dataset 1. Despite more than a 100-fold increase in the total number of organizations, the ratio of new players to old players remains relatively steady from 1990 onwards, a marked contrast to the increasing dominance of new players for dataset 1. Although the growth rates are similar, new players still dominate over old players in absolute number, with old players making up only 11.2% of all organizations in Aug 2005. In other words, by August 2005, 11.2% of all organizations hold 63.4% of the address space.
Because of the exclusion of customer records, the degree of disparity suggested by this plot is most likely an underestimation and therefore should be considered a lower bound. Similarly, the degree of disparity suggested by Figure 3 should be considered an upper bound.
Conclusions
Our analysis shows a trend in address allocations toward an increasing concentration of the address space in old players. For dataset 1, which considers customers as organizationally independent of their provider, fewer than 2% of organizations hold 56% of the address space, while for dataset 2, which considers customers as part of their provider's organization (consistent with the difficulty of changing providers without changing addresses), around 11% of organizations hold 63% of the space.
We also find that most organizations have relatively few allocations. In particular, fewer than 500 organizations have 8 or more allocations, and the number of organizations with fewer than 8 allocations is at least 2 orders of magnitude greater than 500 (dataset 1 has 187k total organizations, and dataset 2 has an upper bound of 1.07M total organizations). These 500 organizations hold an equivalent of between 10 and 12 /8's, or around a quarter of the total ARIN space covered by our analysis.
In answer to our narrower question, we can say that old players control most of the address space. Under the naive interpretation, this suggests that expansion of existing networks drives the demand for IPv4 space rather than the creation of new networks. A more thorough interpretation is left as future work.
Appendix A: Methodology Details
This appendix describes in detail the procedure for attributing the address space covered by overlapping prefixes to the organizations holding those prefixes. Two prefixes can overlap in only one way; namely, with one prefix wholly enclosed within the other. (Partial overlap between two prefixes is illegal and does not occur in our dataset. When two prefixes are equal, we exclude the prefix with the older allocation date from our analysis.) We employ the three rules described in the remainder of this section to handle overlapping prefixes.
In the following descriptions, we represent a prefix with the notation (1-----), where parentheses and hypens indicate the span of the prefix and where the enclosed number is an arbitrary ID that also indicates the allocation order. Time always flows from top to bottom--that is, prefixes on the same line represent allocations made at the same time, while prefixes on two separate lines represent allocations made one after another, with the prefix higher up on the page being allocated earlier than the prefix lower down on the page.
- Rule 1 (Null). We ignore a suballocation by the same organization.
            (1-------------------------)   OrgID: X
            (2----------)                  OrgID: X
If an organization holding a prefix makes a suballocation of that prefix to itself, then we ignore that suballocation in our analysis; that is, all the space covered by the suballocation is counted only in the larger enclosing prefix. For example, suppose an organization has a /16 assigned to it, from which it makes a /24 suballocation also registered to itself. Then that /24 suballocation is ignored for the purposes of counting. This rule doesn't apply to suballocations assigned to a different organization (e.g., an ISP may have a /16 from which it has assigned /24's to customers).
In the following diagram, we show the application of Rule 1 to the suballocation of prefix 2 from 1 shown in the above diagram. The line of dots (....) indicates the span of a prefix that is ignored.(1-------------------------) (2..........)
- Rule 2 (Suballocation). When a suballocation is to a different organization, the space covered by the suballocation is not counted in the parent prefix.
            (1-------------------------)   OrgID: X

            (2----------)                  OrgID: Y
If an organization holding a prefix makes a suballocation of that prefix to another organization, then the space covered by the suballocation is counted in the suballocation but not in the original parent prefix. That is, for the purposes of counting, we effectively transfer the address space covered by a suballocation from the parent prefix to the suballocation. In the above example, organization X has made a suballocation of prefix 1 to organization Y, leading to the transfer of the overlapping address space from prefix 1 to prefix 2, as the following diagram illustrates. We indicate this transfer of address space by cutting out the suballocation from the parent prefix. (We use the vertical bar character "|" simply to visually reinforce the boundary of the suballocation.)(1..........|--------------) OrgID: X (2----------) OrgID: Y
- Rule 3 (Subsumption). When a prefix subsumes a smaller prefix allocated earlier,
the overlapping address space is not counted in the larger prefix.
            (1----------)                  OrgID: X

            (2-------------------------)   OrgID: Y
Normally, a smaller prefix is suballocated from a larger prefix, but sometimes the process is reversed, with a larger prefix being allocated later that subsumes an existing smaller prefix. For the purposes of counting, when subsumption occurs, the address space of the overlapping region in the larger prefix is not counted with the larger prefix but attributed to the smaller prefix. Effectively, a hole, equal to the smaller prefix, is punched out of the larger prefix, as the following diagram shows:(1----------) OrgID: X (2..........|--------------) OrgID: Y
The following series of diagrams illustrates the application of the above three rules. The 5 rows represent 5 consecutive time steps, with a single prefix being introduced at each successive step.
| Time Step | Rule | State |
|---|---|---|
| 0 | n/a |
(1----) (2----------------)
|
| 1 | suballocation |
       (1----)       (2-----|..........)
                            (3---------)
|
| 2 | subsumption |
       (1----)       (2-----|..........)
       |     |       |      (3---------)

(4-----|.....|-------|.................|-----)
|
| 3 | suballocation |
       (1----)       (2-----|..........)

       |     |       |      (3....|----)
(4-----|.....|-------|......|.....|....|-----)

                            (5----)
|
| 4 | suballocation & subsumption |
       (1----)       (2-----|..........)

       |     |       |      (3....|----)
(4-----|.....|---|...|......|.....|....|.....)

                 |   |      (5----)    |     |
                 (6--|.................|-----)
|
Appendix B: Analysis Scripts and Processed Data
The full set of scripts needed to perform the analysis described on this page is available at ipv4-concentration-analysis-1.0.tar.gz
You must additionally request and download a bulk whois dump from ARIN. To exactly reproduce our work, you must have the bulk whois dump from 2005-08-31, but because whois dumps are not archived, older snapshots like this are unlikely to be available from ARIN.
The Xmgrace project files, which contain data as well as plot settings, for the 5 plots appearing on this page are also available for download. The plot thumbnails below link to the corresponding project files. To download a project file, right-click a thumbnail and choose Save Link As... (or the equivalent for your browser).
|
|
| |||
|
|