

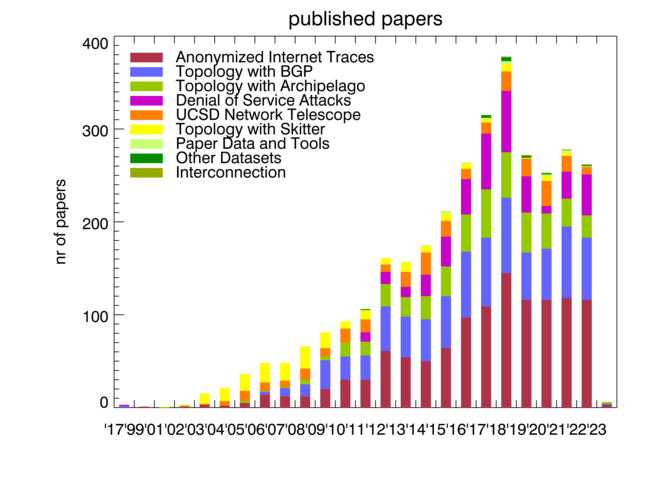
Publications Using CAIDA Online Datasets
Users of CAIDA online data are asked to provide information about
publications appearing in the scientific literature that use CAIDA
data. In addition we periodically search the scientific literature for
additional publications. Detailed information about these papers
can be found in the list of
Non-CAIDA Publications using CAIDA
Data.
It should be noted that because literature searches (which turn up the bulk
of the papers listed) are done only about twice a year. Hence the counts for the
most recent year can be very incomplete, representing numbers after the
last literature search.
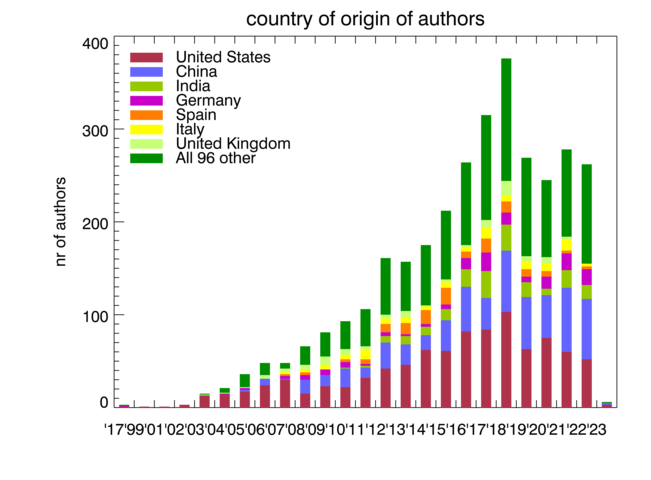
Geographical Distribution of Authors and Co-Authors
Using the affiliations provided in the publications we track the geographic distribution of all first authors.
The table lists the number of first authors for each country of origin encountered.
Number of authors per country
As determined from author affiliations specified in papers.
The count includes authors and co-authors
There are 3255 papers with 2118 different authors in 105 countries
The average number of authors per paper is 1.0
The count includes authors and co-authors
There are 3255 papers with 2118 different authors in 105 countries
The average number of authors per paper is 1.0
| United States | 929 | Singapore | 16 | Vatican City State (Holy See) | 4 | Haiti | 1 |
| China | 553 | Norway | 15 | Bangladesh | 3 | Hong Kong | 1 |
| India | 173 | Austria | 13 | Croatia (Hrvatska) | 3 | Honduras | 1 |
| Germany | 139 | Saudi Arabia | 12 | Slovenia | 3 | Estonia | 1 |
| Spain | 121 | Pakistan | 10 | Senegal | 3 | Egypt | 1 |
| Italy | 101 | South Africa | 10 | Denmark | 3 | Ethiopia | 1 |
| United Kingdom | 92 | Viet Nam | 10 | Lebanon | 3 | Morocco | 1 |
| France | 88 | Argentina | 10 | Iceland | 3 | Mali | 1 |
| Canada | 86 | Malaysia | 9 | Qatar | 3 | Mauritius | 1 |
| Brazil | 71 | Iran | 9 | Belize | 2 | Mauritania | 1 |
| Japan | 70 | Ukraine | 9 | East Timor (Timor-Leste) | 2 | New Caledonia | 1 |
| Israel | 63 | Russia | 7 | Gabon | 2 | Nepal | 1 |
| Korea (South) | 61 | Tunisia | 7 | Palestine | 2 | Uruguay | 1 |
| Australia | 57 | Colombia | 6 | Panama | 2 | Syria | 1 |
| Switzerland | 48 | Iraq | 6 | Philippines | 2 | USSR (former) | 1 |
| Netherlands | 43 | Serbia | 5 | Macau | 2 | Kuwait | 1 |
| Greece | 30 | Romania | 5 | Cyprus | 2 | Solomon Islands | 1 |
| Belgium | 28 | Chile | 5 | El Salvador | 2 | Algeria | 1 |
| Portugal | 28 | Kenya | 5 | Slovak Republic | 2 | Laos | 1 |
| Sweden | 27 | United Arab Emirates | 5 | Sudan | 2 | Luxembourg | 1 |
| Poland | 24 | Ireland | 5 | Latvia | 2 | Thailand | 1 |
| Taiwan | 24 | Indonesia | 5 | Lithuania | 2 | American Samoa | 1 |
| Great Britain (UK) | 21 | Bulgaria | 4 | Azerbaijan | 2 | Seychelles | 0 |
| Hungary | 21 | Jordan | 4 | Burkina Faso | 1 | Venezuela | 0 |
| Turkey | 21 | Mexico | 4 | Botswana | 1 | ||
| Czech Republic | 20 | Nigeria | 4 | Georgia | 1 | ||
| Finland | 17 | New Zealand | 4 | Ghana | 1 |