

NANOG: graphs: return on investment
NANOG 08 feb 98 1400 kc presentation
NLANR cache workload/performance graphs
NLANR return on investment analysis
9 feb 98
nlanr cache pi: Duane Wessels
wessels@nlanr.net
data analysis: Alex Rousskov
rousskov@nlanr.net
-
It is the mark of an educated mind
to rest satisfied with the degree of precision
which the nature of the subject admits
and not to seek exactness
where only an approximation is possible.
-
--Aristotle
| return on investment (bandwidth) |
cache or not to cache: small ISP
- ISP charged uniformly for outbound bandwidth.
- ISP always has unsatisfied demand
for bandwidth (customers `waiting')
- income proportional to available
bandwidth (new customers same income than old)
- Squid on mid-size unix box
can
support 50 requests/s, 3.9 Mbps, or 2 T1s
(~~0.9 Mbps for various Squid overhead; implies saturating link) - constant byte hit ratio sustainable
cache or not to cache: small ISP
- ISP earns monthly income of $X.
- saving bandwidth can allow ISP to admit new customers, generate more income
- question: will investment
in proxy equipment and supprt pay off and when?
goal: find Y (in months) such that:
(note: income_with_caching(0) =
- equipment_cost,
so initially ISP loses money)
with I =
total monthly
income without caching (current bandwidth)
income_with_caching(Y) >= income_wout_caching(Y)
Y*(I + I*BHR) - equipment - Y*cache.admin== Y*I
solve for Y
cache or not to cache: small ISP
realistic parameters per T1
squid cache boxcost = $10K
equipment = boxcost / 2 (pipes);
cache.admin = $25,000 / 12 (months)
months_to_payoff(equip,admin,bhr,income) = equip/(income*bhr-admin) = Y
months_to_double(eq,man,bhr,in)=months_to_payoff(2*equip,2*admin,bhr,income)
cache or not to cache: small ISP
y-axis: number of months per T1 (1.5MBps)
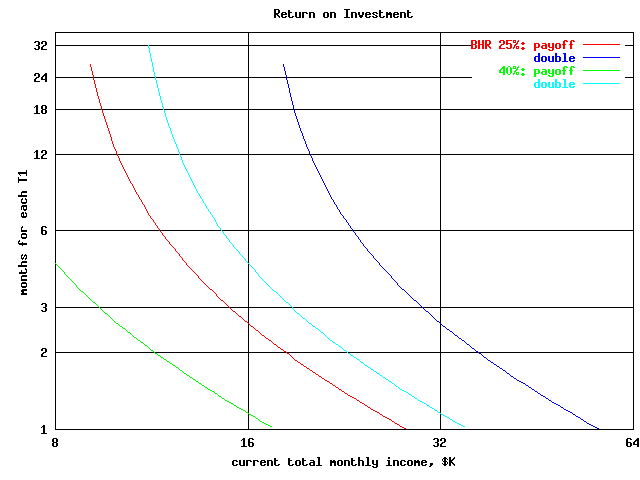
would double its investment in about 2*6=12 months
(2 connections, 6 = 25%: double curve (x=32))
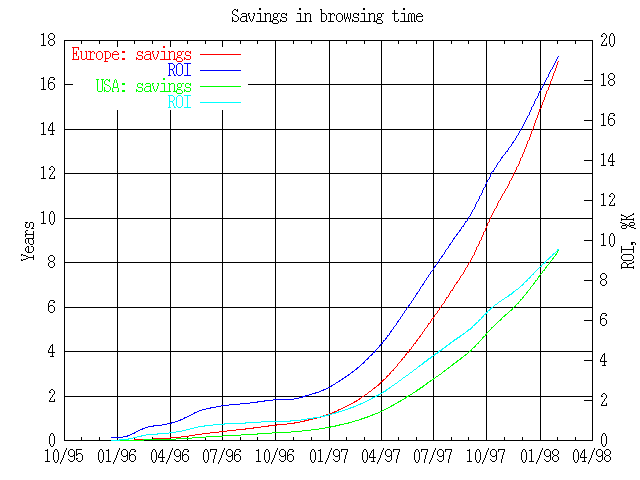
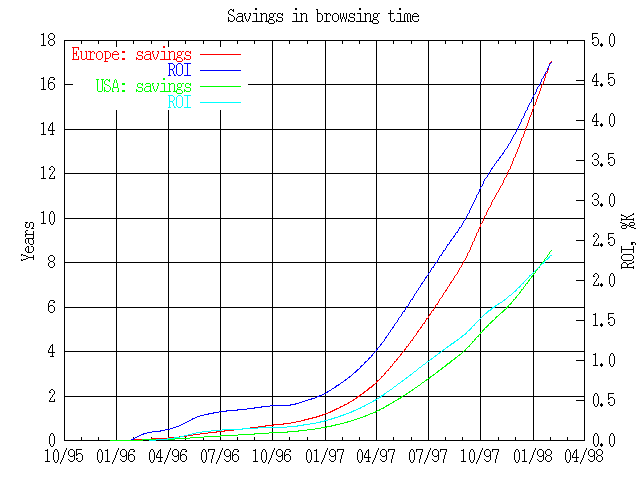
| return on investment (time) |
NLANR supercache latency savings:
average hit saves US about 1 sec, European users ~2 sectotal (crude) NLANR supercache savings in response time:
( sec_saved_per_hit * #hits )
assume investment of 1 hour/day (365 days/yr) to monitor cache hierarchy
profit: time saved so far
ROI = (profit - investment) / investment
9 feb 98, alex/kc, info@caida.org.