

ASA stat newsletter99 paper
Internet measurement and data analysis:
passive and active measurement
passive and active measurement
kc claffy (kc@caida.org)and
Sean McCreary(mccreary@caida.org)
University of California, San Diego
Cooperative Association for Internet Data Analysis (CAIDA)
U.S.A.
University of California, San Diego
Cooperative Association for Internet Data Analysis (CAIDA)
U.S.A.
Scientific apparatus offers a window to knowledge, but as they grow more elaborate, scientists spend ever more time washing the windows. -- Isaac Asimov
The infrastructure of the Internet can be considered the cybernetic equivalent of an ecosystem. The last mile connections from the Internet to homes and businesses are supplied by thousands of capillaries, small and medium sized Internet Service Providers (ISPs), which are in turn interconnected by `arteries' maintained by transit (backbone) providers. The global infrastructure of the Internet consists of a complex array of competing telecommunications carriers and providers, a very difficult infrastructure to analyze diagnostically except within the borders of an individual provider's network. Nonetheless, insights into the overall health and scalability of the system are critical to the Internet's successful evolution.
Attempts to adequately track and monitor the Internet were greatly diminished in early 1995 when the National Science Foundation (NSF) relinquished its stewardship role over the Internet. The resulting transition into a competitive industry for Internet services left no framework for the cross-ISP communications needed for engineering or debugging of network performance problems and security incidents. Nor did competitive providers, all operating at fairly low profit margins and struggling to meet the burgeoning demands of new customers and additional capacity, place a high priority on gathering or analyzing data on their networks. This attitude is strengthened by the general lack of quality measurement or analysis tools to support these endeavors, and the absence of baseline data against which an analyst can track changes in the system's behavior.
As a result, today's Internet industry lacks any ability to evaluate trends, identify performance problems beyond the boundary of a single ISP, or prepare systemically for the growing expectations of its users. Historic or current data about traffic on the Internet infrastructure, maps depicting the structure and topology of this amorphous global entity, or projections about how it is evolving simply do not exist.
That is not to say that no measurement of the Internet occurs. There are numerous independent activities in the area of end-to-end measurement of the Internet. Typically spawned by end users with an interest in verifying performance of their Internet service, these measurements involve an end host sending active probe traffic out into the network and recording the delay until that packet returns to its source. Unfortunately such traffic measurements involve a large number of parameters that are difficult if not impossible to model independently, and the resulting complexity renders elusive any comparability or useful normalization of the gathered data. There are research groups trying to deploy technology and infrastructure to support more standardized measurement and evaluation of performance and reliability of selected Internet paths, and what specific segments of a given path limit that performance and reliability, but such efforts are slow and have thus far been unable to meet the needs of any of the user, research, or ISP communities.
Network measurements fall into two broad categories: Passive and active. Passive measurements depend entirely on the presence of appropriate traffic on the network under study, and have the significant advantage that they can be made without affecting the traffic carried by the network during the period of measurement. However, it can be much more difficult or impossible to extract some of the desired information from the available data.
Active measurements, on the other hand, directly probe network properties by generating the traffic needed to make the measurement. This allows much more direct methods of analysis, but also presents the problem that the measurement traffic can have a negative impact on the performance received by other kinds of traffic. This tension between measuring the performance of a network and actually using it to carry real traffic necessitates care in the design of any program of active measurements. In the remainder of this paper we will highlight activities and outstanding problems in the areas of passive and active measurements. We will conclude with a focus on near-term research priorities and forecast of activities for the next five years.
passive techniques: workload analysis
|
Everything you've learned in school as "obvious" becomes less and less
obvious as you begin to study the universe. For example, there are no solids in the universe. There's not even a suggestion of a solid. There are no absolute continuums. There are no surfaces. There are no straight lines. |
| -- R. Buckminster Fuller |
Workload measurements require collecting traffic information from a point within a network, e.g., data collected by a router or switch or by an independent device passively monitoring traffic as it traverses a network link. Network traffic is carried in discrete units called `packets', and they typically vary in size. As a result, measurements are quoted both `per packet' or `per byte'. Collection of this data allow for a variety of traffic analyses, e.g., composition of traffic by application, packet size distributions, packet inter-arrival times, performance, path lengths, that contribute to our ability to engineer next generation internetworking equipment and infrastructures. Of particular interest to network operators are traffic flow matrices: tables of how much traffic is flowing from a given source to a given destination network, information that turns out to be vital to optimizing engineering decisions that govern which other transit ISPs to exchange traffic with directly, and where to set up those interconnections.
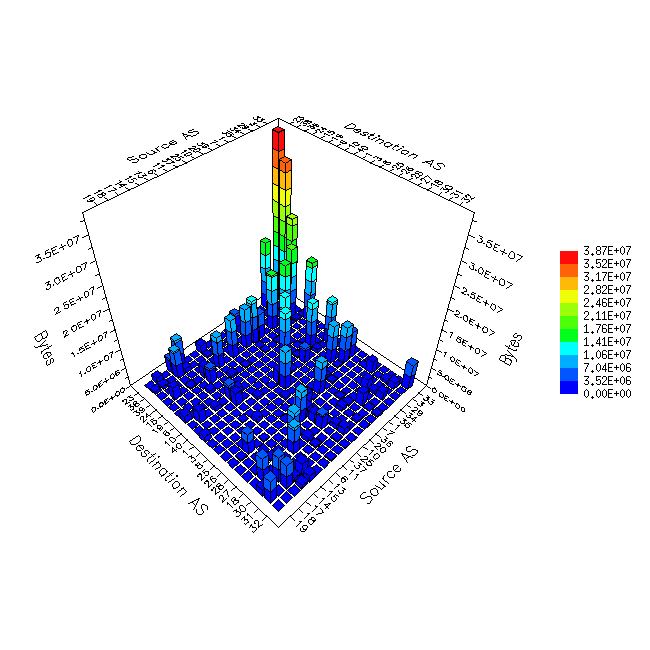
Figure 1 shows a sample matrix of traffic taken from a major backbone site. The units along the horizontal axes are `Autonomous Systems', the organizational units used in routing packets in the backbone. A single Autonomous System may contain many separate networks, but they are all part of a single administrative organization. Since an Autonomous System is the unit at which Internet routing relationships are established and negotiated, a traffic matrix at this granularity is of immediate utility to networking engineers trying to optimize topology or route peering decisions. Peering is the relationship between two autonomous systems that agree to exchange routing information with each other. A graph at this granularity can be used to determine the traffic balance among ISPs.
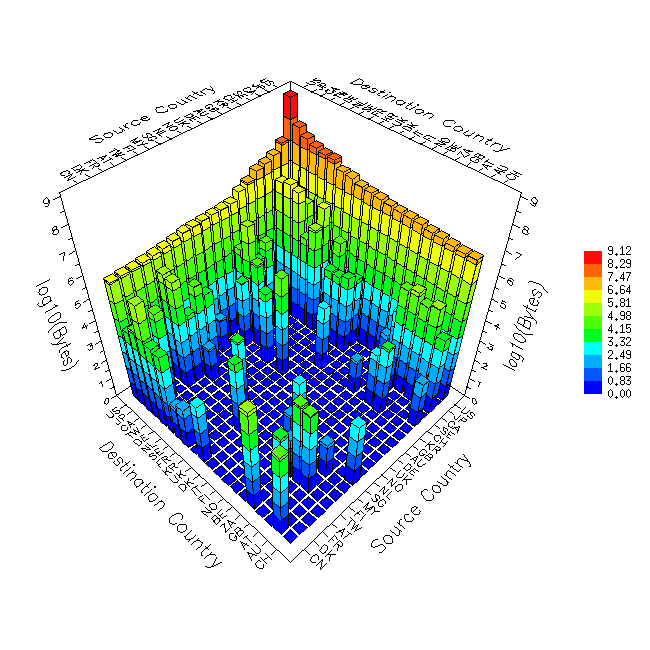
Other levels of granularity are interesting as well. For example, a network manager for a corporation or university might want to know which departments exchange the most traffic. Since the entire organization is most likely a single Autonomous System, a traffic matrix could be constructed with individual departmental or workgroup networks along the x and y axes. Figure 2 shows a traffic matrix by country, a level of granularity interesting from a public policy as well as an international commerce perspective. Reflecting a two-minute sample taken at a United States peering point location in 1998, this particular image indicates the use of the United States as an international communications hub, reflected in the presence of traffic from non-U.S. countries to other non-U.S. via the U.S. The log scale highlights that it is, however, still quite a small fraction of overall traffic, but it is a useful statistic to be able to track. Note the U.S. is almost universally a net exporter of IP traffic.
As another example of relevant workload characteristsics, we present sampled data on Internet packet sizes. Statistics of packet size distribution and arrival patterns are of relevance to designers of network routing and switching equipment since there are both per-packet and per-byte components of the cost of switching a packet, so having metrics for typical Internet workloads allows designers to optimize hardware and software architectures around relevant benchmarks.
figure 3: cumulative distribution of packet sizes,
and of bytes by the size of packets carrying them
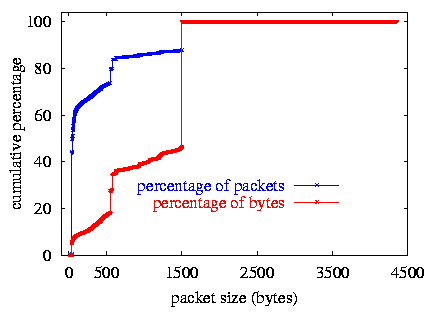
Figure 3 shows the cumulative distribution of packet sizes, and of bytes by the size of packets carrying them. This figure is a good example of the difference between per-packet and per-byte analyses. There is a predominance of small packets, with peaks at the common sizes of 44, 552, 576, and 1500 bytes. The small packets, 40-44 bytes in length, include TCP acknowledgment segments, TCP control segments such as SYN, FIN, and RST packets, and telnet packets carrying single characters (keystrokes of a telnet session). Many TCP implementations that do not implement Path MTU Discovery use either 512 or 536 bytes as the default Maximum Segment Size (MSS) for nonlocal IP destinations, yielding a 552-byte or 576-byte packet size [STEVENS]. A Maximum Transmission Unit (MTU) size of 1500 bytes is characteristic of Ethernet-attached hosts.
Almost 75% of the packets are smaller than the typical TCP MSS of 552 bytes. Nearly half of the packets are 40 to 44 bytes in length. Note however that in terms of bytes, the picture is much different. While almost 60% of packets are 44 bytes or less, constituting a total of 7% of the byte volume, over half of the bytes are carried in packets of size 1500 bytes or larger.
Another important workload analysis is the assessment of composition of traffic by protocol type, since some protocols are `friendlier', or more responsive to network signals of congestion, than others, and a strong growth in the proportion of such unfriendly protocol traffic would have unsalutary implications for the infrastructure. On the Internet, standard implementations of TCP (Transport Control Protocol) are friendly, while UDP (User Datagram Protocol) implementations are not. Fortunately for the stability of the infrastructure, TCP is the protocol that carries most popular applications known to users today: web pages (HTTP), e-mail (SMTP), and Usenet news (NNTP).
It is often useful to aggregate all packets that represent a single conversation between two endpoints into a single unit called a `flow'. The distribution of Internet traffic flow lengths, as measured in packets, is heavy-tailed. Our measurements indicate that the majority of flows have a very short duration, e.g., HTTP, SMTP, DNS, carrying much less traffic than the kind of bulk data transfer flows for which TCP has been optimized, e.g. FTP-data, and NNTP. Of particular concern is the effect of the increasing popularity of streaming and other multimedia applications that are much larger, often orders of magnitude, than even the historically `bulky' ones. The fairly limited resource accounting and pricing models currently in use along with several other fundamental aspects of the infrastructure make this significant shift in the distribution of flow sizes rather ominous for the stability of the current framework. Indeed, only more accurate resource consumption and concomitant pricing models will help providers grow their infrastructure to keep pace with demand. Changes in this direction would be auspicious for the industry anyway, since moving away from the flat-rate economic model that prevents rational valuation of the utility of Internet service will help maximize the value received by the end user.
We have only provided a few examples of the potential information available via passive monitoring tools. Other applications of passive monitoring include identifying, characterizing, and tracking of: the potential benefit and optimal configuration of web caches and proxies; security compromises to one's infrastructure; the elasticity of flows and effectiveness of congestion control algorithms; the extent to which traffic growth is due to additional users versus an increase in per-user traffic; changes in profile of popular protocols and applications; and penetration and impact of emerging technologies and protocols such as multicast or IPv6.
It is sometimes possible to extract other parameters that normally require active measurement techniques opportunistically from passively collected traffic. This is a very attractive prospect because any information we can obtain through passive techniques is `free' in the sense that we don't have to impose any extra load on the network under study. More work needs to be done in this area to better identify what can and can't be measured passively so that we can better exploit this valuable source of information.
active techniques: mapping the Internet ecosystem
| in an expanding system, such as a growing organism, freedom to change the pattern of performance is one of the intrinsic properties of the organism itself. |
| -- Unknown |
New connections among core Internet backbones occur hourly, ranging in capacity from T1 copper (1.55 megabits per second) to OC48 fiber optics (2.48 gigabits per second). This physical structure supports a myriad of new technologies and products, including live (or 'streaming') audio and video, distance education, entertainment, telephony and video-conferencing, as well as numerous new and often still evolving communications protocols.
Tracking and visualizing Internet topology in such an environment is challenging at best. A particularly ambitious endeavor is underway in our group at CAIDA through the recent development of skitter, a tool for dynamically discovering and depicting global Internet topology. The data collected by skitter is useful for more than just topological visualization, however, since the it also contains a lot of information about the performance of specific paths through the Internet.
skitter works using a process somewhat analogous to medical x-ray tomography, a technique where a three-dimensional image is achieved by rotating an x-ray emitter around the subject and measuring the intensity of transmitted rays from each angle, and then reconstructing the resulting two-dimensional images into a three-dimensional object. Geologists rely on similar techniques to build models of seismic activity using cross-section images (slices) of the earth. Data gathered from tomographic scans play an important role in developing models to analyze and predict select phenomena.
CAIDA is currently using skitter to gather infrastructure-wide (global) connectivity information (what's connected to what?), and round trip time (RTT) and path data (how does a packet get from A to B and how long does it take?) for more than 30,000 destination hosts from six source monitors spread throughout the United States, with additional monitors deployed in the U.S., Europe, and Asia in mid-1999.
skitter measures the Internet path to a destination by sending several ICMP echo request packets towards the destination host in a similar fashion to the common `ping' utility. However, skitter sends these packets with very low `time to live' (TTL) values. Every router in the Internet automatically decrements the TTL value of each forwarded packet as part of an overall scheme to prevent persistent traffic looping. If the TTL value reaches zero, The router will discard the packet and send an error notification back to the sender. skitter sends a series of probe packets from the measurement host with progressively larger TTL values, and as each error message is received the measurement host is able to determine the path taken through the network from the source to the destination. This is essentially the same procedure as used by the traceroute utility.
Probing paths from multiple sources to a large set of destinations throughout the current Internet address space allows both topological and geographical representations of a significant fraction of Internet connectivity, the latter admittedly constrained by the abysmal lack of geographic mapping data for Internet address space. Supporting tools also analyze the frequency and pattern of routing changes (when and how often are alternative paths used between the same two endpoints?)
Like any active measurement program, it is essential that skitter measurements impose only a minimal load on the infrastructure as it takes its measurements. skitter probe packets are very small, 52 bytes in length, and typically only probe destination hosts at approximately hourly intervals.
Analyzing data from tens of thousands of path measurements can identify critical roles that specific backbones, traffic exchange points, and even individual routers play in transmitting Internet traffic. Figure 4 shows a preliminary two-dimensional visualization of skitter data depicting a macroscopic snapshot of Internet connectivity, with selected backbone ISPs colored separately. The graph reflects 23,000 end destinations, through many more intermediate routers.
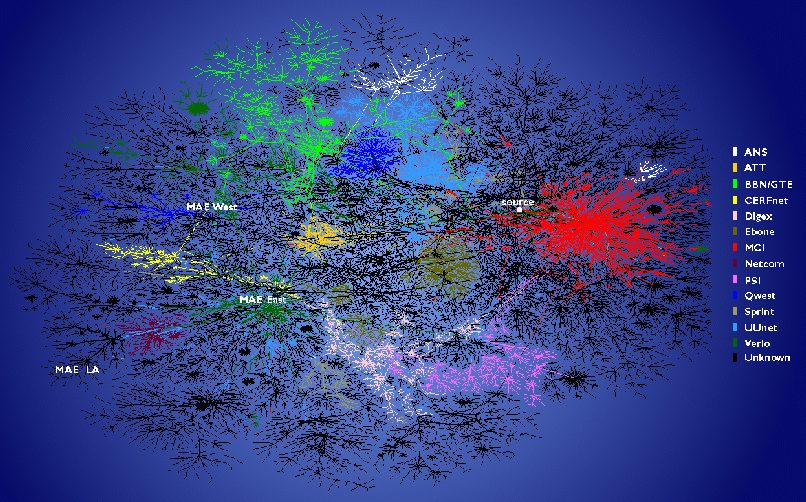 |
Figure 4: Prototype two-dimensional image depicting global connectivity among ISPs as viewed from skitter host. The layout algorithm used in these images was developed by Hal Burch (CMU) in support of Bill Cheswick's (Bell Labs) Internet Mapping Project (http://cheswick.com/ches/map/). |
In addition to collecting overall topological information, active measurement techniques can be used to probe the network for specific problem conditions. Figure 5 shows an example delay distribution, with the common heavy-tail characteristic of many Internet end-to-end delay distributions (where many points lie above the lower band of the majority of the data).
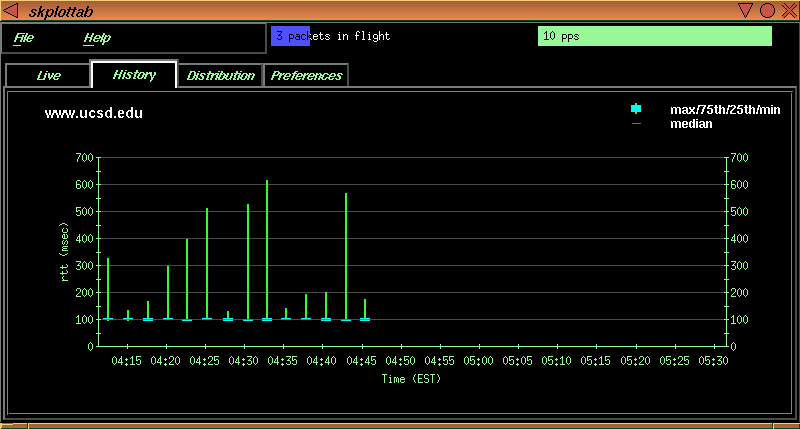
Data from these and other sites over time suggest that even under the best conditions a significant fraction of Internet traffic takes longer than expected to reach its destination. This characteristic produces a tendency for heavy-tailed distributions of round-trip times on the global Internet. Deviations from this nominal behavior are usually indicative of problems in the network.
The following graph shows a histogram of round trip times (RTTs) from the same measurement host to www.freebsd.org, a host in Northern California, during a workday hour in February 1998. In this example, most of the RTT data is well above the minimum RTT, the cumulative packet loss is around 10%, and the packets not dropped have a relatively wide distribution of RTTs. It seems likely that rather than a single standing queue (where packets are delayed waiting to be processed by some router on the path), this path is subject to one (or more) changing queues.
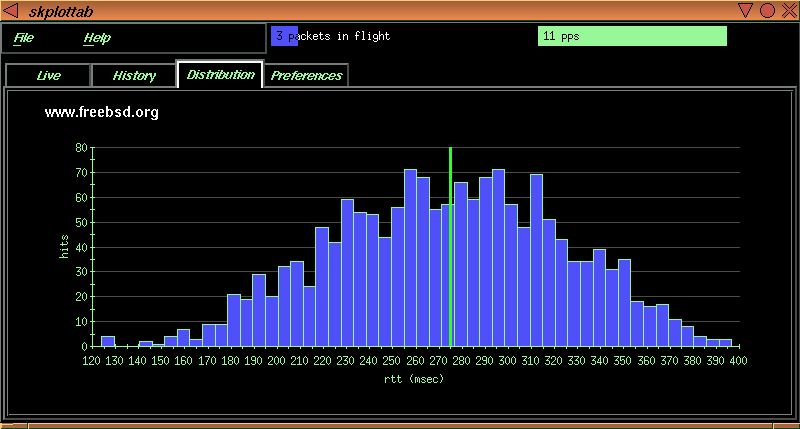 |
Figure 6: Histogram of RTTs for 1600 probes from lancelet.caida.org (in Ann Arbor, MI) to www.freebsd.org |
The robustness and reliability of the Internet are highly dependent on efficient, stable routing among provider networks. Analysis of real world Internet routing behavior has direct implications for the next generation of networking hardware, software and operational policies. Observations of macroscopic routing dynamics provide insights into:
- effects of outages on surrounding ISPs
- effects of topology changes on Internet performance
- unintended consequences of new routing policies
- potential areas for improving an individual networks' ability to respond to congestion and topology changes .
- infrastructural vulnerabilities created by dependencies on particularly critical paths
One important area of needed work is the comparison of actual behaviour of routed traffic with with those routing policies articulated by the inter-domain routing protocol BGP (Border Gateway Protocol). This is the protocol used to exchange routing information, and it is the primary mechanism for implementing traffic exchange policies among ISPs. Comparing the ambient BGP view of the network with actual traffic routes requires a source of core Internet routing (BGP) data close to the source of the active measurements; tools for acquiring this data with high precision are still a research as well as political challenge, as many ISPs are hesitant to make this kind of information publically available.
Other areas of analysis with strong technical and policy implications: assessing the effectiveness of utilization of the IP address space; extent of asymmetric routing and route instability as a function of service provider and over time; the distribution of traffic by network address prefix lengths; efficiency of usage of BGP routing table space, e.g., via aggregation; favoritism of traffic flow and routing toward a small proportion of the possible addresses/entities; degree of incongruity between unicast and multicast routing; and quantifying effects on connectivity of removal of specific ASes.
emerging tools
Performance measurement techniques are often used by network engineers in diagnosing network problems; however, most recently their application has been by network users or researchers in analyzing traffic behavior across specific paths or the performance associated with individual Internet Service Providers (ISPs). A recent development in the industry is the offering of service level agreements (SLAs), contracts to guarantee a specified level of service, subject to cost rebates or other consumer remuneration should measurements suggest that the ISP did not adhere to the SLA. SLA's are rather controversial in the community since there is no standard metric or even measurement methodology for calibrating them. CAIDA will focus on tools and techniques for more generic active measurement rather than the typically proprietary tools currently used to monitor SLAs.
CAIDA is among the groups producing tools that utilize active measurement techniques to help visualize network problems, several of which were illustrated in the previous section. There are many other active performance measurements efforts undertaken by various players in the Internet community, the most popular of which are typically user-instigated `Internet weather reports', a selection of which are described in Nancy Bachman's https://www.caida.org/analysis/ page. The most important deliverables of most current active monitoring tools focus on either verifying bandwidth or performance stated or implied by vendors and providers, or ascertaining those parameters if the information is not available in the first place. But there are an enormous number of research questions not under concerted investigation at the moment due to the lack of adequate active tools for doing so. Identifying and locating what might be construed as particularly topologically critical pieces of the public infrastructure is one area that the developers of the skitter platform hope to accomplish. Others include: finding particular periodic cycles or frequency components in performance data; developing a calculus for describing and drawing the difference between two given `snapshots' of network performance; finding the topological `center' of the net, techniques for real-time visualization of routing dynamics; and correlation with passive measurements.
near-term priorities
| Science is not about control. It is about cultivating a perpetual sense of wonder in the face of something that forever grows one step richer and subtler than our latest theory about it. It is about reverence, not mastery." |
| -- Richard Powers from the Gold Bug Variations |
Each measurement effort provides a new window on the infrastructure for network operators, designers and researchers. But without well-considered, strategically deployed, and collaboratively maintained measurement tools/infrastructure, these windows are not necessarily offering any useful insight. A particular obstacle is the lack of reasonable knowledge base for mapping IP addresses to more useful analysis entities: autonomous systems (BGP routing granularity), countries, router equipment (multiple IP addresses map to same router but without any mechanism for deriving the mapping), geographic location information (latitude/longitude coordinates). There are efforts underway to develop prototype databases for canonical mappings; https://www.caida.org/outreach/info/ lists some of them, but their precision, completeness, and concomitant utility will require more concerted community participation.
Indeed, progress in this field requires both top-down and bottom-up pursuit: application developers must scope out what measurements would allow their software to negotiate performance constraints with the network, and Internet service providers need to participate in deploying and evaluating the utility of measurement technology for their own network design, operation, and cost recovery.
The network research community is in a difficult position between these two groups, hoping to design a framework for windows that are useful. For several years the infrastructure was in such a measurement-deprived state that even deploying any data collection tool at all qualified as ground-breaking work. The current state is quite different: there is plenty of measurement occurring, albeit of questionable quality. The current community imperative is rather for more thoughtful infrastructure-relevant analysis of the data that is collected, in particular correlating among data sources/types, and providing feedback into tool design to improve future data acquisition techniques. Unlike many other fields of engineering, Internet data analysis is no longer justifiable as an isolated activity. The ecosystem under study has grown too large, and is under the auspices of too many independent, uncoordinated entities. Nonetheless, the system is evolving rapidly, and prudence would dictate that the depth and breadth of our understanding of it follow in much closer pursuit.
References
Acknowledgments.
Thanks to Daniel McRobb for help with the sections
on performance and routing, and to Nancy Bachman
for helpful editing comments.
Many thanks to Bill Cheswick and Hal Burch
(Lucent/Bell Laboratories) for providing the graph layout code for
Figure 1. For more information see http://cheswick.com/ches/map/