

Otter Network Viz Tool
Otter: A general-purpose network visualization tool
Bradley Huffaker, Evi Nemeth, k claffy{ bhuffake,evi,kc}@caida.org
CAIDA: Cooperative Association for Internet Data Analysis
(Note this paper uses a lot of color images for explanation and examples. Color printout strongly recommended. home URL: https://catalog.caida.org/paper/1999_otter/) copyright ISOC Inet 99.
Abstract
Otter is a new CAIDA tool for visualizing arbitrary network data that can be expressed as a set of nodes, links or paths. We developed Otter to handle visualization tasks for a wide variety of Internet data we deal with in our research, including data sets on topology, workload, performance, and routing. We have used Otter to visualize: multicast and unicast topology databases, core BGP routing tables, reachability and delay measurements, SNMP data, and web site directory structures. Otter's strength is in its data independence: it can handle any formatted data set consisting of links and nodes.Otter achieves its versatility in what data it can process by using a data format specification prepended to each input file. This specification stipulates attributes of each object in the data file, which Otter uses to tailor its visualizations and even adapt its user interface to a specific data domain. We describe and provide examples of Otter's visualization features, how it achieves data independence, present case studies of Otter's utility in practice, and outline possible future directions for Otter.
Background: a history of caida's customized viz tools
In mid-1997 CAIDA began to develop visualization tools for various large data sets of network topology information. The first of these tools, Mapnet [CH97], supports geographic display of backbone infrastructures of multiple U.S. IP service providers (ISPs). Mapnet was the first public tool with the ability to view multiple IP backbone topologies simultaneously, and uses Java to implement real-time interaction so the user can identify specific endpoints, link bandwidths, and peering information by passing over nodes or links with the mouse. Mapnet required the development and maintenance of a database of latitude/longitude information to geographically position known IP backbone nodes on a world map display.The next data set we sought to visualize was the topology and configuration of the Internet multicast backbone (MBONE). Building on our experience with Mapnet, and reusing some of the code base, we developed MantaRay [HCN98a], which takes as an input file a pre-existing database of IP multicast topology [Brooks97]. To verify irregularities in the original data set we used to develop and test MantaRay, we developed a tool for scanning through subcomponents of the public multicast topology [Huffaker98a]. Manta has proven useful in identifying suboptimally configured pieces of the topology and tracking the extent of the public infrastructure's transition from the MBONE to native multicast. MantaRay uses a geographically-based placement algorithm, which presents a significant and frustrating limitation in practice since it is often difficult if not impossible to derive geographic position information for given IP addresses. Our still quite incomplete database of mappings from IP addresses to latitude/longitude coordinates constrains the amount of MBONE topology that MantaRay can accurately display geographically. We are still working to expand this database, hopeful for future community support for the DNS-LOC registration procedure outlined in RFC1876 [RFC1876]. We would also like to see MantaRay integrated with real-time performance information from other Mbone monitoring tools, e.g., mhealth [MA98].
Albeit limited, MantaRay's success inspired an attempt to visualize a slightly smaller logical topology: NLANR's IRCACHE web caching hierarchy [Wessels96]. By 1998, the IRCACHE hierarchy consisted of approximately 1200 caches distributed across the globe, interconnected via manually configured cache peering sessions. The resulting virtual infrastructure is essentially a large scale tunnel-based logical network lying atop the public IP infrastructure. The same potential inefficiencies that arise with any tunnel-based overlay topology characterize both the MBONE and the caching hierarchy: the tunnel topology inevitably tends to diverge from the underlying IP unicast infrastructure, sometimes dramatically so. In many cases, this divergence occurs because administrators of potential tunnel endpoints do not have sufficient access, understanding, or inclination to pursue tunnels that are congruent with underlying topology. In other cases the underlying unicast infrastructure may change without the administrator's awareness or ability to reconfigure. Although several ISPs and MBONE community supporters have invested significant efforts in rationalizing the tunnel topology, the inherent nature of the technology and user community limits the potential for full-scale repair.
With NLANR's IRCACHE caching topology, we had greater hopes for optimization. Because many of the cache peering sessions (analogous to `tunnels') are under control by a still fairly small, tight, cooperative community, we anticipated reasonable success with rationalizing the topology if we could only pinpoint places of divergence. Because most of the caches are outside the United States, where there is less redundancy in infrastructure, we decided to begin by visualizing the difference between geographical and topological depictions of the hierarchy. While relying on geography to guide one's assumptions of underlying unicast topology is often a losing proposition, particularly in redundancy-rich portions of the Internet (e.g., the United States), it is a legitimate place to start for calibration of international infrastructure.
To assess the divergence of the logical cache mesh topology from the underlying physical topology, we developed Plankton [HCN98b]. Leveraging experience with Manta [HCN98a], Plankton is another Java application that supports interactive customization of views of the caching hierarchy. Plankton can color links and nodes of the topology according to attributes such as volume of HTTP requests exchanged between caches, or color by the top level domain names of those caches querying NLANR's IRCACHE root cache system. More importantly, Plankton supports a mode where one can display side-by-side geographical and topological representation of the hierarchy, and simultaneously highlight corresponding links in each view. This feature allowed us to quickly identify pieces of the cache hierarchy that diverged from the underlying geographical structure.
We have described this series of tools to illustrate our process of developing a custom tool for each data set. Although we were able to reuse some code, we spent a lot of time adding features to highlight attributes of new data sets that were semantically different from those in previous data sets. But as we added new functionality to one tool, it was almost immediately requested for the others, which proved problematic since the code bases were too different to easily integrate pieces.
Further, the `todo' list of new data sets to visualize was growing: Internet core routing tables, SNMP data, active topology discovery, even web site directory structure. Each data set has different characteristics that require special handling. In pursuit of convergence across our own efforts, we designed a general-purpose tool that could display all of these network-related data sets, and more importantly, could handle new and unfamiliar data sets. The resulting tool, largely developed from the Plankton code base, is named Otter [Huffaker98b].
Otter: design goals
Our design of Otter is based on four expected usage characteristics:
- object types to visualize are: node, link, or path;
- large data sets, which result in large graphs, require efficient memory usage;
- users want both geographical placement and topological placement;
- users want to be able to modify the display: zoom, focus, manually tweak the graph layout
- each data set may have a different number of attributes, or particular characteristics of the data of visualization interest;
- attributes may be of different types;
- nodes, links, and paths, and attributes may have fundamentally different semantics across data sets;
- some graph layout algorithms may not make sense for some data sets
Visualization features
In this section we describe and provide examples of some of Otter's display features, including: placement algorithms, customizing view, coloring by data attribute, and step-by-step display of frames.Graph layout algorithms
Some initial automatic placement (graph layout) of nodes in the viewing window is necessary due to the number of nodes in typical data sets. Graph layout involves two phases: positioning the subset of root nodes and subsequent positioning of other nodes relative to these root nodes. The concept of root nodes was inspired by its utility in the earlier Plankton tool, where we wanted to render central positioning to a specific subset of the nodes, i.e., the NLANR root caches.Otter has two options for root node placement: circular and coordinate-based. Circular layout, where Otter places nodes along the circumference of a circle, is the default, since we assume low probability of having node latitude/longitude information required for geographic layout.
For coordinate-based placement, Otter uses coordinate information provided in the input file, which can be either geographical (latitude/longitude), partially geographical (latitude/longitude for some subset of the nodes in the file), or regular Cartesian (X,Y) coordinates. The ability to use pre-computed coordinates for the layout has been critical to manipulating data sets too large to compute layout while using Otter interactively. Even with the (X,Y)-coordinate data computed in advance, on slower machines Otter can require several minutes to draw large (tens of thousands of nodes) topologies.
If there is only partial geographic information, Otter uses what we call quasi-geographical placement. In this graph layout method, Otter finds the maximum and minimum available latitude and longitude coordinates of the complete set of root nodes in the data file. These values determine the four corners of a rectangle, which Otter then scales to occupy half the viewing area. The upper left corner represents the highest latitude and longitude values; the lower right corner the lowest values. Otter then places the root nodes within the rectangle in their corresponding quasi-geographical location. Root nodes that do not have registered latitude/longitude information are placed according to the algorithm used for non-root nodes, described in the next paragraph. Note that quasi-geographical placement in highly networked metropolitan areas can cause clusters of nodes to overlap. For viewability, Otter separates clusters so that nodes are at least the length of their diameter from each other.
After placing the roots, Otter places non-root nodes without geographic coordinate information in semi-circles around their parent node using a breadth-first scan from the roots and guided by the following heuristics:
- the more children a node has, the further away those children should be so that they will not overlap
- children that themselves have lots of children should be even further away so that the grandchildren do not overlap
| Figure 1: quasi-geographical layout | Figure 2: circular layout |
|---|---|
 |
 |
Customizing the display
In this section we describe Otter's support for interactive customization of the display: manually tuning the graph layout, changing the status of root nodes (i.e., turning non-root nodes into roots and vice versa), moving nodes or sub-trees around, and focusing on a specific region of the graph.Manually tuning node placement
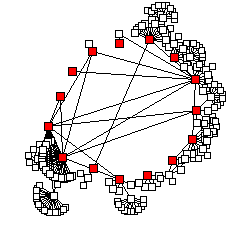
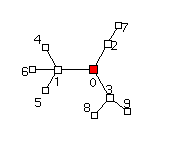
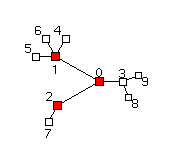
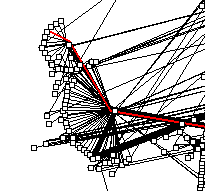
Otter's current placement algorithms may result in objects overlapping or landing in awkward locations on the display. Otter supports interactive tuning of placement of single or groups of nodes to better suit the current data set. Figures 3 and 4 below show an example of before and after manual tuning of a graph layout of the multicast topology within three hops from SDSC's network.
| Figure 3: Before manual placement | Figure 4: After manual placement |
|---|---|
 |
 |
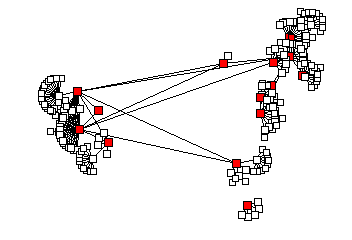
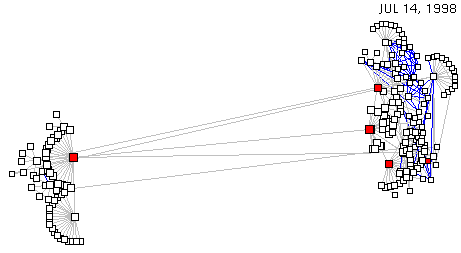
Changing root nodes interactively
Root nodes are typically specified in the raw input file, but Otter supports changing this default selection and redrawing the graph centered around interactively specified roots. Figures 5 and 6 illustrate a network before and after a change and re-drawing of the display around the new root nodes. It is also possible to select an arbitrary node to be the center (i.e., single root) of the current display, effectively letting you drive around the viewing area and focus on a particular section.| Figure 5: Root node: 0 | Figure 6: Root nodes: 0, 1, and 2 |
|---|---|
 |
 |
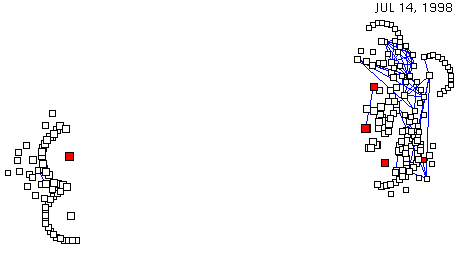
Zooming
The zoom option allows the user to select an arbitrary scale at which to view the network graph. The user can expand the network to provide more detailed analysis of a particular area or step back to fit the complete network on the screen. Figures 7 and 8 illustrate Otter's zoom capabilities on a segment of a CERFnet BGP routing table from July 1998.
| Figure 7: Otter zoomed in (data set: CERFnet routing table from July 1998) |
Figure 8: Otter zoomed out (data set: CERFnet routing table from July 1998) |
|---|---|
 |
 |
Coloring graph by data attributes
Otter supports three mechanisms for coloring a network based on attributes of the data objects (links, nodes, and paths): spectrum coloring, binary coloring, and masking. Graph objects with no value for a particular attribute are shown with their default object color: white squares with black outline (node objects), black lines (link objects), or complete sequences of black lines (end-to-end path objects).Spectrum coloring
Spectrum coloring assigns a color to each unique value in the range for a given attribute, and includes a color key on the left side of the display window. When using Otter, we found it hard to distinguish more than approximately 10-15 colors in graphs, which makes it harder to visualize complex attributes with many unique values. Otter deals with this limitation in different ways for string and float attribute types. For string attributes, to prevent the legend from overlapping the graph, Otter does not display a color key when more than a certain number (30 by default) of distinct values are needed. For float attributes with more than 15 distinct values, Otter segments the range of values into buckets and spreads the spectrum across these aggregating buckets rather than each individual value.Binary coloring and masking
When the user selects either binary coloring or masking, Otter brings up a new window in which to enter a Boolean expression that filters values for a particular object/attribute pair. Boolean coloring draws objects (nodes, links, or paths) blue if they match the Boolean expression, and grey otherwise. Masking is a special case of binary coloring, where the non-matching objects are invisible, i.e., Otter does not draw them at all. For floating point values, the Boolean expression can include the standard comparison operators: >, <, >=, etc. Expressions describing string attributes use the contains-the-substring operator, useful for limiting the display to (sub)domains (e.g., "khanda.caida.org" contains-the-substring "caida.org").Figure 9 below shows the same BBNPlanet multicast topology example shown earlier, using a Boolean expression to specify links whose endpoints share the same /24 IP network address prefix. Links connecting nodes in the same /24 prefix are colored blue, the rest are grey. Figure 10 is the same image using masking to hide non-matching links entirely.
The key to Otter's flexibility with respect to input data
is its use of a customized data structure definition
that specifies various attributes of a given data set.
Researchers and engineers will often have raw data sets
previously collected with some external tool.
We have in several cases developed custom Perl scripts to
parse such data sets
into Otter-compatible input format. This script
also includes documentation of the raw structure in the data file,
and any assumptions made about object attributes in the conversion.
For this conversion,
we take some of the attribute values directly from
the raw input data; for example, the version number on
the third line of the data specification
comes from the second line of the raw crawl-generated data.
Other fields are derivative
and require traversing the entire raw input file.
An example is the `threshold symmetry' attribute:
mrinfo [MRIN] reports only unidirectional
information on tunnels, so the conversion script must
retain state to compare (in this case the threshold
attribute for) both directions of each tunnel to
see if they match.
String values listed on g lines specify
the title of an attribute group, which Otter uses to
customize labels of pop-up menu items in its user interface,
e.g., Node attributes, Tunnel Attributes.
Strings on the f lines are field names for
defined attributes, and appear in secondary menus in Otter.
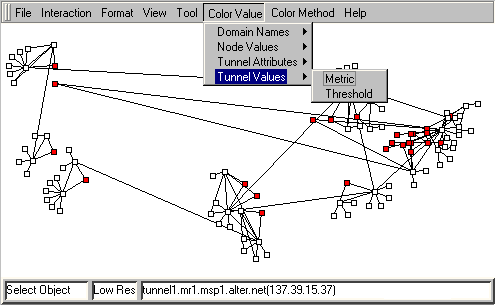
For example, Figure 11 shows the main display window
of Otter when used with this data set:
Otter's `Color-by' pull-down menu offers `Tunnel Values'
as a top level choice, which when selected offers a
sub-menu of which tunnel values to color by: metric or
threshold.
Lines beginning with v or V are values,
v for nodes and V for links.
Lines beginning with n or N are
node names; N nodes have latitude
and longitude values as well as names.
Otter input data is currently stored in tabular form with all
variables mapped to strings or floats,
even if the raw data also contains integers,
Booleans, or characters. Although not
optimal in memory usage, since it requires
allocating double precision floating points
for each value, the benefit of only having to support operations
on two primitive types has greatly simplified
implementation at little cost in performance.
The following table shows the mapping of data types to
Otter-compatible types.
However, when we attempted to use Otter to visualize
a BGP routing table from Route Views, we found the existing
set of Otter objects, which then consisted of only
nodes and links, insufficient to describe the routing table.
Although explaining the deficiency requires some
understanding of non-trivial aspects of the Internet
routing system,
we will take time to describe this limitation in detail
since the changes we made to Otter in order
to accommodate this data set have opened Otter up to a
fundamentally different and interesting class of
Internet visualization.
A BGP routing table holds routing information
in the form of AS paths, or a sequence of
autonomous systems (ISPs) transited from the source
to destination node.
(Although it is an oversimplified definition,
it will suffice for this discussion to think of an
`Autonomous System' (AS) as roughly a single administratively
independent Internet service provider.)
A link between two ASes exists
if those two ASes have established a peering session
between them,
the mechanism via which they announce to eachother
a list of routes to which they can carry traffic.
Initially, we split AS path information into
node pairs (2 nodes + 1 link) to display each AS adjacency.
But we soon recognized the near irrelevance
of displaying individual AS adjacencies,
since in a global Internet routing context
(our domain of interest), they have no meaning
without regard for the semantics of the
corresponding peering sessions.
Indeed, depicting pure AS connectivity on a per-hop basis is
misleading, since each link represents only a valid
connection for the specific set of routes announced from
one AS to the other, and only in one direction.
Peering is not semantically symmetric nor
an automatically transitive relationship.
It is thus of questionable utility to
visualize any one given link between ASes without incorporating
the information on the routes exchanged across the
session represented by that link. Because routing policy might
allow ASes to pass subsets of routes they receive on to
other neighboring ASes, any legitimate visualization must
incorporate an
entire end-to-end route-ful AS path as the atomic
`unit' of visualization,
rather than an individual link between two given ASes.
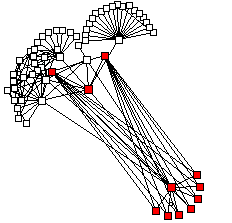
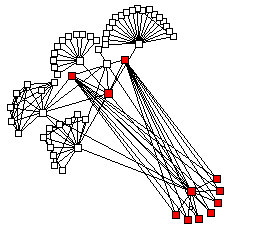
Specifically, we need to display each AS path
as an ordered, directed, route-ful set of individual AS
adjacencies. We added a new type of object,
an entire path, to the data file format,
which allows more accurate representation
of BGP data. Figures 12 and 13 illustrate the
difference: figure 12 shows Otter drawing just adjacencies,
while figure 13 has Otter drawing complete paths atomically.
In the interactive Java applet, resting the mouse on a single
link in figure 13 highlights the entire path of which
that link is a part.
We tried to integrate a more sophisticated automatic
graph layout algorithm with improved node
placement for networks of this size.
Unfortunately, all the algorithms we examined
were insufficient to display such large networks
interactively. Our solution was to support
precomputation of the graph layout, leaving
an input file of (X,Y) layout coordinates
so that Otter could place nodes directly
without the CPU-intensive graph layout.
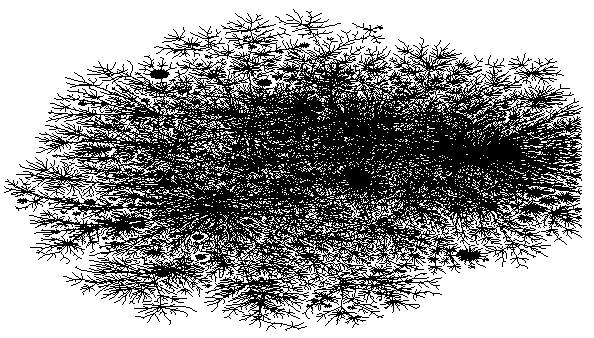
Figure 15 reflects Otter's use of such a technique, with a
graph layout algorithm implemented by Hal Burch, a
graduate student at Carnegie Mellon University, during
a summer internship at Lucent/Bell Laboratories [Ches99].
The placement took 24 hours to pre-compute
and about a minute for Otter to draw the
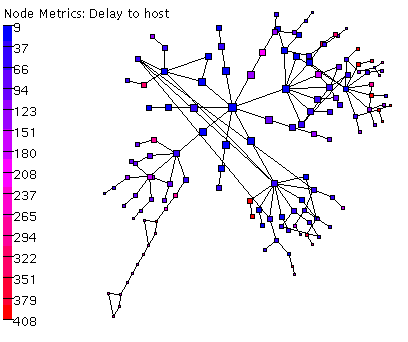
approximately 35,000 nodes.
Figure 16 below shows an
Otter visualization of some of this delay data.
Note that although the server on the lower left
has a .nz address, it is in fact physically
located in the United States, a fact strongly
suggested by the visualization and likely
not as quickly noticed from the huge text file of traceroute data.
The Otter graph in fact even revealed some topology
of which the users were not previously aware.
Note that the layout critically depends
on the chosen measurement point, since
the source serves as the defafult center
of the graph (`root' node).
And of course, the more traceroutes one displays, the
more unwieldy the graph becomes; we found that
trying to show more than 30 paths reduced the
utility of the Otter visualization considerably.
Delay variations might be better illustrated
with a wider spectrum of colors, which we are currently
investigating, but using more colors in the spectrum
can result in ordering that seems
more arbitrary than intuitively clear.
Ultimately, even allowing the user to specify data structures
does not obviate the need for any further tweaks to the tool.
Each data set has a unique focus, potentially unwieldy size,
or special graph structure not necessarily anticipated by
Otter's basic set of display attributes and placement algorithms.
Most new data sets we have encountered so far have
required small additions to the Otter code
to support more meaningful visualizations, but these
additions typically prove useful for older data sets as well.
Thus each new data set inspires new features and
testing in a continuous evolution of Otter's code base.
As always, thanks to Nancy Bachman for her
incredibly helpful comments and edits.
Incremental graph display
Otter's also supports a `step-by-step' function
that allows the user to draw the graph incrementally
from the root nodes out toward the leaves
of the topology one `level' at a time.
With each step, Otter draws all nodes that are
one node away from nodes already drawn.
This function applies only in the circular or
quasi-geographical placement algorithms. For networks
where the root nodes have special meaning, this mode
provides insight into the hierarchical structure
of the topology.
Data independence
Otter-compatible format: example
As an example of conversion of such raw, previously
collected data set to an Otter-compatible format,
we focus on the script we used to convert
our multicast crawl output into
Otter-friendly form.
crawl is a tool we built to collect
topology and configuration data on the
public Internet multicast infrastructure.
A segment of a sample crawl run returns
the following:
d 1998 8 29
: mbone.sdsc.edu(198.17.46.39) version 3.255,prune,genid,mtrace
> mbone.sdsc.edu(198.17.46.39) cs-f-vbns.sdsc.edu(198.17.46.43) [1/1]
> mbone.sdsc.edu(198.17.46.39) bigmama.sdsc.edu(198.17.46.205) [1/1]
> mbone.sdsc.edu(198.17.46.39) medusa.sdsc.edu(198.17.46.10) [1/1]
The first line of this file segment is the date.
The second line lists attributes of one of the
nodes in the network, in this case, the host mbone.sdsc.edu.
Each other line represents a link from mbone.sdsc.edu
to another multicast host.
The conversion perl script processes this data into the
Otter-compatible format below:
d 1998 8 29
g 0 d 1 Node Values
f 0 version
g 1 s 1 Node Attributes
f 1 Parameters
g 2 d 2 Tunnel Values
f 2 Metric'Threshold
g 3 s 6 Tunnel Attributes
f 3 Type (DVMRP,PIM)'Status (Down,Unidirection,Native,Tunnel)'Type of Network'Metric'Threshold Symmetry'Threshold Groups
N 0 32.847222222222 -117.2733333333 bigmama.sdsc.edu(198.17.46.205)
N 1 32.71527 -117.15638 cs-f-vbns.sdsc.edu(198.17.46.43)
N 2 32.847222222222 -117.2733333333 mbone.sdsc.edu(198.17.46.39)
v 2 0 3.255
v 2 1 prune,genid,mtrace
N 3 32.715278 -117.156389 medusa.sdsc.edu(198.17.46.10)
L 0 2 1
V 0 2 1'1
V 0 3 DVMRP'native'DVMRP-native-/24' one 'asymmetric'000 - 001
L 1 2 0
V 1 2 1'1
V 1 3 DVMRP'native'DVMRP-native-/24' one 'asymmetric'000 - 001
L 2 2 3
V 2 2 1'1
V 2 3 DVMRP'native'DVMRP-native-/24' one 'asymmetric'000 - 001
The first column of each line in any
Otter input file is a
single character tag that specifies
what type of entry that line contains.
Appendix A includes a complete listing of available tags
for Otter input files.
data type otter storage
int float
float float
Boolean string {"True", "False"}
character string
strings string Otter in practice
In practice, Otter has gone a long way toward achieving our original
goal: a general-purpose, data-independent network visualization
tool. But with each new data set we tried, we often still found it
necessary to add new options or features to fully express the new
data. These new features then become available to other visualizations,
although they are not always applicable. We have successfully
separated the two phases of understanding and formatting the raw
data and then visualizing it. Although our Perl conversion scripts
can be complicated, additions to the actual visualization code are
minimal. The time for us to visualize a previously unseen type of
data set has gone from months to days. In the following sections
we describe selected case studies including lessons learned in
using Otter in new data domains.
Case study 1: BGP visualization requires new primitive object
One of the most intriguing sources of Internet data
today is core Border Gateway Protocol (BGP)
routing tables from backbone transit providers.
The University of Oregon's Route Views project [Meyer97]
provides information about the global routing system
from several backbone perspectives around the Internet.
While initially intended to help operators
assess how the global routing system views their
address prefixes and/or Autonomous System (AS) space,
many researchers have found it a rich source
for routing analysis visualizations, e.g., of AS adjacency
graphs and global Internet address occupancy [HWB97].
One of our research goals is to develop methodologies
and tools to graphically visualize the semantic difference
between two core BGP routing tables.
Figure 12: BGP AS path data, reflecting only adjacencies
(piece of CERFNET routing table from May 1998)
Figure 13: BGP AS path data, reflecting complete paths
(piece of CERFNET routing table from May 1998)
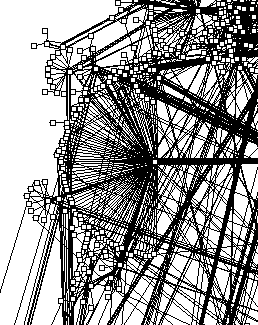
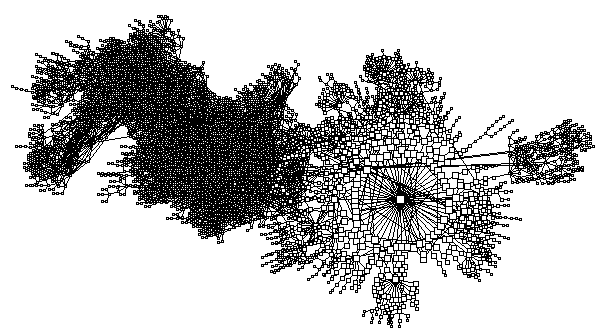
Case study 2: Otter graph size limitations
While Otter's original specification could handle
data sets with around 200-700 nodes,
several of our tasks, including the routing tables
described above, involve tens of thousands of nodes.
Figure 14 illustrates an early and not overwhelmingly
successful attempt to view a data set of this size,
specifically derived from running
Skitter.
CAIDA's macroscopic Internet topology discovery and
tracking tool. (See companion paper in this proceedings [McRobb98].)
Otter's default placement algorithm is unable to provide
a meaningful visualization; many nodes end up clumped
together obscuring the view.
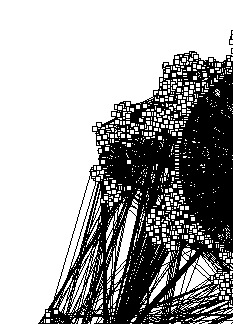
Fortunately, Otter supports minimizing the node size to zero,
i.e, just drawing links, a technique we use in
figure 15 to reduce clutter for
another large graph layout (using a different placement algorithm).
Case study 3: Third party usability testing
We have also tested Otter's usability to outside researchers
who were unfamiliar with the tool but needing something to
display a network-related data set.
We provided source code to Stephen Donnelly and Stele Martin
from the University of Waikato in New Zealand, for use in
their delay/topology measurement project.
Their ping and traceroute data [WAND98]
support short-term performance analysis as well as
longer term trending and routing analysis.
It took them a few days to get Otter installed,
understand how it worked, and create the Otter input file.
Ultimately, the perl conversion scripts they wrote created
Otter-compatible input files from raw traceroute output.
Conclusions
Otter is a visualization tool for network data
that can handle a variety of data sets as input,
while maintaining backward compatibility with
existing data sets.
We achieved these design goals by building a
pre-processing framework, typically implemented as a perl script,
to convert an arbitrary input data file into
a Otter-compatible format, including data structures
that specify attributes for Otter to visualize.
Isolating all of the customization in this format
conversion script allows the rest of Otter to
be sufficiently general to be able to handle many
different types of data sets.
Future Directions
While we have implemented many additions to Otter to view
new data sets, there are a few major display features
that we still hope to implement.
Currently Otter displays only one file at a time, each
associated with a single date. We would like to
add two capabilities: animating a time-series of values
from a single aggregated input file, and displaying real-time
data from live network monitoring sources.
Eventually Otter could even serve as a reasonable
front end for simulation tasks.
However, including more sophisticated temporal support
will require that objects carry more than a single value
per attribute, i.e., values over time stored in the same input file.
This change will constitute a significant modification to Otter's
core code base, but will be essential to Otter's continued utility
to Internet operations visualization research.
We will be pursuing these enhancements during the next year.
At the same time we will seek strategic sources of
real-time data on wide-area network performance
and workload behavior for which Otter visualization
can provide insight.
Acknowledgments
We would like to thank Bill Cheswick of Lucent/Bell Laboratories
and Hal Burch of Carnegie Mellon University
(on 1998 summer internship with Bill at Bell Labs)
who provided us with the graph layout code
from which we rendered figure 15.
References
[Brooks97]
P. Brooks, "MICE mrwatch/mrinfo tool",
http://www.cl.cam.ac.uk/mbone
[Ches99]
B. Cheswick and H. Burch, "Internet Mapping Project",
http://www.cs.bell-labs.com/~ches/map/index.html
[CH97]
K. Claffy, B. Huffaker,
"Macroscopic Internet visualization and measurement",
https://www.caida.org/catalog/software/mapnet/summary
[HCN98a]
B. Huffaker, K. Claffy, E. Nemeth
"Tools to Visualize the Internet multicast backbone",
https://catalog.caida.org/paper/1999_manta/
[HCN98b]
B. Huffaker, J. Jung, E. Nemeth, D. Wessels, K. Claffy,
"Visualization of the growth and topology of the NLANR caching
hierarchy",
https://www.caida.org/catalog/software/plankton/paper/plankton.html
[Huffaker98a]
B. Huffaker,
"crawl, an Mbone topology discovery tool to support MantaRay",
https://www.caida.org/tools/visualization/manta/source/
[Huffaker98b]
B. Huffaker,
"Otter: A general-purpose network visualization tool",
https://www.caida.org/catalog/software/otter/
[HWB97]
H.-W. Braun,
"Autonomous system based visualizations of BGP routing tables",
http://moat.nlanr.net/AS/
[MA98]
D. Makofske and K. Almeroth,
"MHealth -- Real-time multicast tree health monitoring tool",
http://imj.ucsb.edu/mhealth/
[McRobb98]
D. McRobb, T. Monk and k claffy,
"Skitter: CAIDA's macroscopic Internet topology discovery and
tracking tool", Proceedings of INET'99.
https://www.caida.org/catalog/software/skitter/
[Meyer97]
D. Meyer,
University of Oregon Route Views project,
http://www.antc.uoregon.edu/route-views/
[MRIN]
V. Jacobson, mrinfo,
http://www.cl.cam.ac.uk/mbone/#Mrouted
[MRIN]
C. Davis, P. Vixie, T. Goodwin & I. Dickinson,
"RFC 1876: A Means for Expressing Location Information in
the Domain Name System", January 1996,
http://www.ietf.org/rfc/rfc1876.txt
[WAND98]
University of Waikato's Wide Area Network Delay
(WAND) measurement project,
http://atm.cs.waikato.ac.nz/wand/
[Wessels96]
D. Wessels,
"NLANR's web caching hierarchy",
http://ircache.nlanr.net/
Appendix A
Excerpts of documentation from Perl conversion script
header that defines Otter data tags.
# date tag
# --------
#  d year month day
#    (date of the data in this file)
#    Optional
#    year (int)
#    month 0-11 (int)
#    day (int)
#
# size of graph tags

# ------------------
#       t number
#               (total number of nodes)
#               Must be before all nodes
#               number the number of nodes to follow. (int)
#       T number
#               (total number of links)
#               Must be before all links
#               number  the number of links that will used (int)
#
#  s size
#    (size of following objects)
#    Any number
#    number - the size of the following objects (int)
#
# node names tags
# ---------------
#       n node_index x y name
#       N node_index lat long name
#       ? node_index name
#               (node)
#               node_index      - unique node identifier (int)
#               x               - the x location on map (positive int)
#               y               - the y location on map (positive int)
#               lat             - latitude (float)
#               long            - longitude (float)
#               name            - name of the node (string no spaces)
#
# group tags

# ----------
#       g index s|d num_enters description
#               (attribute group)
#               index       - unique group (int)
#    c    - type of group (char)
#           d  - group contains doubles
#                  s  - group contains strings
#               num_enters      - number of entries (int)
#               description     - description of group (string up to \\n)
#
# field tags
# ----------
#       f group_index string'string2'string3'....
#               (fields of each attribute group)
#    Must be after it's group definition
#               group_index     - identifier for the ValuesGroup which has
#                               these fields (int)
#               string1'    - a list of strings separation by '
#        number of strings must be same as group
#        num_enters
#
# value tags

# ----------
#       v node_index group_index value1'value2'value3 ...
#       v node_index group_index value1'value2'value3 ...
#       V link_index group_index value1'value2'value3 ...
#               (values for the attribute group)
#               node_indexes  - identifier for the node (int)
#                               both nodes and site share the same
#                               domain of index so n reference to either
#                               a node or a site
#               link_index      - identifier for the link (int)
#               group_index     - identifier for the ValuesGroup which holds
#                               these values (int)
#               value1          - values for each field (float)
#
# link tags
# ---------
#       l link_index from_idx to_idx
#       L link_index from_idx to_idx
#               (link)
#               l - unidirectional
#               L - bidirectional
#               link_index  - unique link index (int)
#               from_idx       - index of the from node (int)
#               to_idx       - index of the to node (int)
#
# path tags

# ---------
#       p index num_nodes n_idx1 n_idx2 n_idx3 ...
#       P index num_nodes n_idx1 n_idx2 n_idx3 ...
#         (path)
#               p - unidirectional
#               P - bidirectional
#               index    - unique path index (int)
#               num_nodes   - the number of nodes in the paths (int)
#               n_idx*    - the points on this path, in order (int)
#