

Methodology for Passive Analysis of a University Internet Link
Methodology for Passive Analysis of a University Internet Link 1
Nevil Brownlee, 2 kc claffy, Margaret Murray 3 and Evi Nemeth 4
Abstract
Passive monitoring of Internet links can efficiently provide valuable data on a wide variety of network performance measures. We use two publicly available monitoring tools (CoralReef and NeTraMet), exploring their synergy and relevance for collecting and analyzing Internet flow data. We consider measurement design issues, then present two case studies that use these tools to analyze an Internet connection at a large university. We illustrate and discuss the potential for investigating operational and research questions using our passive measurement methodology.Keywords: Network Performance Monitoring, Flow Measurement, NeTraMet
1 Introduction
Greater dependence of organizations on their network corresponds to an increasing interest in measuring network performance. Active measurement methodologies actively inject packets to gauge network behaviour. Passive network measurements examine existing traffic, and are therefore less intrusive. Various groups use one or both of these methodologies to monitor their networks. For example:
- HEPnet
- [6] makes active measurements of response time and packet loss. Reports are available to users via a web page interface. In addition, each HEPnet site also provides a reverse traceroute server to help its members gather information about routes between particular sites.
- JANET
- [10] uses passive measurements to collect accounting data and summarise traffic flows from each member site to various destinations.
- I2(Abilene)
- [1] uses both active ICMP and mping probes and also gathers passive statistics from router MIBs.
In our passive measurement methodology, we collect flow data using NeTraMet [13], an open source implementation of the IETF's Realtime Traffic Flow Measurement (RTFM) architecture. An introduction to NeTraMet is given in [7]. For these studies we use a NeTraMet variant that works with the CoralReef library [3]. Specifically, we modified NeTraMet to handle as input the data collected by a CoralReef OCxMON monitor [4]. The CoralReef monitor collects IP header information which NeTraMet filters through its rulesets to analyse traffic flows of interest.
In our campus environment all commercial Internet traffic to and from the university traverses one commodity ATM OC3 link, rate-limited to 20Mbps. Other Internet links to CALREN, I2(Abilene), and VBNS+, service research and academic traffic. Campus personnel responsible for network operations can use our measurement methodology for both real-time incident detection and long-range capacity planning. Internet researchers find such data valuable for empirical validation of models and assumptions, and for generating realistic input to network simulators [2].
2 Network Measurement Design Issues
Setting up a meaningful measurement infrastructure for any large network requires careful consideration of 1) use of either active or passive techniques; 2) monitor placement within the network topology; 3) selection of useful metrics; and 4) data collection and archiving.
2.1 Active versus Passive Techniques
Active measurements inject test packets into the network and observe their behaviour. For example, the simple ping tool measures round-trip-time (RTT) of ICMP probe packets. In contrast, passive measurements observe actual traffic without perturbing the network. Passive monitors must process the full load on the link, which can be problematic on high-speed links. Passive measurements commonly collect traffic flow data, either from routers and switches [12], [11], or from stand-alone traffic meters [13].
2.2 Monitor Placement within the Network
A clear understanding of network topology, particularly link and router location, is a prerequisite to monitor placement. Upon discovering the network topology, one can identify IP net-blocks (i.e. ranges of IP addresses) that appear on each link, and can target traffic flows of interest. While it is tempting to measure the traffic between every pair of sites, the cost does not scale with the benefit. Instead, one might identify which links carry the most traffic, and locate monitors there. Alternatively, one could begin by monitoring traffic at all border routers of one's infrastructure.
2.3 Metric Selection
The CAIDA Metrics Working Group Measurement FAQ [14] summarises metrics and the way they are used in practice. The Working Group's consensus was that the most commonly used network metrics are latency, packet loss percentage, link utilization, and availability. Although these metrics are commonly used, they are not always clearly defined.
The IETF's IPPM Working Group [8] has developed a framework for performance metrics, and is producing standards for metrics such as connectivity, one-way delay, one-way packet loss, round-trip delay, delay variation, bulk transfer capacity, etc. These newer metrics will become more important as providers move to implement different Qualities of Service (QoS) in their networks.
All the above metrics measure the behaviour of packets on a link; they only provide an indirect view of a network's performance as experienced by its users. Attempts to measure user-perceived network performance [17] require research to determine valid metrics.
2.4 Data collection and archiving
Traffic analysis requires collection of monitor data into one or more archive locations. One common approach involves building a trace file repository enabling users to request a report on specific sites, metrics, or time periods. Alternately, an RTFM meter can filter and process data in real-time to reduce data storage requirements.
Once a measurement data repository is in place, it is important to provide a clear, easy-to-use web interface to its data. There is no point in collecting data if users can't access it easily so as to make effective use of it.
3 Passive Measurement Methodology
|
|
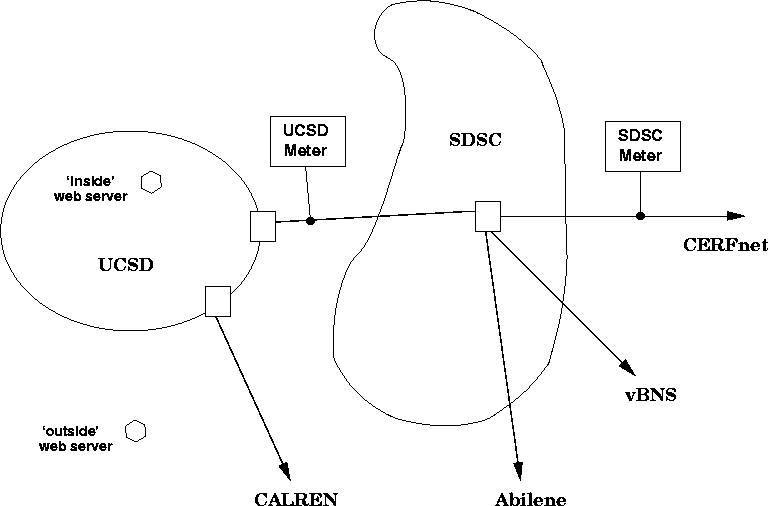
We installed two CoralReef-based NeTraMet meters in the UCSD network topology, as shown in figure 1. The SDSC network connects to the commodity Internet via the CERFnet link, and to the vBNS+ and I2(Abilene) research and higher education networks via separate links. The UCSD network lies within SDSC, connecting to the Internet directly via a link to the CalREN education network, and indirectly via an internal link to SDSC.
The UCSD network contains four netblocks (IP address ranges). Traffic from one of these netblocks reaches the Internet directly via the CalREN link, so it is not seen by our meter. Instead, the meter sees all packets passing (in both directions) on the internal link between UCSD and SDSC, which carries Internet traffic for the other three UCSD netblocks.
The SDSC meter monitors our CERFnet link. This is an ATM OC3 connection, rate-limited to 20 Mbps. SDSC routers send packets for IP addresses outside SDSC to one of the three (CERFnet, vBNS+ and I2(Abilene)) links; packets also return on the same links although typically not the same one (as symmetric routing).
The SDSC network contains an additional 10 netblocks, making 14 a total of 14 for UCSD and SDSC combined. Our SDSC meter sees packets for all 14 netblocks, but for most of them it only sees packets in one direction. We have, however, found four SDSC netblocks for which the SDSC meter normally sees all packets in both directions.
We present case studies below that demonstrate the power and efficiency of the CoralReef-based NeTraMet data collection and analysis methodology. NeTraMet meters have historically been deployed to support accounting and billing functions [10]. We illustrate NeTraMet's aggregation and graphing capabilities and its utility for analyzing real-time flow data for research purposes. Case study results reveal insights for a variety of workload and performance studies.
After specifying the measurement goals of our case studies, we design and implement NeTraMet rulesets to collect necessary data. Rulesets are essentially configuration files that specify to the NeTraMet meter:
- Source and destination addresses for flow of interest
- Flow direction (derived from source endpoint)
- Address granularity
A more detailed discussion of rulesets is given in [16]. Once written, careful testing of candidate rulesets involves making sure that:
- Flow handling is correct for all site pairs
- Distribution parameters (e.g., number of bins, upper and lower limits) are well chosen for the expected traffic load
Rulesets tend to evolve: one runs a ruleset for a time, analyzes the flow data it produces, then refines the ruleset according to needs.
4 Case studies
We present two case studies. The first examines link data rates. The second compares time variation of stream lifetimes and sizes.
4.1 Short-term Data Rates
In this case study we measure the total data rate into and out from SDSC on the CERFnet link. We began by making a list of the netblocks located within the SDSC and UCSD networks. Each netblock appears in a define statement in the ruleset, as follows:
# Ruleset to get 10-second data rates for CERFnet link
define CAIDA          = 192.172.226/24;
define HYPERNET       = 153.105/16;
define MPL106         = 192.135.237/24;
define MPL4           = 192.135.238/24;
define NET_NSI        = 198.133.185/24;
define SCRIPPSNET_BIG = 137.131/16;
define SDSCFDDIDMZ    = 198.17.46/24;
define SDSC2          = 132.249/16;
define SDSC_APOLLO    = 192.31.21/24;
define SDSCNET_CBLK   = 198.202.64/18;
define UCSD           = 128.54/16;
define UCSD_CERF      = 199.105.0/18;
define UCSD_EXTRN     = 137.110/16;
define UCSD_SUB       = 132.239/16;
define UCSD_NETS =
   UCSD, UCSD_SUB, UCSD_EXTRN, MPL106, MPL4, UCSD_CERF;
define SDSC_NETS =
   SDSC2, SCRIPPSNET_BIG, HYPERNET, SDSC_APOLLO, CAIDA,
   SDSCFDDIDMZ, SDSCNET_CBLK, NET_NSI;
define SOURCE_NETS = UCSD_NETS, SDSC_NETS;
   if SourcePeerType == IPv4 save;
   else ignore;
   if SourcePeerAddress == (SOURCE_NETS) {
      # To means 'away from SOURCE'
      save ToBitRate   = 48.10.0!0 & 1.3.1!24000;
      save FromBitRate = 48.10.0!0 & 1.3.1!24000;
      # 48 buckets, 10s rates, linear, **3 => 1k..24M B/s
      count;
      }
set data_rate_n;
format
  FlowRuleSet FlowIndex FirstTime SourcePeerType
  "  " ToPDUs FromPDUs "  " ToOctets FromOctets
  "  (" ToBitRate
  ") (" FromBitRate
  ")";
SOURCE_NETS defines the set of netblocks inside our site. It is tested in the second if statement, so that the meter will consider the UCSD end of each flow as its source. As a consequence, To attributes describe data flowing away from UCSD (the source), and From attributes describe data flowing into UCSD.
|
|
If the two save statements were left out, the ruleset would simply increment the flows To and From byte counters. Instead, we chose to read the flow data from the NeTraMet meter at 5-minute intervals, so we could compute the average data rates over each interval. However, using a long measurement interval in this way does not give a particularly good indication of how bursty the traffic actually is.
Instead, NeTraMet provides two attributes, ToBitRate and FromBitRate, which allow one to measure flow data rates over a much shorter interval and build distributions of these short-term data rates. In the save *BitRate statements, the right-hand side of the equals sign specifies two sets of distribution parameters, separated by an ampersand. These parameters, separated by dots or exclamation marks, appear in the following order. Parameter set one: 1) the number of bins into which data is categorised (48 in this case, with overflows counted in an extra bucket); 2) the rate-measuring interval (10 seconds); 3) packet matching type (0, meaning just count); 4) unused, set to zero. The second set of parameters follows the ampersand: 5) if 1, linear transform when selecting bin, if 2, log transform; 6) power of ten scaling factor for limits (103 or 1000); 7) lower limit of data range; 8) upper limit of data range.
The parameter values assigned to the ToBitRate and FromBitRate attributes configure NeTraMet's scales for axes of the distribution plots. On the y axis, data is binned into 48 buckets (with 1 more for overflow) whose values accommodate data rates between 1 kbps and 24000 kbps (24 Mbps). On the x axis, a complete distribution of 10-s data rates is measured every 5 minutes, allowing us to plot distribution parameters such as percentiles.
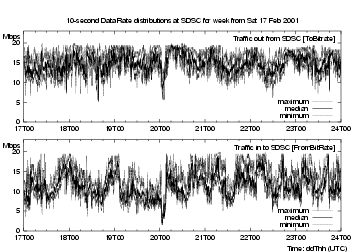
In figure 2 we plot the maximum (grey), median (black) and minimum (grey) 10-second data rates for the week 0f 17-24 Feb 2001. Times on plots indicated using notation explained in [9], in this case dateThh, e.g. Monday 19 Feb runs from 19T00 to 20T00. All our measurements use UTC time, which was 8 hours ahead of San Diego Local Time when these measurements were made.
As expected, these plots show that the data is indeed bursty, with many short spikes. There are clear diurnal variations both inbound and out, but there is little correlation between inbound and outbound traffic. For this week, outbound traffic was consistently greater than inbound; this was probably not the case for the other three links to Education/Research networks.
The maxima clearly show the CERFnet rate-limiting the link at 20 Mbps, which is not at all visible in the 5-minute medians, and certainly not in the 5-minute average rate. NeTraMet's ability to provide real-time distributions for any required flows in a torrent is particularly useful for production network monitoring.
4.2 Time Variations of Stream Lifetime and Size
This case study examined behaviour of streams, i.e. individual TCP or UDP sessions as described in [16]. Having extended NeTraMet to process streams within flows, we implemented attributes providing distributions of stream duration (FlowTime) packets from source to destination (ToFlowOctets) and packets from destination to source (FromFlowOctets).
To use these new attributes, the meter builds chains of streams for each flow. When a stream completes (times out), the meter incorporates its duration and byte counts into the distribution of each of these attributes. Collecting these distributions at 5-minute intervals over periods of days allows us to study their variation over the week.
We are also interested in whether these distributions behave differently by protocol. As a starting point, our ruleset creates four separate flows, each with the three distributions, for UDP streams, non-web TCP streams, and web streams with servers outside and inside the UCSD network (such web servers are shown as hexagons on figure 1). The associated ruleset is as follows:
# Collect stream lifetime and size distributions
define UCSD_SUB    = 132.239/16;
define UCSD_EXTRN  = 137.110/16;
define UCSD_CERF   = 199.105.0/26;
define SOURCE_NETS = UCSD_SUB, UCSD_EXTRN, UCSD_CERF;
define WWW = 80;  # www port number
   if SourcePeerType == IPv4 save;
   else ignore;
   if SourceTransType == TCP save,
      store FlowKind := 2;
   else if SourceTransType == UDP save,
      store FlowKind := 1;
   else ignore;
   if SourcePeerAddress == (SOURCE_NETS) {
      # To means 'away from SOURCE'
      if DestPeerAddress == (SOURCE_NETS)
         ignore;  # Internal UCSD flow, ambiguous
      if SourceTransType == TCP {
         if SourceTransAddress == WWW &&
               DestTransAddress == WWW
            store FlowKind := 5;  # Would be ambiguous
         else if DestTransAddress == WWW
            store FlowKind := 3;  # Server outside UCSD
         else if SourceTransAddress == WWW
            store FlowKind := 4;  # Server inside UCSD
         }
      save ToFlowOctets   = 50.0.0!0 & 2.2.1!1000;
      save FromFlowoctets = 50.0.0!0 & 2.2.1!1000;
         # 50 buckets, PP_NO_TEST, log, 100..100k B
      save FlowTime = 50.0.0!0 & 2.4.1!12000
         # 50 buckets, PP_NO_TEST, log, 10 ms .. 120 s
      count;
      }
set flow_stats_size;
format
  FlowRuleSet FlowIndex FirstTime SourcePeerType
  SourceTransType "  " FlowKind
  "  " ToPDUs FromPDUs "  " ToOctets FromOctets
  "  (" ToFlowOctets ") (" FromFlowOctets
  ") (" FlowTime
  ")";
The ruleset sets the FlowKind attribute to indicate the flow's protocol. There are two possible sources of ambiguity in the flows, which are noted in the ruleset's comments. The first is caused by packets passing between two hosts within UCSD; such packets are ignored (by the ignore statement). The second is that the meter may see packets where both client and server use port 80; such packets have FlowKind set to 5, which distinguishes their flow from flows where client and server use different IP ports.
The distributions use 50 bins with logarithmic ranges, 10 ms to 120 seconds for FlowTime and 100 Bytes to 100 kiloBytes for ToFlowOctets and FromFlowOctets.
4.2.1 Daily Variation of Stream Distributions
|
|
|
|
|
|
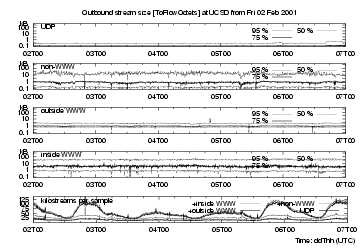
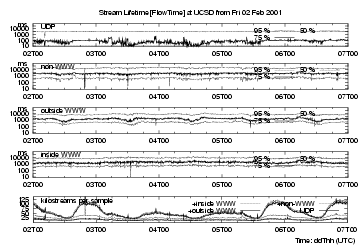
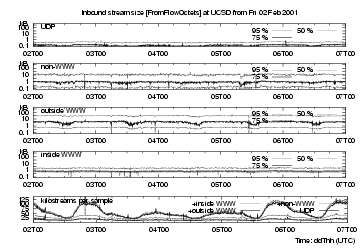
The bottom strip charts in figures 3, 4 and 5 show the number of streams timed out in each 5-minute interval for four different types of flows, providing an indication of (user-driven) network activity. The lowest line in each bottom strip chart shows the number of UDP flows, the next line above is the number of UDP + non-web TCP flows, i.e. the difference between these two traces shows number of non-web TCP flows. The third line adds web flows with web servers outside UCSD, and the highest trace adds flows with web servers inside UCSD.
These plots cover Friday 2 Feb through to the end of Tuesday 6 Feb. Weekend activity is about 60% that of weekdays, and there is a strong diurnal variation, with minima at about 1400 UTC, i.e. 0600 local time in San Diego.
The top four traces on each figure show the 50th, 75th and 95th percentiles of the 5-minute distributions for each of the protocols selected (i.e.values of FlowKind).
extbf{UDP flows} are mostly short-lived, with median < 10 ms, but there is also a steady background of long-lived UDP flows. UDP flows are small for outbound requests, with their 95th percentile less than 300 Bytes; they are slightly larger for inbound responses.
extbf{TCP non-web flows} are longer-lived, with median lifetimes around 300 ms and 95th percentile just over 10 s. Their inbound and outbound stream sizes are similar, with 95th percentile around 15 kB. These percentiles are fairly steady, but show downward spikes at 0202T2000, 0203T1200, 0205T0800 and 0205T1400, for lifetimes and for both inbound and outbound bytes. Such downward spikes could be caused by a short (several minutes in duration) burst of short-lived small-size streams, for example a denial of service attack.
extbf{(TCP) web flows} for inside servers (i.e., those on campus) have FromFlowOctets (http requests) flowing into UCSD, and ToFlowOctets (http responses, i.e., elements of web pages) flowing away from UCSD. For outside (off-campus) servers, To- and FromFlowOctets are interchanged. The lines plotting http requests are similar, except that they have spikes at different times. These appear similar to those discussed above for non-web flows. Http response sizes have similar long-term percentiles; we would expect these to match distributions of file sizes [5]. For outside servers there is clear diurnal size variation, with low points matching those of the bottom trace (number of flows per interval) For inside servers there is little diurnal variation, likely since there are just so few flows from inside (i.e., on-campus web) servers. For web response streams, the median size is about 700 Bytes, lifetime about 400 ms. Their 95% size is about 30 kB, lifetime about 7 seconds.
Overall, it seems surprising that although the four kinds of streams show transients at different times, their stream size and lifetime distributions vary little over longer periods, in this case five days.
4.2.2 Examples of Cumulative Stream Distributions
|
|
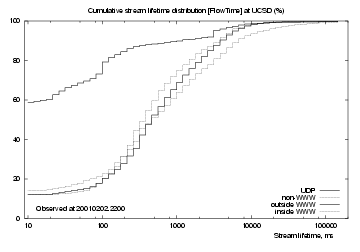
Since the stream distributions do not vary significantly over the five days discussed above, we chose an arbitrary time, 2200 (UTC) on Friday 2 Feb, and plotted cumulative distributions for FlowTime, FromFlowOctets and ToFlowOctets. These plots do not show more information than the time-variation plots above, but they do give a better idea of where the percentiles lie.
Figure 6 shows cumulative distributions of flow lifetimes. For UDP (uppermost black line), there are three regions: 60% of UDP streams are 10 ms or shorter, after that the curve climbs slowly to reach 95% at about 3 seconds.
Observed TCP streams follow much the same curve. About 10% are 10 ms or shorter, then the curves rise smoothly to reach 95% at about 5 seconds. Non-web TCP (grey line) flows generally last longer, reaching 95% at about 10 seconds.
|
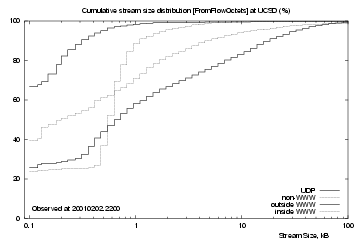
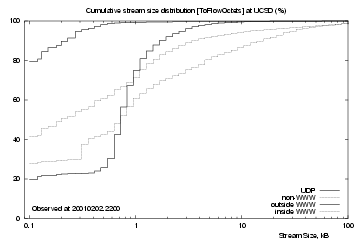
Figure 7 shows cumulative distributions for streams inbound to UCSD (upper plot) and outbound from UCSD (lower plot). UDP streams (uppermost black line) reach 99% at about 10 kB, but there are a few larger ones, likely audio or video streams. 65% of them carry 1 kB or less data into UCSD, and 80% carry 1 kB or less data out.
Non-web TCP streams (next highest grey line) carry similar amounts of data in and out - their inbound and outbound curves are near-identical, showing a slow rise across the observed size range. There are many streams with large data sizes.
The `inside WWW' (lower grey line, upper plot) and `outside WWW' (lower black line, lower plot) lines show http request streams, which show a sharp rise near the centre of the logarithmic plots. About 20% of them had 1 kB or less data, but both show a sharp rise to their 75th percentile. For inside servers this rise occurs at about 600 Bytes, for outside servers at about 800 Bytes. This suggests that requests to outside servers are larger because they have longer addresses.
The `outside WWW' (lower black line, upper plot) and `inside WWW' (lower grey line, lower plot) lines show http response streams (delivering web objects). There is little difference between `inside' and `outside' web servers, indicating that they have similar distributions of file sizes.
To summarise, UDP streams are mostly small and short-lived; most are probably DNS request/response pairs, but there are a few large, long-lived streams. Web and non-web TCP streams have similar lifetimes, but there are clear differences between web and non-web stream sizes. At least for the UCSD network, non-web stream sizes are consistently greater than web stream sizes.
5 Summary and Conclusions
The RTFM [15] approach to collecting traffic flow data allows flexibility in defining flows, using a high-level language to configure a traffic meter. The meter itself performs as much data reduction as possible. We then use perl scripts to process resulting data into graphs. NeTraMet is currently used by ISP operations personnel and university network administrators mainly to collect traffic data for billing and network engineering purposes. Our investigation demonstrates its additional utility as a research tool.
As in any measurement project, one must decide beforehand what to measure. One can begin with a hypothesis, then develop a NeTraMet ruleset to collect data that tests that hypothesis. As understanding improves, one can iteratively modify the ruleset. In such a study, it can be helpful to use a CoralReef monitor to capture a header trace file in order to test many different ruleset versions against the same data. Such flexibility makes the CoralReef-coupled version of NeTraMet of tremendous value for research.
References
- [1]
- Abilene Network operations website,
http://monon.uits.iupui.edu/ - [2]
- Hans-Werner Braun and kc claffy, Post-NSFNET statistics collection, in White Papers for the Unpredictable Certainty: information infrastructure through 2000, pp 85-96, Computer Science and Telecommunications Board, National research Council, National Academy of Sciences, Washington DC, 1997. Available at https://catalog.caida.org/paper/1995_pnsc/
- [3]
- CoralReef website,
https://www.caida.org/catalog/software/coralreef - [4]
- CoralReef compatible hardware and optical splitters,
https://www.caida.org/catalog/software/coralreef/hardware/
and https://www.caida.org/tools/measurement/
coralreef/splitters - [5]
- Allen B. Downey, The structural cause of file size distributions, Technical Report CSD-TR25-2000, Wellesley College,
Massachusetts, available at
http://rocky.wellesley.edu/downey/filesize/ - [6]
- HEPnet Network Resource Centre website,
http://www.hep.net/hepnrc.html - [7]
- Nevil Brownlee, Using NeTraMet for Production Traffic Measurement, Intelligent Management Conference (IM2001), May 2001
- [8]
- IP Performance Metrics website,
http://www.ietf.org/html.charters/ippm-charter.html - [9]
- Kuhn, M., A Summary of the International Standard Date and Time Notation,
http://www.cl.cam.ac.uk/~mgk25/iso-time.html - [10]
- JANET website, http://www.ukerna.ac.uk/
JANET Traffic Accounting website, http://bill.ja.net/ - [11]
- Amsden, P., Amsweg, J., Calato, P., Benslet, S. and Lyons, G., Cabletron's Light-weight Flow Admission Protocol Specification, RFC 2124, March 1997
- [12]
- NetFlow Services and Applications (an introduction and overview),
http://www.cisco.com/warp/public/cc/pd/iosw/ioft/neflct/ tech/napps_wp.htm - [13]
- Netramet website, http://www.auckland.ac.nz/net/NeTraMet/
- [14]
- CAIDA Metrics Working Group, Network Measurement FAQ, January 2001,
- [15]
- RTFM website, http://www.auckland.ac.nz/net/Internet/rtfm/
- [16]
- Nevil Brownlee and Margaret Murray, Streams, Flows and Torrents, PAM2001 workshop paper
- [17]
- Performance Measures for Multimedia Applications, Hughes, W. R., Proceedings 38th IETF meeing, Memphis, April 1997. Available at http://www.ietf.org/proceedings/ 97apr/ops/rtfm-2/index.htm
Footnotes:
1 Support for this work is provided by DARPA NGI Contract N66001-98-2-8922, NSF Award NCR-9711092 ``CAIDA: Cooperative Association for Internet Data Analysis'' and The University of Auckland.
2 The University of Auckland, New Zealand and CAIDA, University of California, San Diego e-mail: nevil@caida.org
3 CAIDA, University of California, San Diego e-mail: kc@caida.org, marg@caida.org
4 University of Colorado and CAIDA, University of California, San Diego e-mail: evi@caida.org
File translated from TEX by TTH, version 2.92.
On 21 May 2001, 18:50.