Traffic workload trends
from 1998-2003 NLANR archive traces
We surveyed a publicly available archive of traces collected and maintained by NLANR: about 4000 traces obtained monthly at two dozen facilities during the period from November 1998 to April 2003. The analysis published at the Winter International Symposium on Information and Communication Technologies (WISICT04) is available here. This web report is an Appendix to the published study. It presents full sets of graphs for all monitored sites grouped by parameters in the graphs.
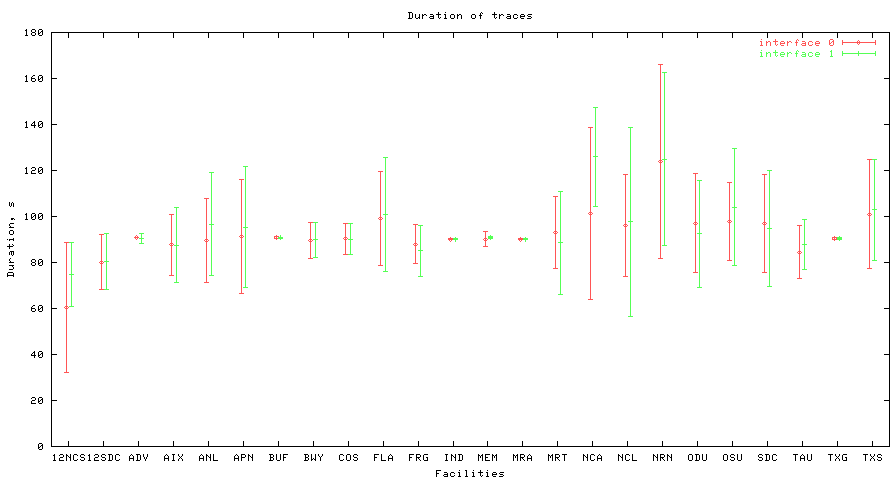
In the archived traces, the packet headers were captured at two interfaces
from one to eight times a day once per month. Figure 1 shows the average and
the standard deviation of measurement duration at each facility.

We used 30 second intervals for data processing. That means that each trace contributes as many data points as the number of complete 30 second intervals it contains. Data from incomplete (< 30 sec) intervals are discarded. In all figures, the data from both interfaces are plotted together - red points correspond to interface 0, green points correspond to interface 1.
Sets of graphs below show measurements of the traffic parameters
{bit rate, packets, flows, IP pairs} per 30 second interval versus time.
Figure 2. Bit rate vs. time.
Figure 3. Packets vs. time.
Fugure 4. Flows vs. time.
Figure 5. IP pairs vs. time.
The next sets of graphs show the {packets, flows, IP pairs} observed per 30 second interval versus the bit rate in the same interval. The blue line shows the linear regression of points in the logariphmic space, that is an approximation of type
| y = A·xa | (1) |
in a linear space. The magenta line corresponds to a linear slope,
a = 1 in (1).
Figure 6. Packets vs. bit rate, log scale.
Fugure 7. Flows vs. bit rate, log scale.
Figure 8. IP pairs vs. bit rate, log scale.
The next sets of graphs present the composition of traffic measured in {bytes, packets, flows} by protocols. In this analysis we considered the whole trace (rather than 30 second intervals as in the previous sets of graphs) and used a flow expiry timeout of 64 s. In each trace we counted the numbers of {bytes, packets, flows} attributed to a given protocol using the following categories: TCP, UDP, ICMP, IGMP, IP_in_IP, GRE, ESP, AH, SKIP, IPIP and other. In order to account for varying duration of traces these counts were converted to rates per second. Finally, we averaged the rates measured at a given site on both interfaces for all traces recorded on the same date. This procedure yields a single data point for each parameter {bytes, packets, flows} for each protocol per month.
Figure 9. Traffic protocols vs. time, bitrate.Figure 10. Traffic protocols vs. time, packet rate.
Fugure 11. Traffic protocols vs. time, flow rate.
We used the CoralReef software developed by CAIDA (https://www.caida.org/catalog/software/coralreef/) in order to process the traces.

