

Clients of DNS Root Servers - 2002-08-28
Clients of DNS Root Servers
Data were collected starting Wednesday 2002-08-28 16:10 UTC for 7 days in 10 minute intervals from {e,f,i,k,m}-root servers using dnsstat, which counts DNS messages and requests on UDP port 53 by src/dst address, opcode, qtype, and qclass. At a-root, data were collected starting Thursday 2002-08-29 21:19:25 for 4 days. The collectors at {a,e,i,k,m}-root were each run on a host that was connected to a link that carried the root server traffic (either directly or mirrored). At f-root, there are 4 hosts sharing the root server load; on each of them, tcpdump was used to forward data to a nearby host where dnsstat was run. The data from a-root were not yet available when this preliminary analysis was done.
Because collection at a-root was not as long and started at a different time as the others, many of the graphs below have two variants: one with all 7 days but without a-root, and one with a-root but only the 4 common days.
Click on any graph to see a larger version.
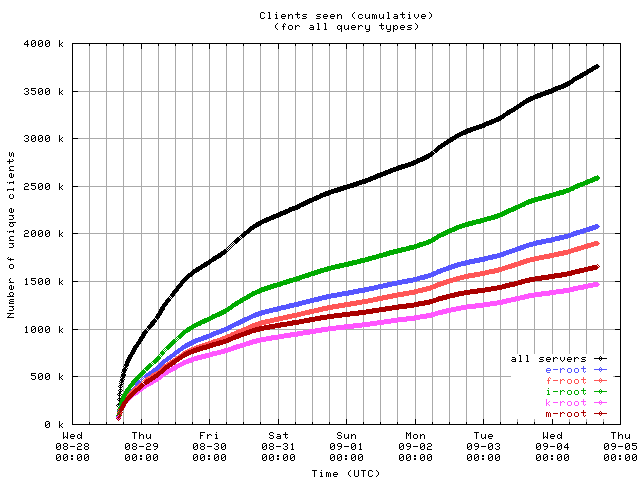
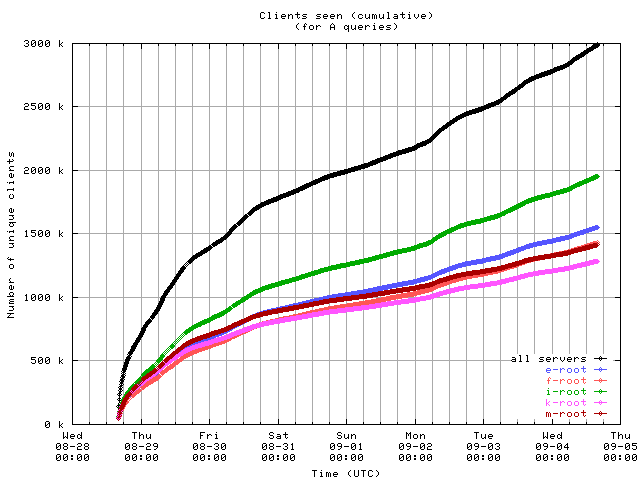
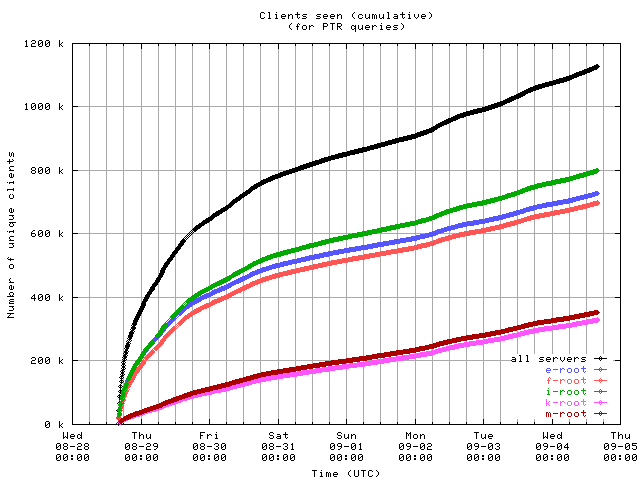
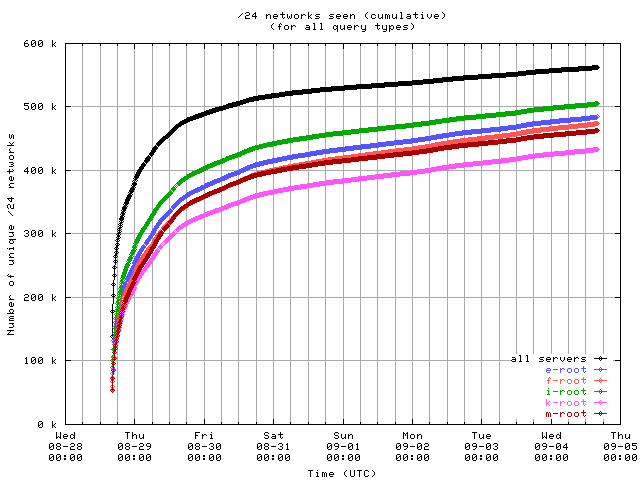
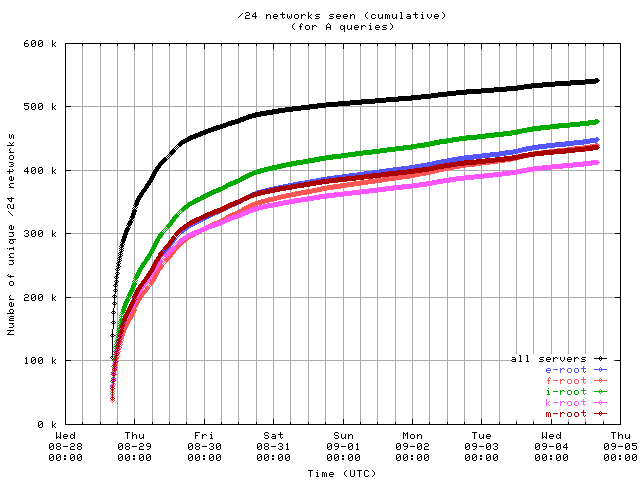
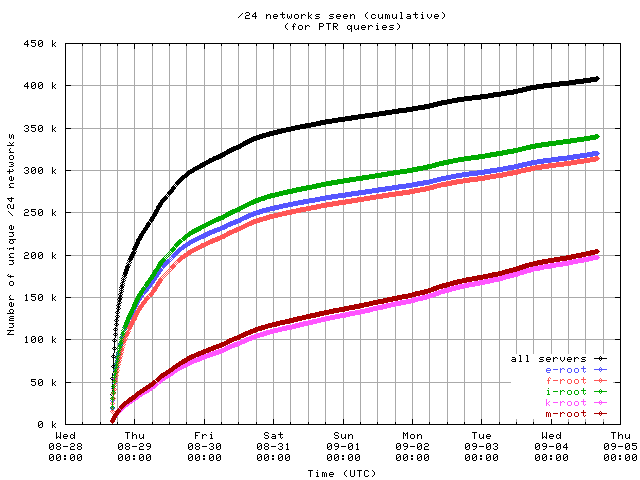
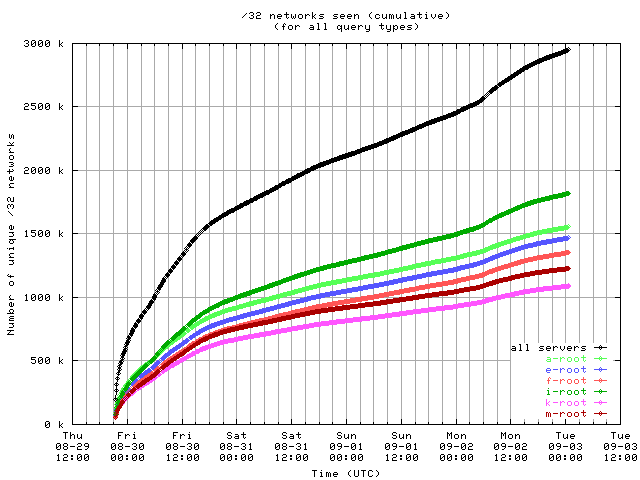
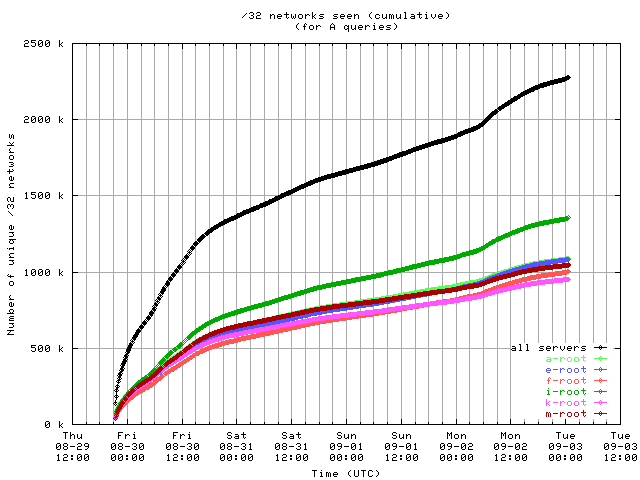
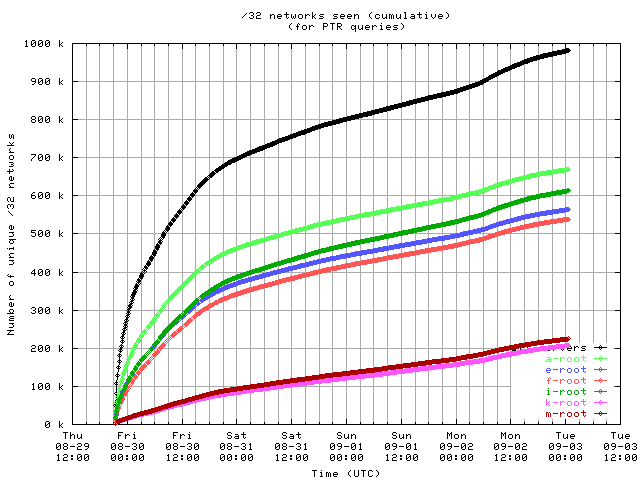
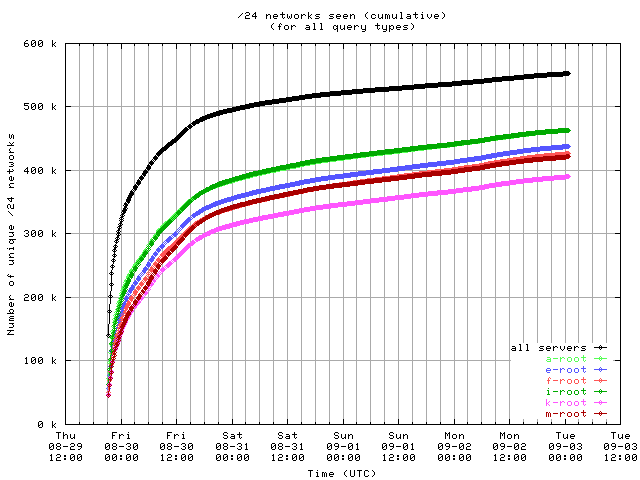
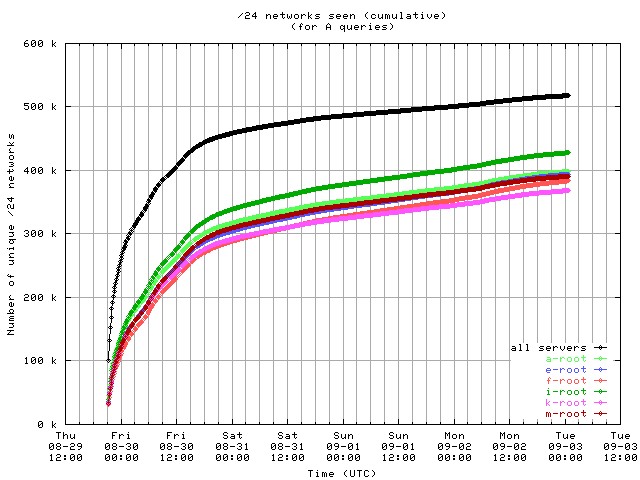
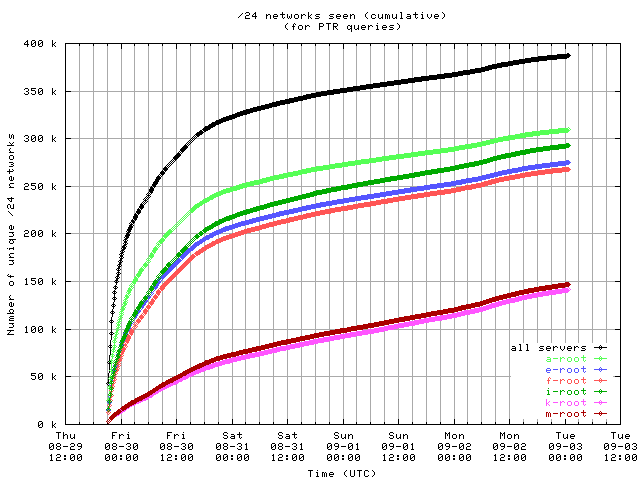
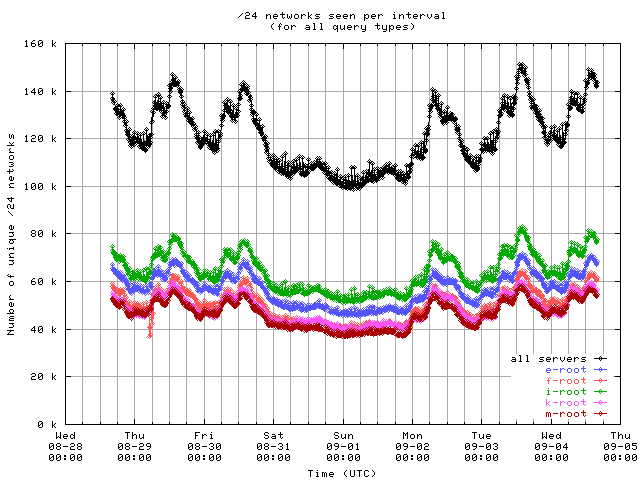
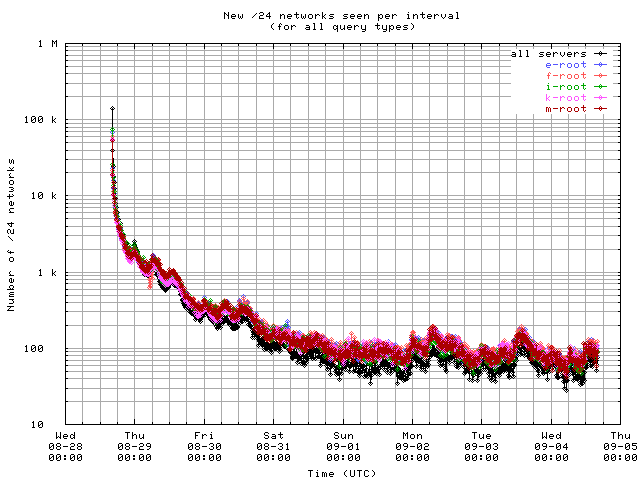
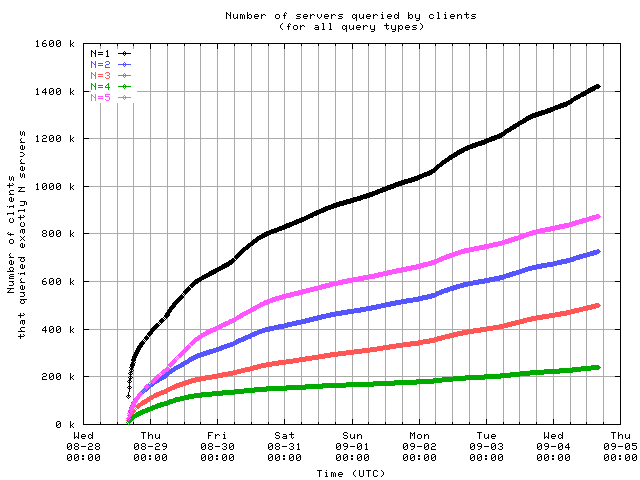
Accumulation of unique clients
These graphs show the number of unique clients or /24 networks seen by each individual server and by all servers combined, accumulated over the course of the 7 day collection period. The client curves do not level off, but the /24 curves do to a large degree.
Clients, for 7 days on {e,f,i,k,m}:
| 
| 
|
| 
| 
|
| 
| 
|
| 
| 
|
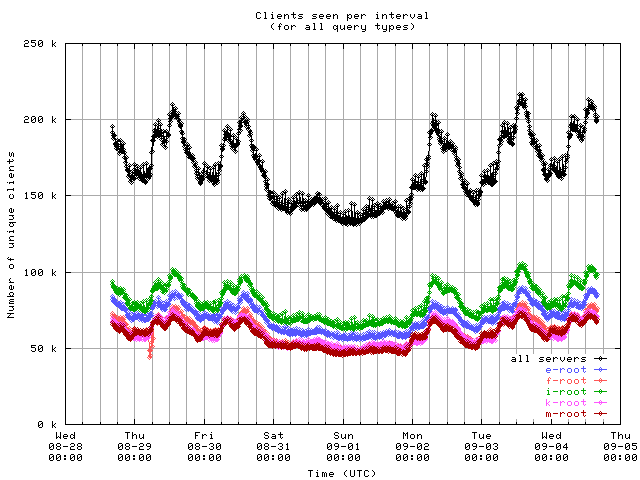
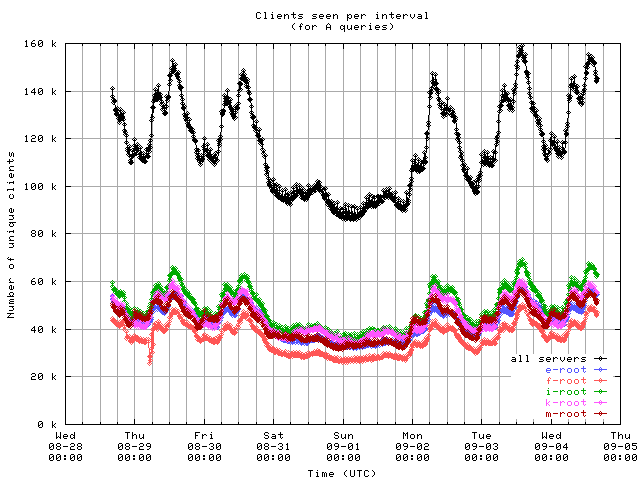
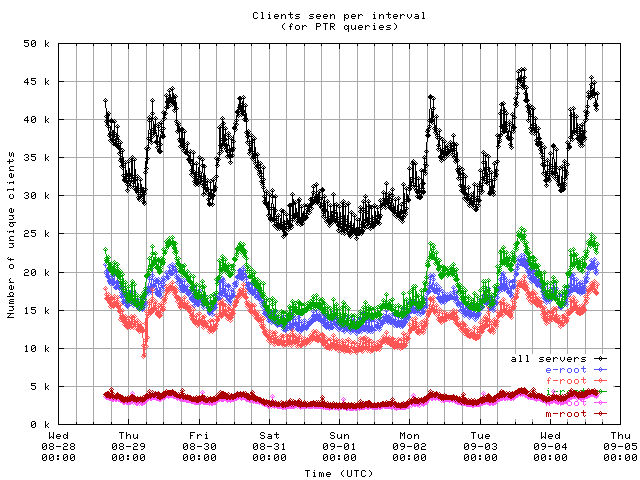
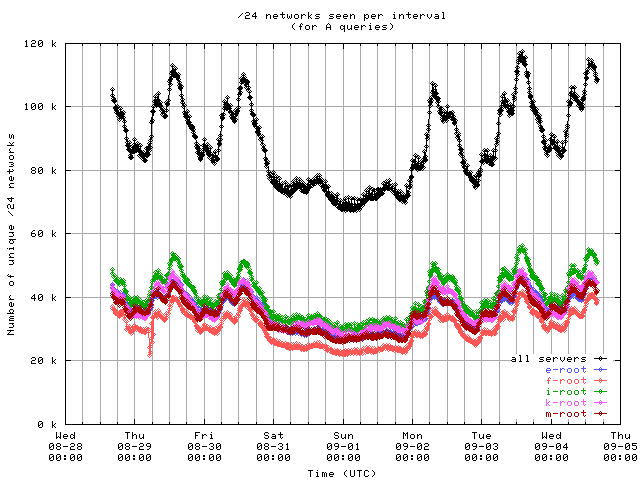
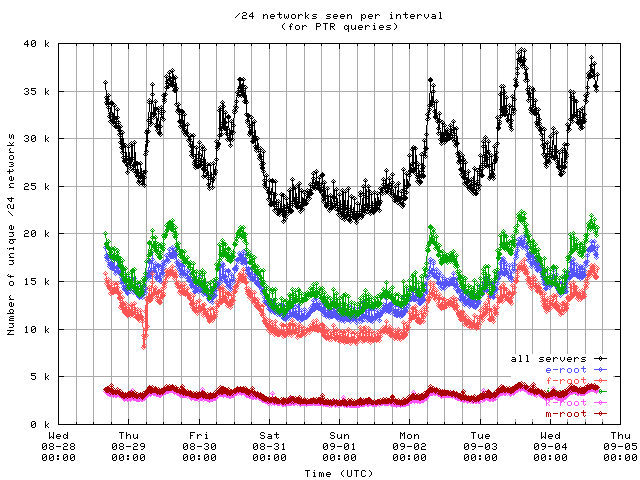
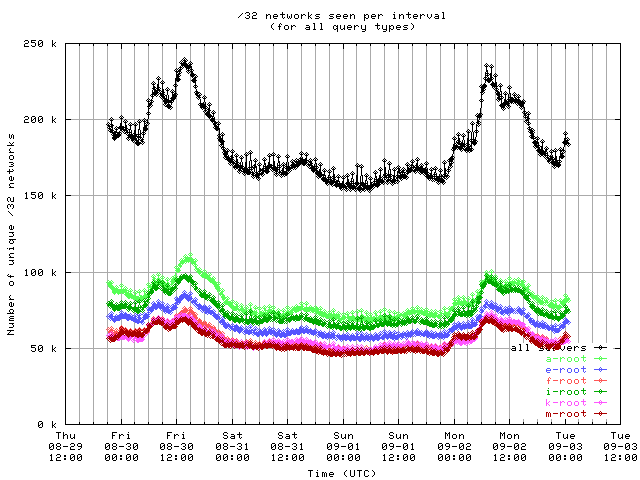
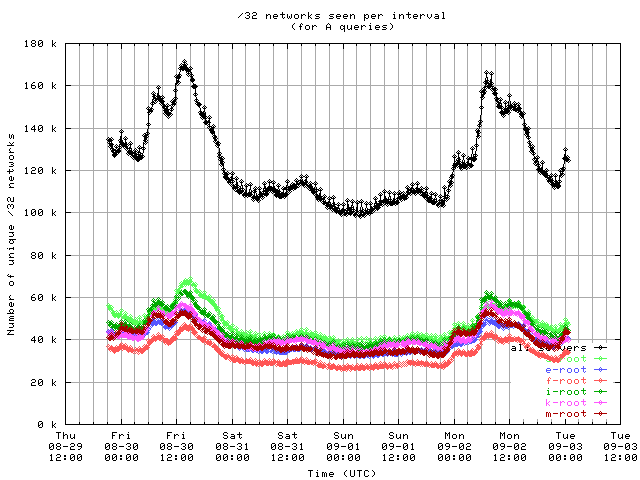
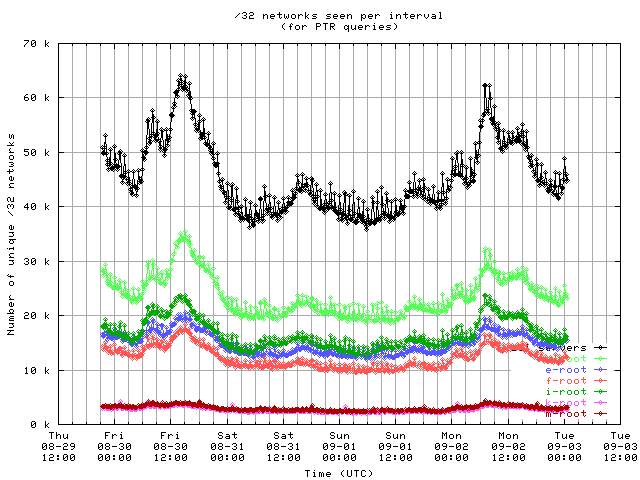
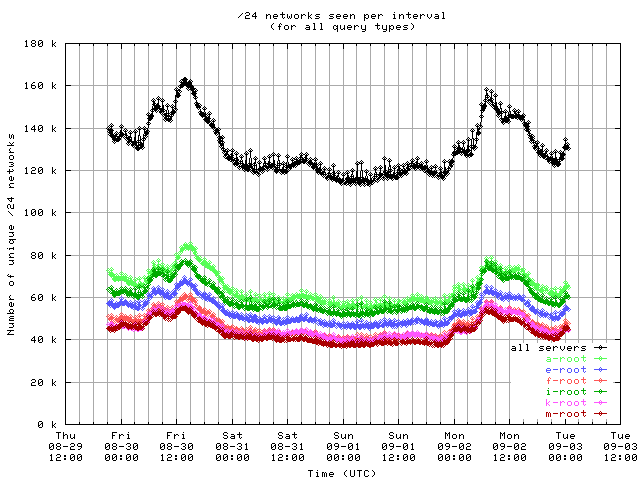
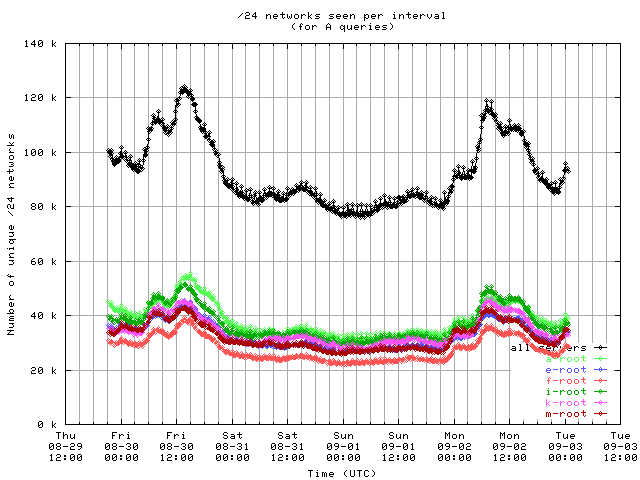
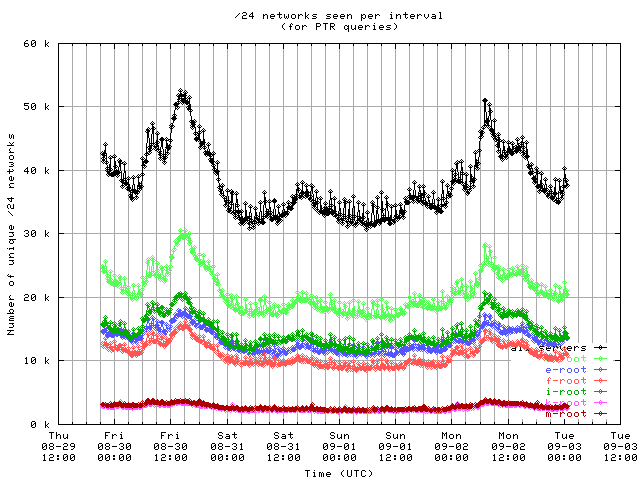
Unique clients per interval
These graphs show the number of unique clients seen in each 10 minute interval by each server and by all servers combined. Notice the clear diurnal pattern (08-31 and 09-01 was a weekend).
Clients, for 7 days on {e,f,i,k,m}:
| 
| 
|
| 
| 
|
| 
| 
|
| 
| 
|
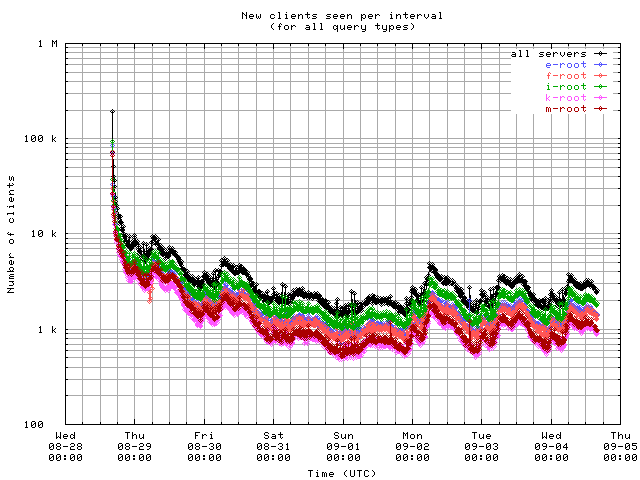
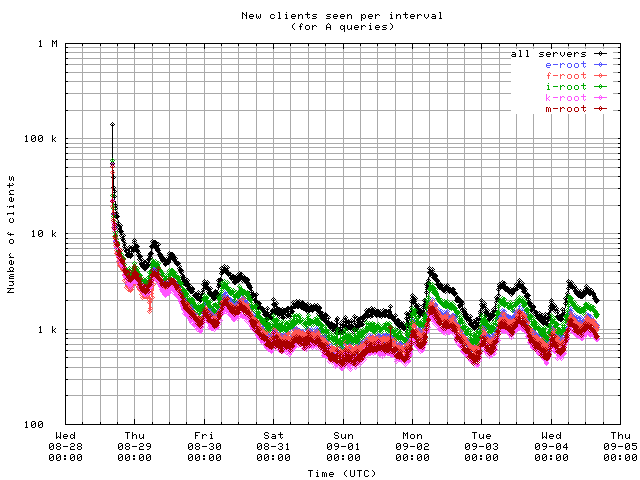
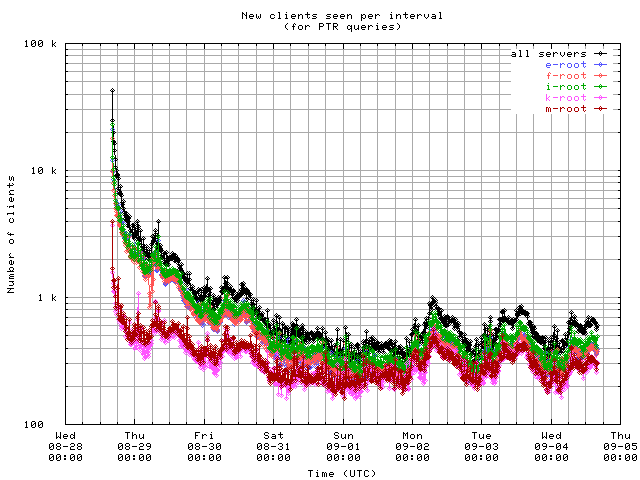
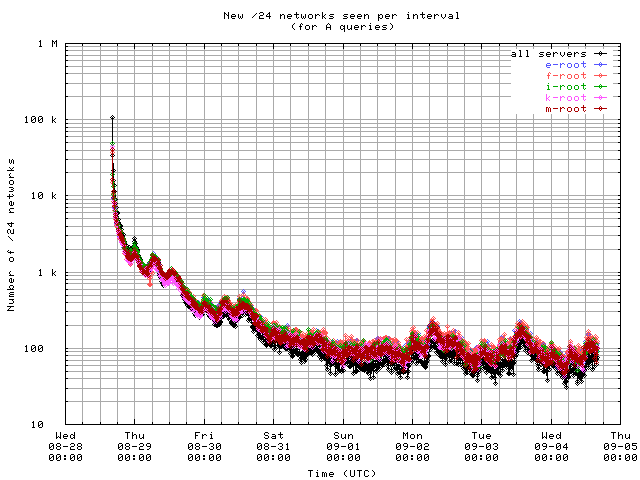
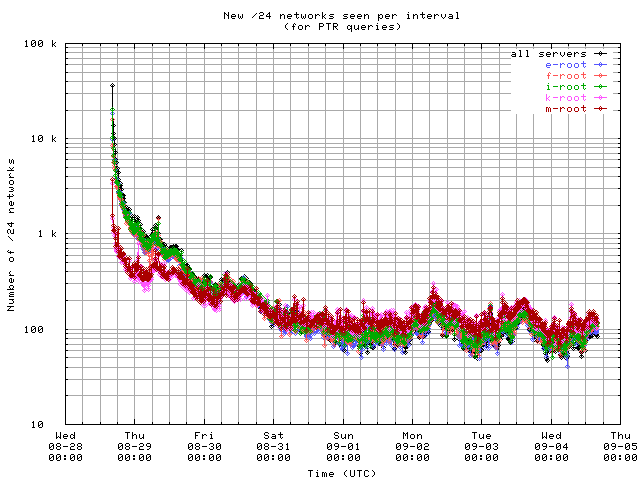
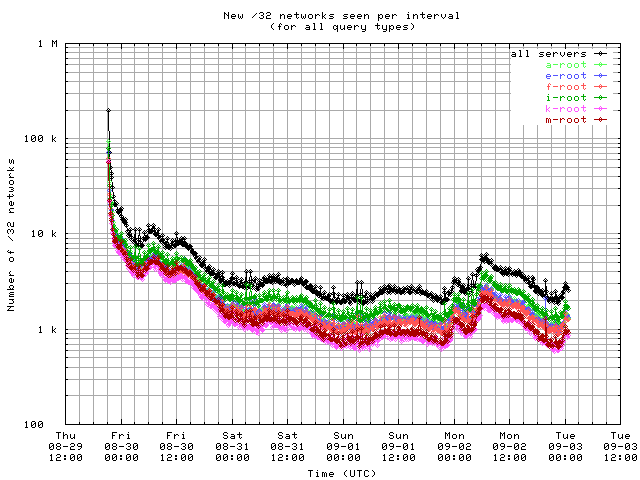
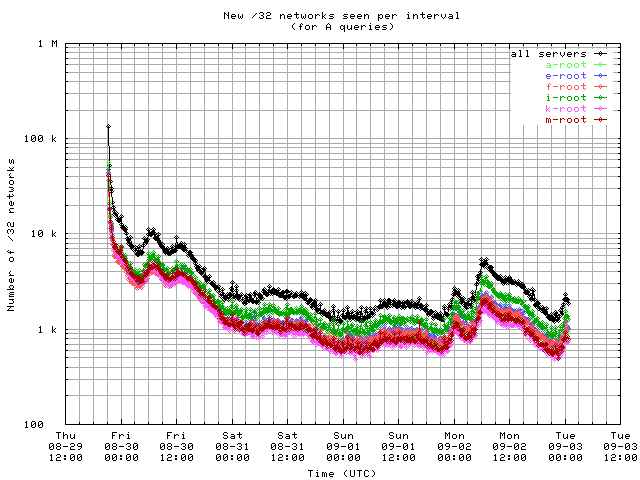
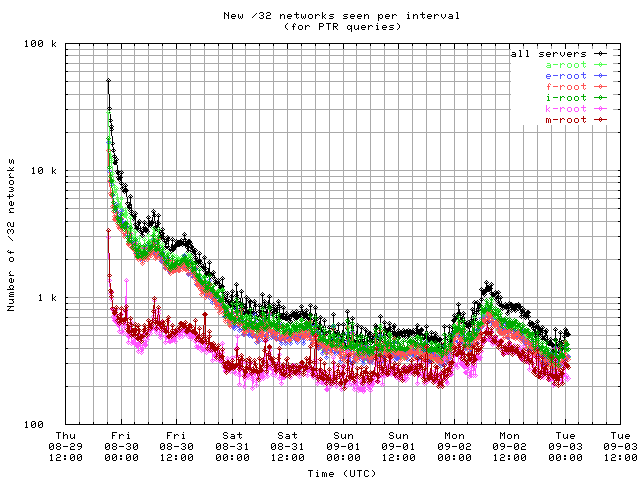
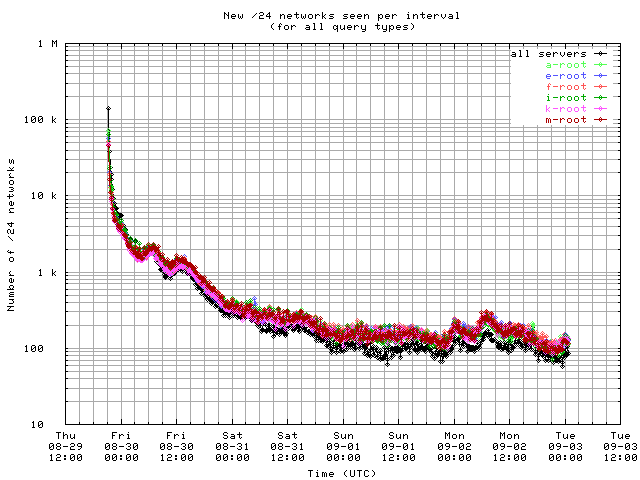
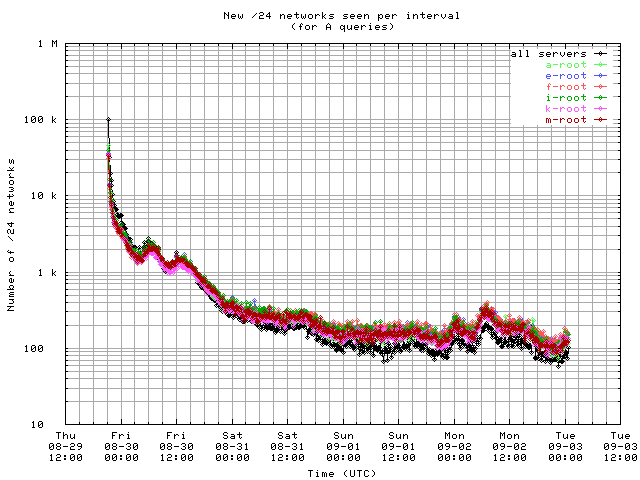
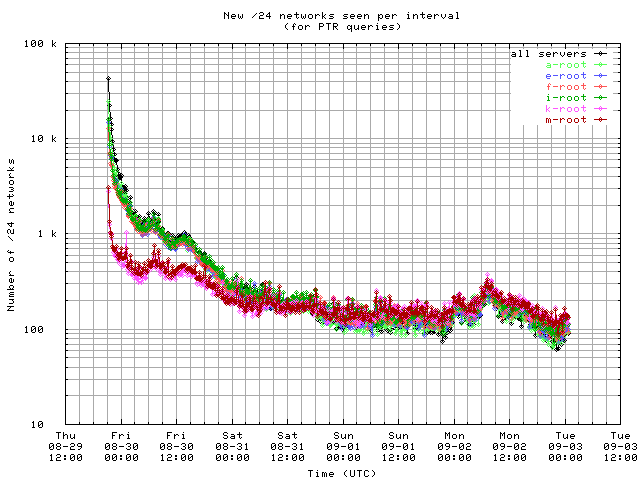
New clients per interval
These graphs show the number of new unique clients seen in each 10 minute interval by each server and by all servers combined; that is, clients that had not been seen in any previous interval.
Clients, for 7 days on {e,f,i,k,m}:
| 
| 
|
| 
| 
|
| 
| 
|
| 
| 
|
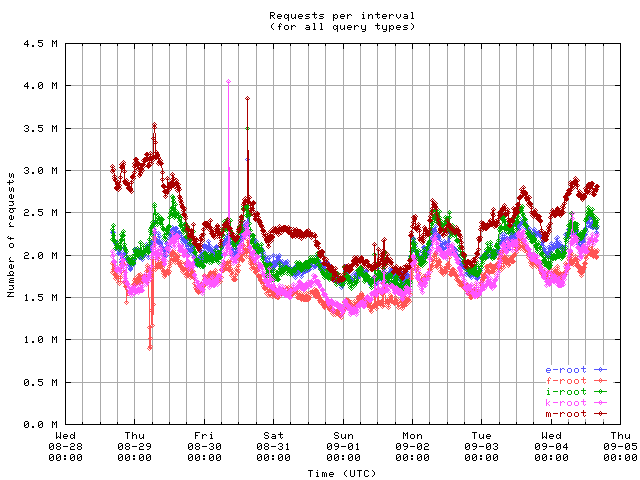
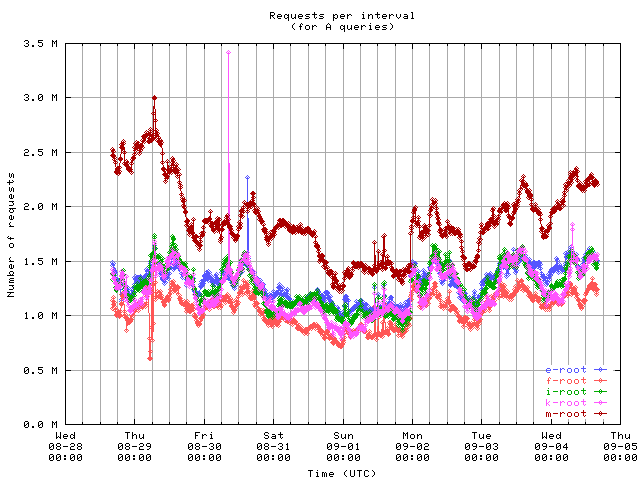
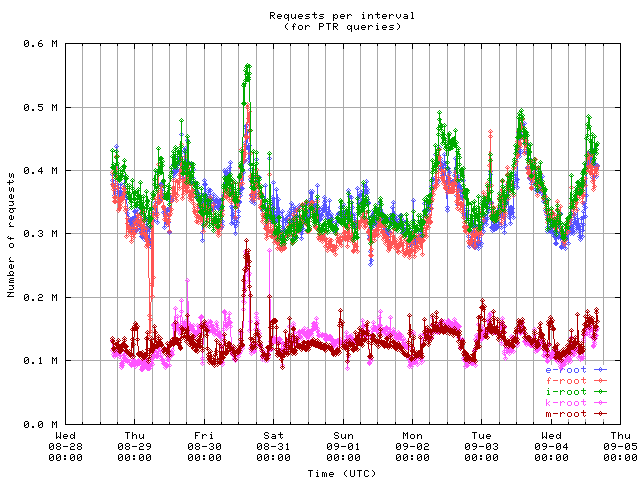
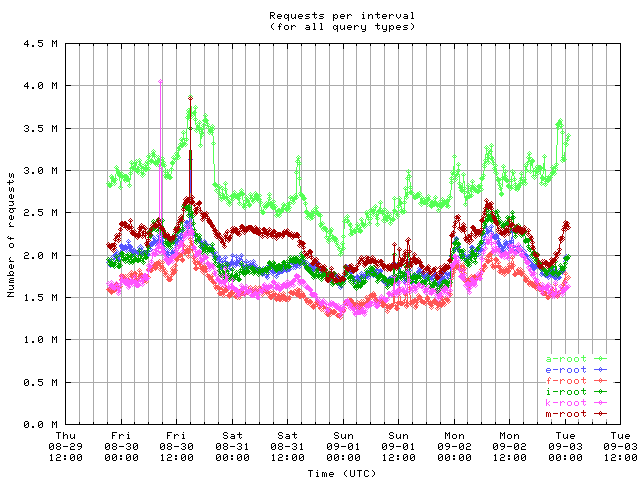
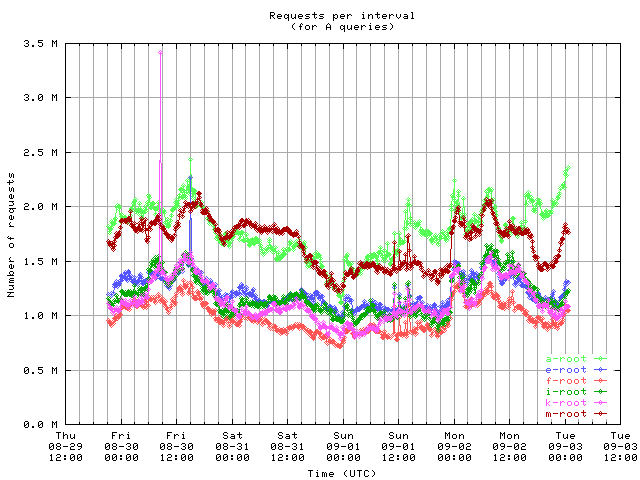
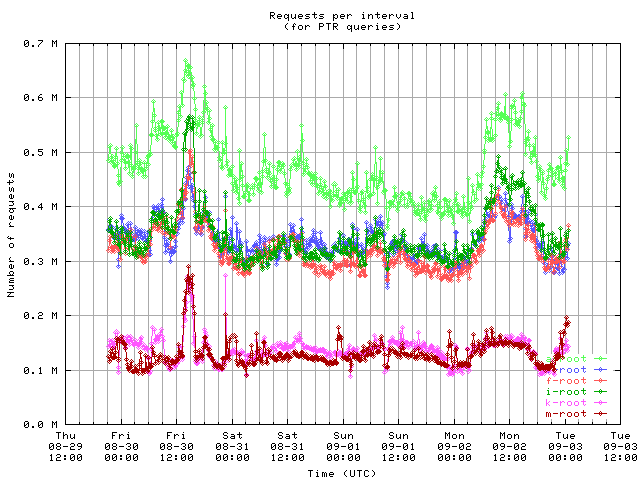
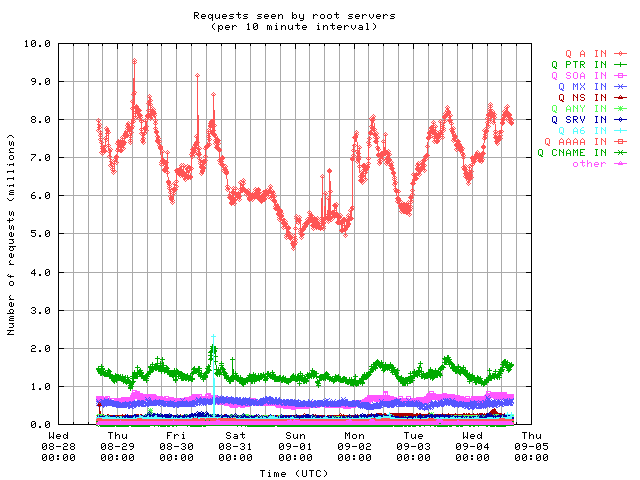
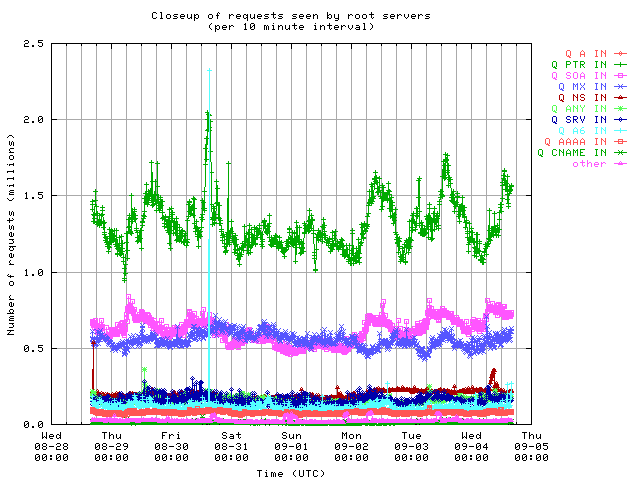
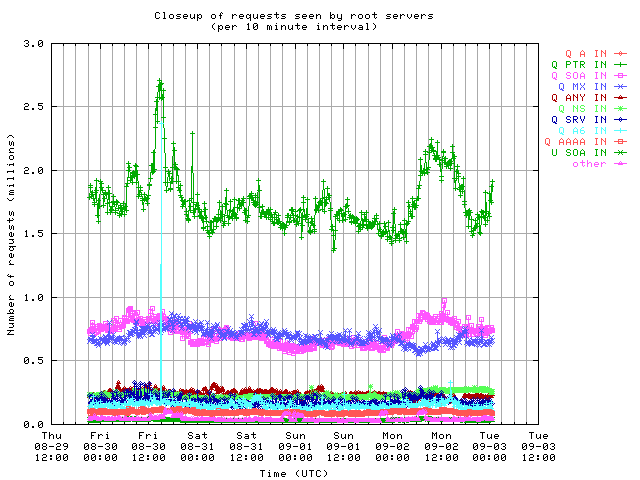
Requests per interval
These graphs show the number of queries seen by individual servers. Note that some clients byte-swap the 16-bit QDCOUNT field, so the value 1 is incorrectly written as 256. Queries in such messages are counted here even though they should probably be ignored, since the DNS server rejects these messages. At 08-30 08:30, there was a spike at k; 6.5 hours later, at 15:00, there was a spike at e, i and m. I haven't had a chance yet to investigate these spikes, but the fact that the second spike was observed at 3 independent monitors simultaneously implies it was real, and not a glitch in data collection.
7 days on {e,f,i,k,m}:
| 
| 
|
| 
| 
|
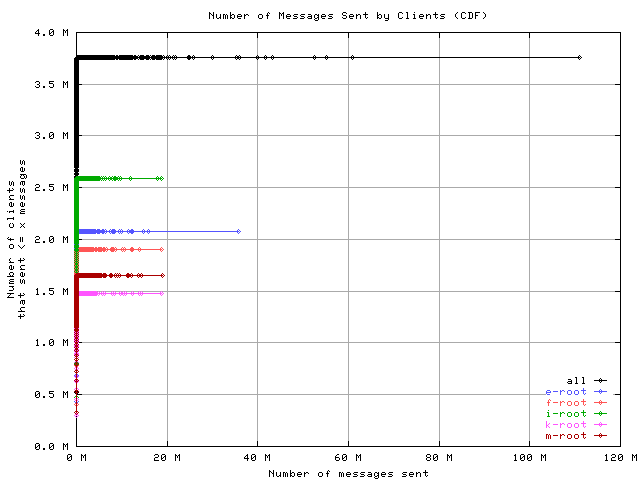
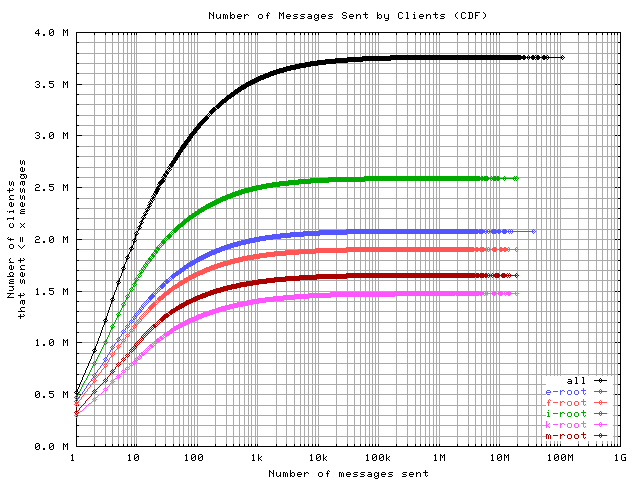
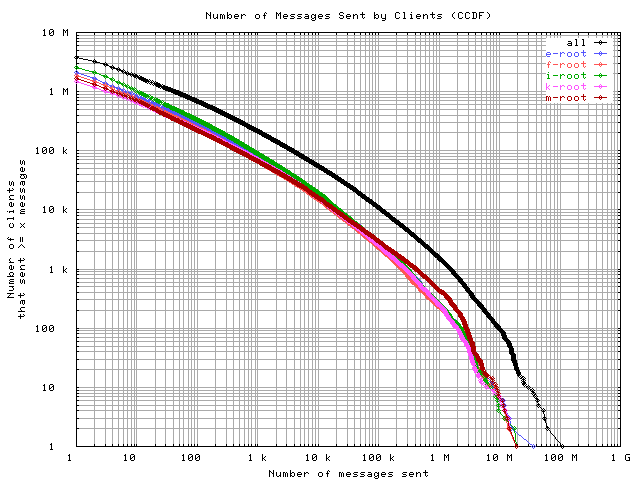
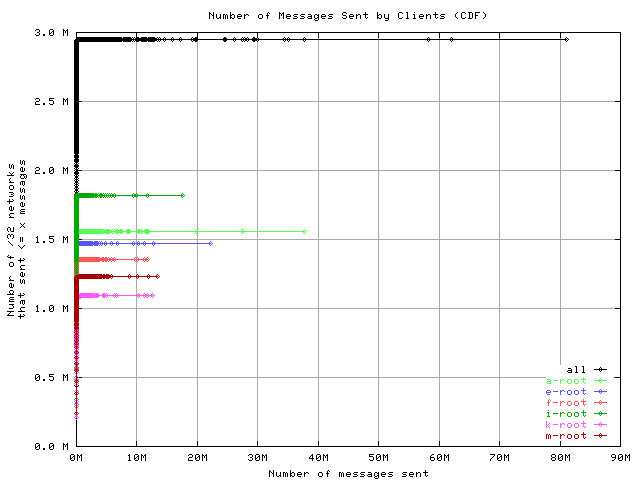
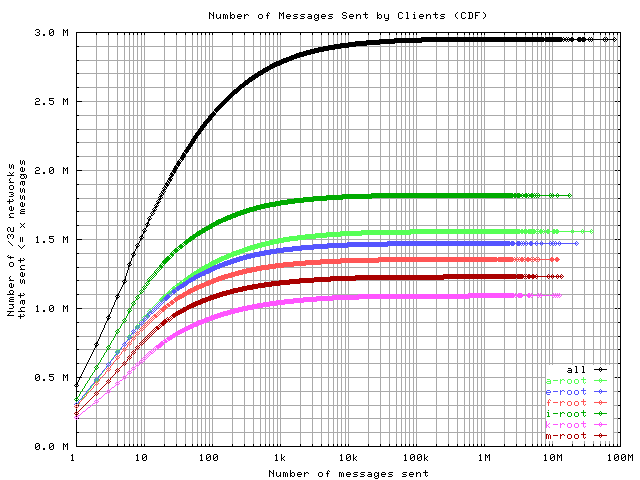
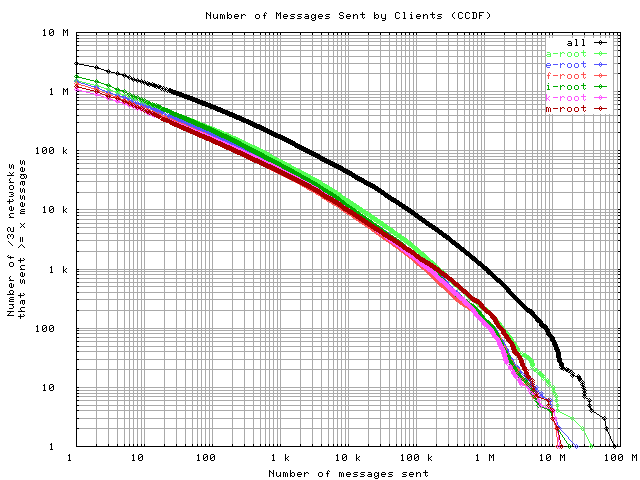
Number of requests sent by clients
These graphs show the CDF or CCDF of the number of request messages sent by clients to each server. With a logarithmic x-axis, we can see that over half the clients sent 8 or fewer messages.
7 days on {e,f,i,k,m}:
| 
| 
|
| 
| 
|
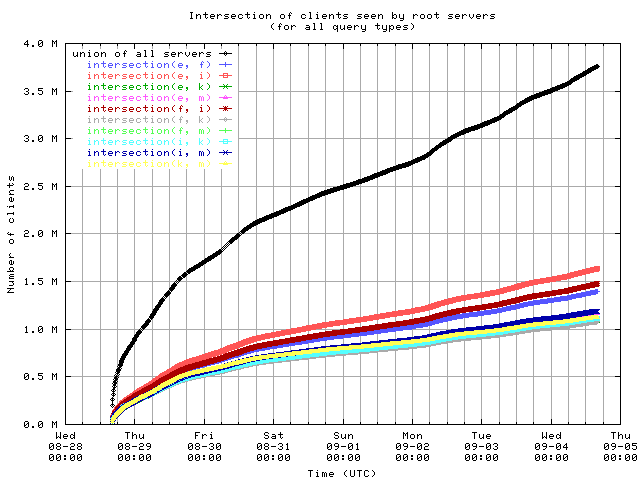
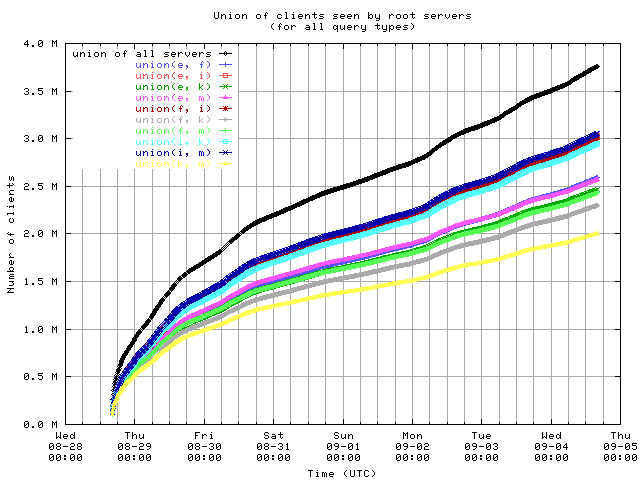
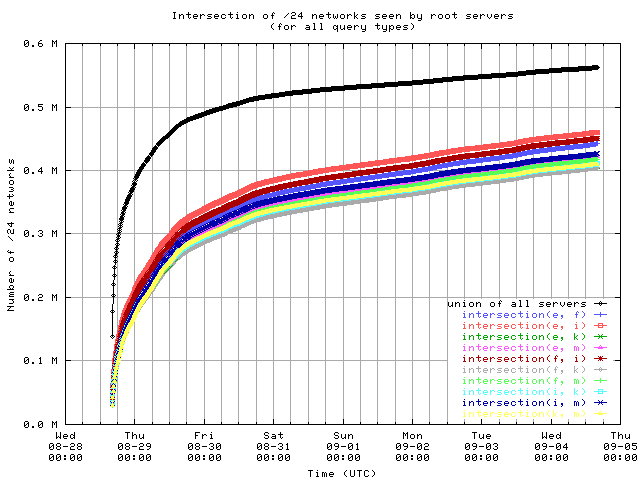
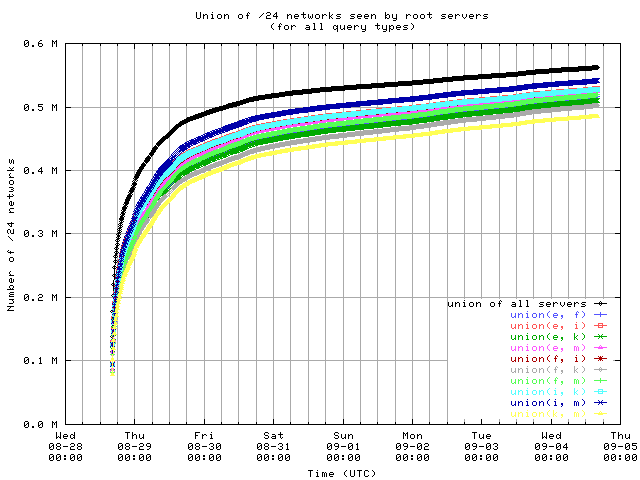
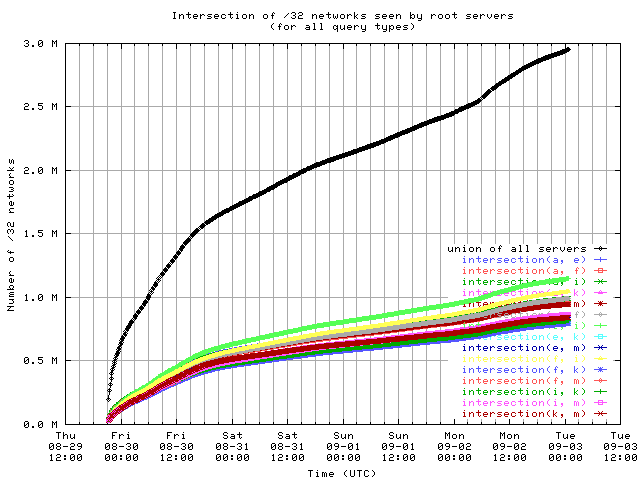
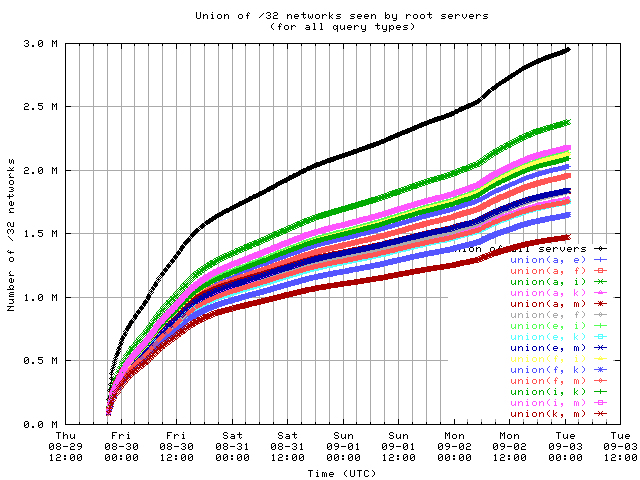
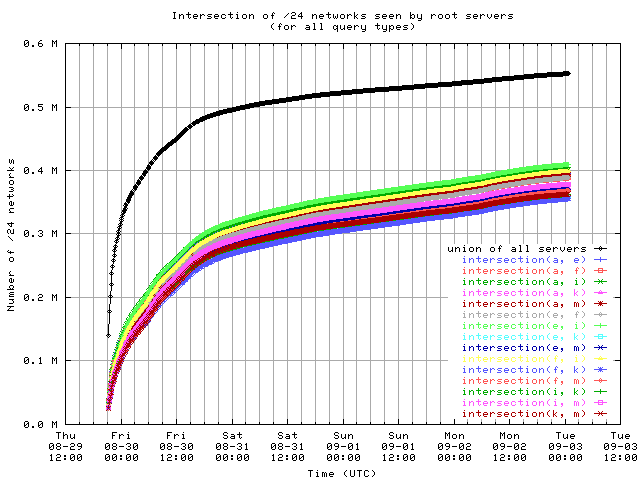
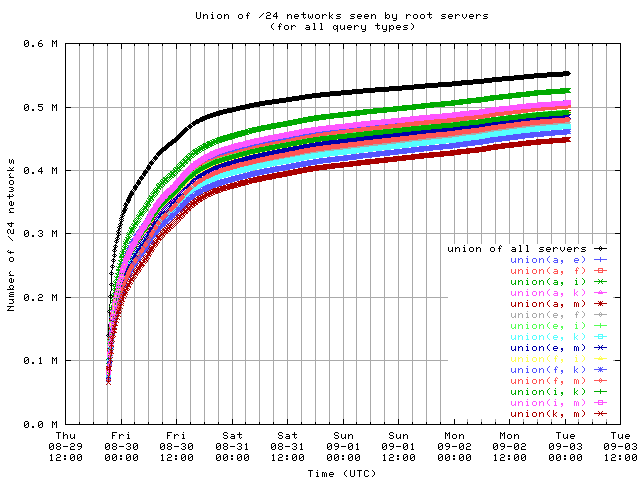
Overlap of client sets
Intersections and unions of client sets of pairs of root servers, with union of all servers for comparison.
Clients, for 7 days on {e,f,i,k,m}:
| 
|
| 
|
| 
|
| 
|
Request Opcodes, Types, and Classes
New 2002-10-01:opcode and class
Request opcodes, types, and classes seen at all monitored servers,
in full view and zoomed in.
"Unknown" includes all requests with a
non-standard opcode, type, or class;
"other" includes all sets that had counts lower than the count of the lowest
explicitly named sets.
Opcodes QUERY, IQUERY, STATUS, NOTIFY, UPDATE
are abbreviated to their first letter in the legends.
While the request count graphs above show that A-root gets about 1.3-2 times as much overall traffic as the other servers, the graphs and lists here show that A-root gets 80-100 times as much UPDATE SOA IN traffic as the others.
7 days on {e,f,i,k,m}:
New 2002-09-25:By server

| 
| 
|
4 days on {a,e,f,i,k,m}:
New 2002-09-25:By server
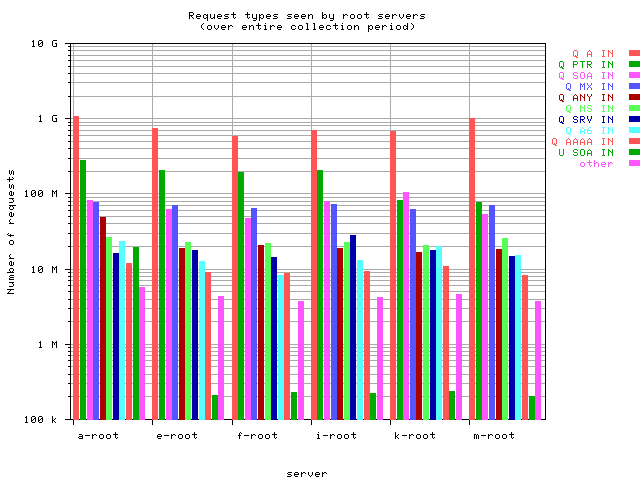
| 
| 
|
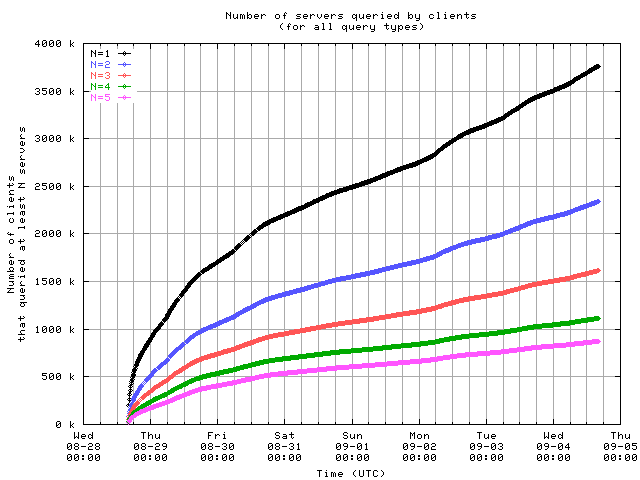
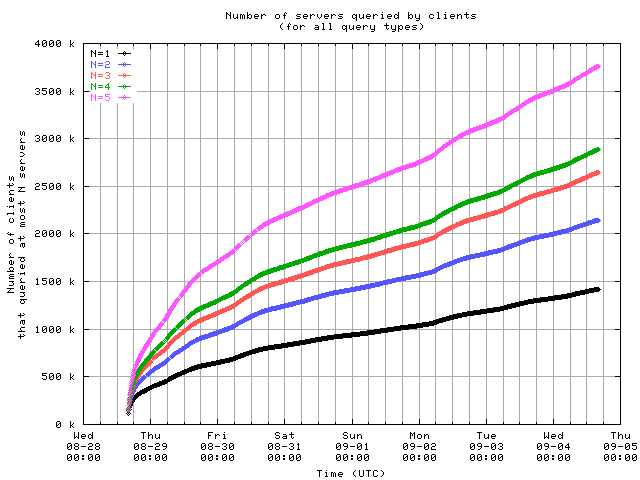
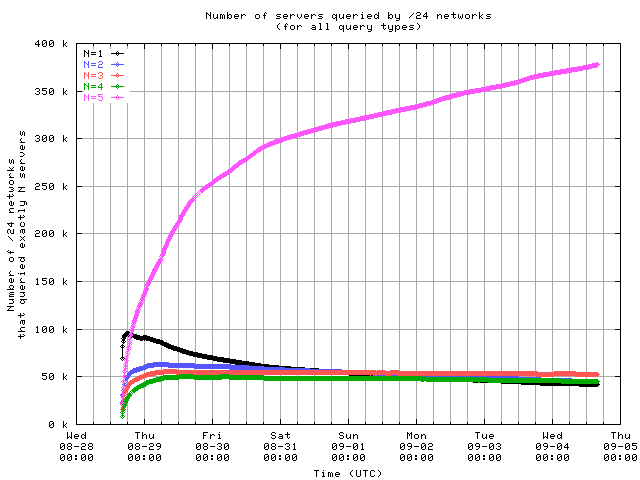
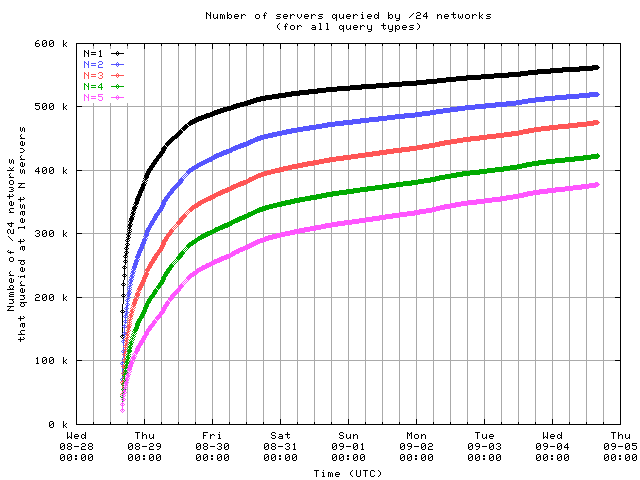
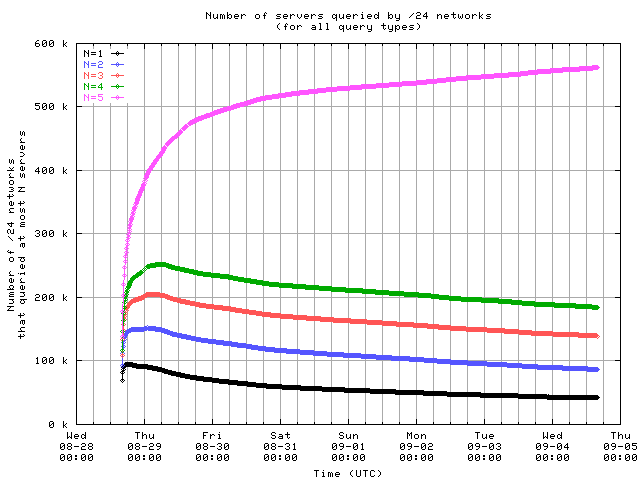
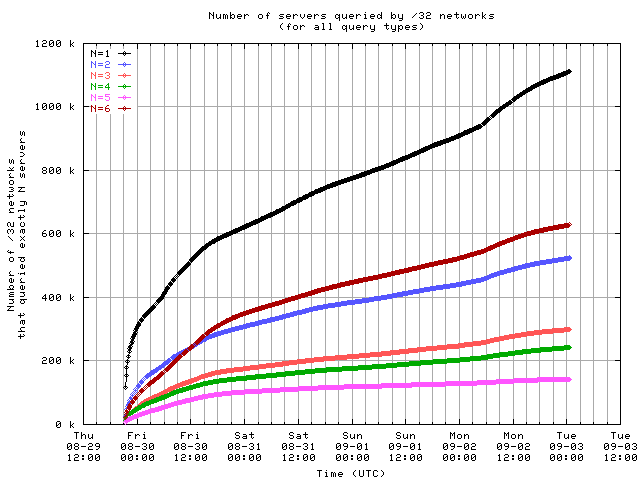
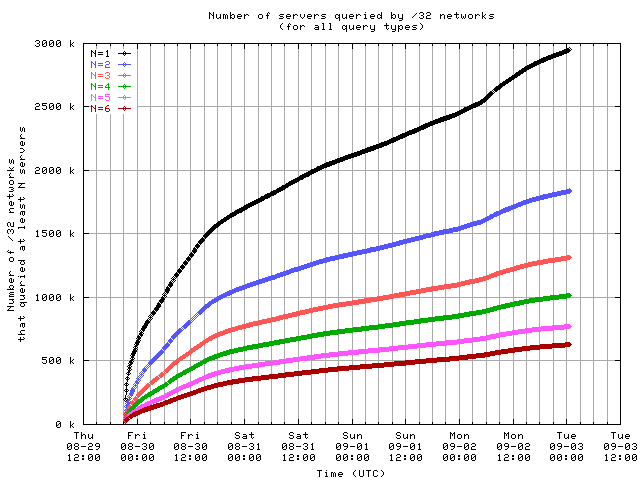
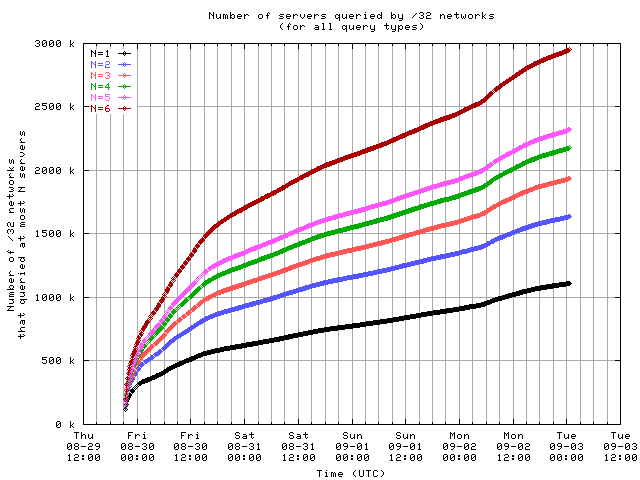
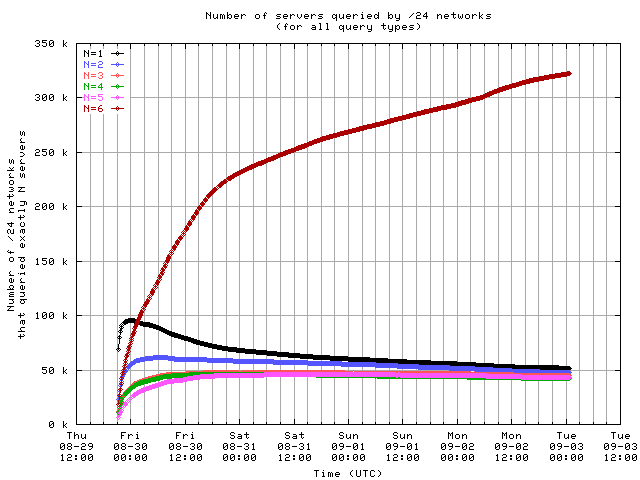
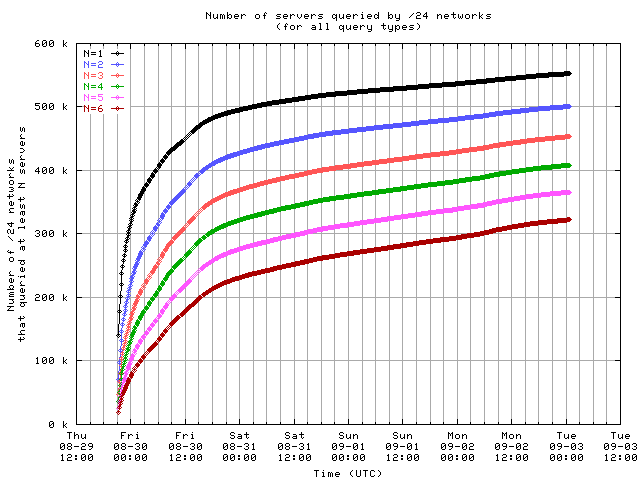
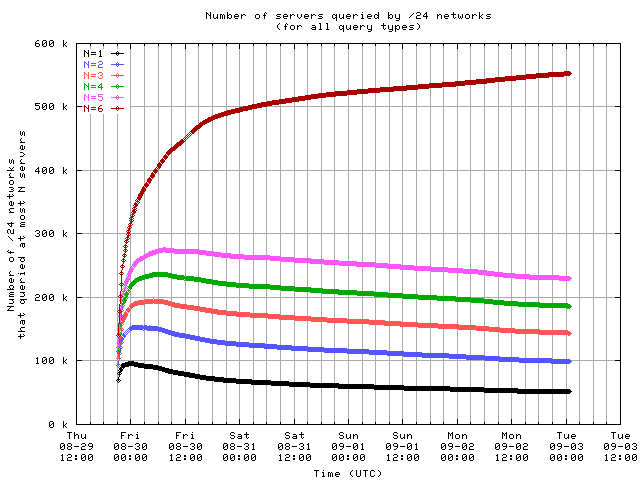
Number of servers queried by clients
Here is the number of clients which sent messages to a given number of servers. The /24 graphs show that most /24 networks sent messages to all monitored servers, suggesting that monitoring any one of those servers is sufficient to observe the existence of most /24 networks that make root server queries.
Clients, for 7 days on {e,f,i,k,m}:
| 
| 
|
| 
| 
|
| 
| 
|
| 
| 
|
-- Ken Keys