

Supplemental data: Analysis of a "/0" Stealth Scan from a Botnet
- UCSD Network Telescope Dataset on the Sipscan (January 2011 - February 2011)
Dataset
|
The Sipscan World Map (2m 03s):
.mp4 (35.8 MB) |
YouTube |
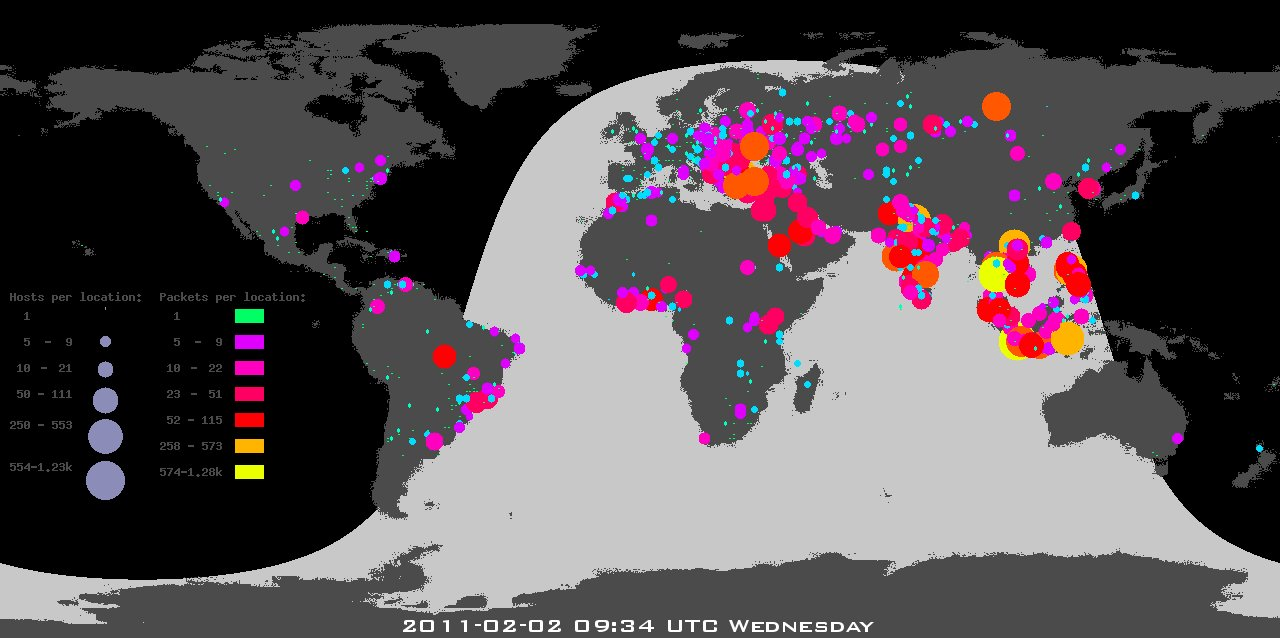
screenshot
The Sipscan World Map animation shows, with 5:20-minutes of data represented per frame, circles at the geographical coordinates of source hosts (bots) with size proportional to the number of hosts [MaxMind-]geolocated to those coordinates, and color to the number of packets sent. The animation depicts the spatial and temporal dynamics of the scan. |

|
Sipscan Target Progression in Standard Byte Order (2m 03s):
.mp4 (40.1 MB) |
YouTube |
screenshot
The animation of the sipscan target progression in standard byte order represents the progression over time of the actual IP addresses targeted by the sipscan. The darknet address space is represented as a Hilbert curve of order 12. Drawing the Hilbert curve using IP addresses sequenced in their natural byte order does not reveal a particular pattern in the target progression, showing the square uniformly filling across the 12 days of the scan. |
|
Sipscan Target Progression in Reversed Byte Order (2m 03s):
.mp4 (21.0 MB) |
YouTube |
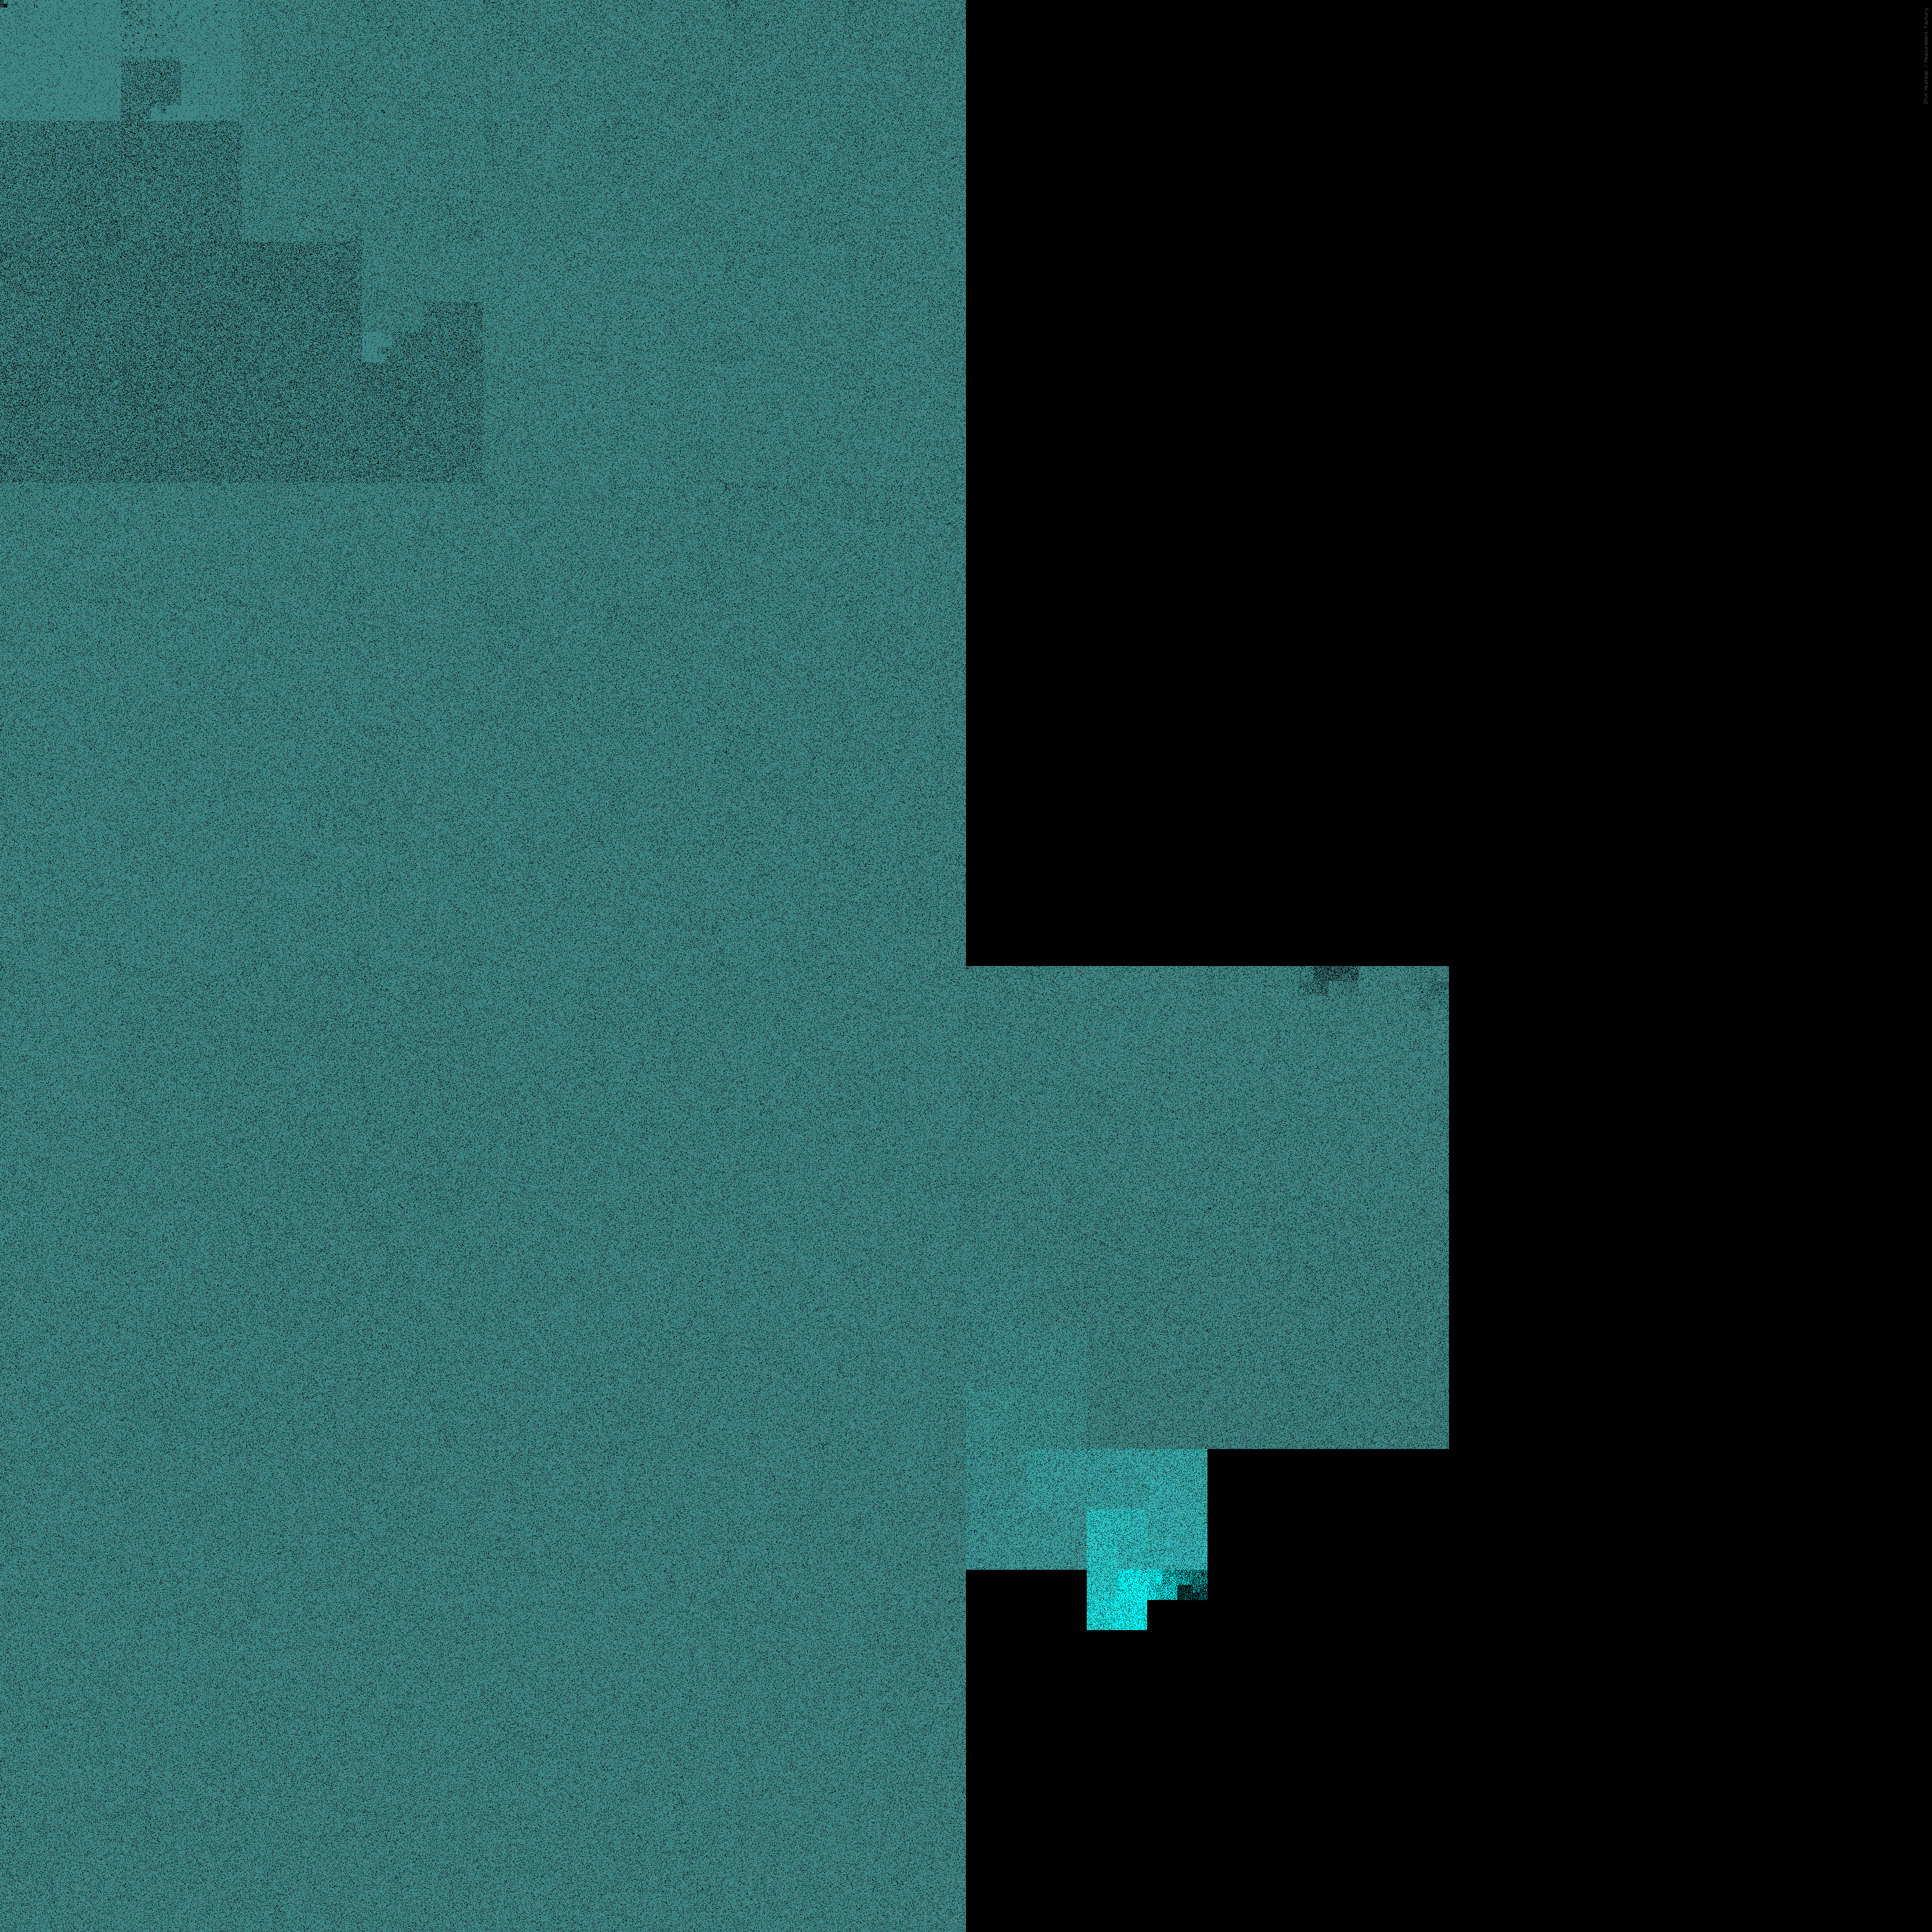
screenshot
The animation of the sipscan target progression in reversed byte order represents the progression over time of the IP addresses targeted by the sipscan. The darknet address space is represented as a Hilbert curve of order 12 in which the order of the three least significant bytes of each address is reversed before mapping it into the curve. Highlighted pixels correspond to IP addresses that have been probed up to that time (5 Feb 2011 11:47 GMT, in this frame). The animation proves the reverse-byte order progression is rigorously followed by the bots during the entire 12 days, independent of the varying rate of the sipscan. |
|
Sipscan Composite (2m 03s):
.mp4 (40.3 MB) |
YouTube |
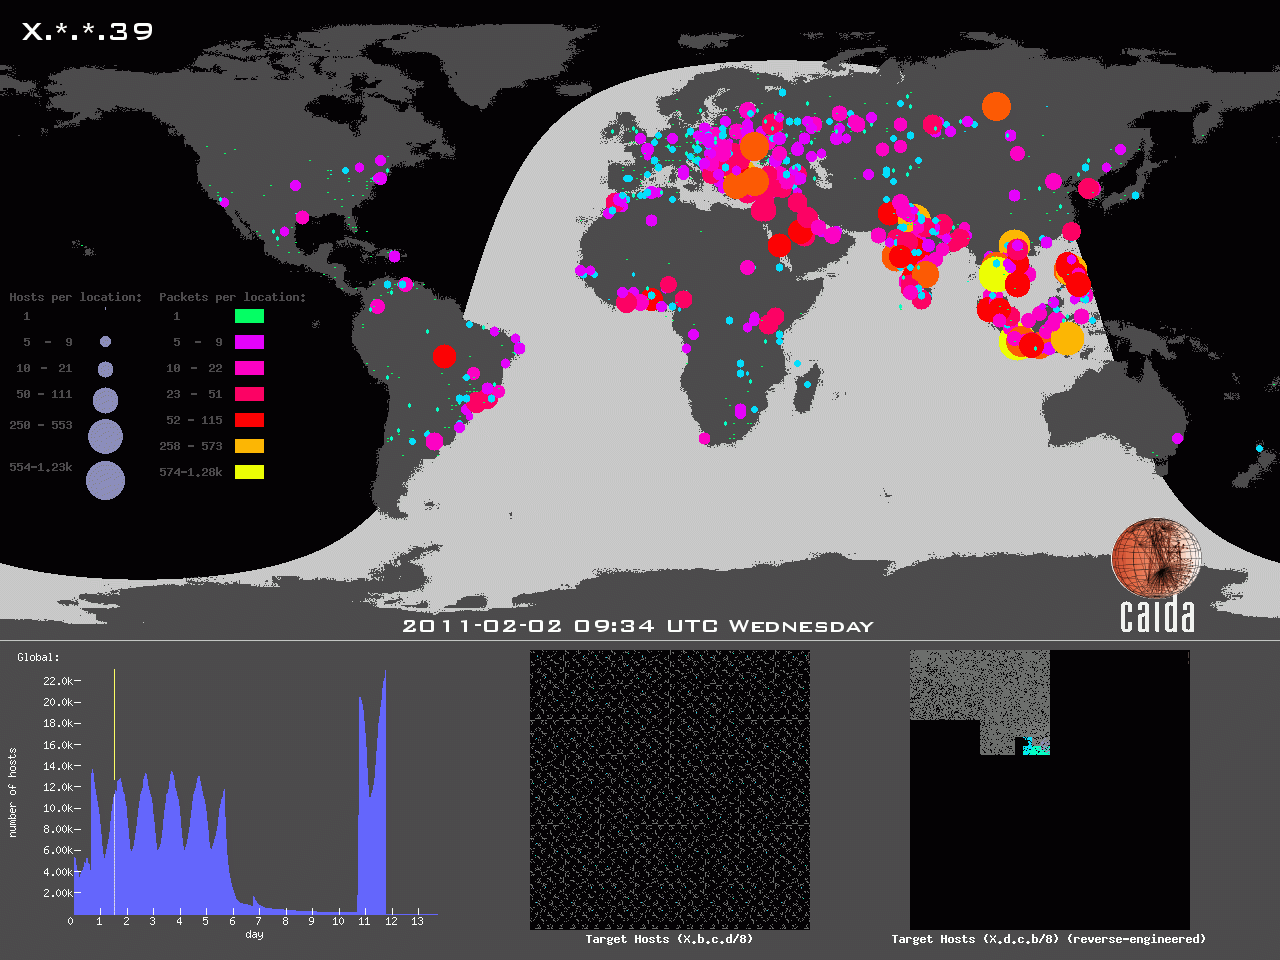
screenshot
The sipscan composite animation combines the world map animation, standard byte ordered target progression animation, and the reversed byte order animation into a single, synchronized video. This allows an immediate comparison between the geographical dynamics of the bots and the progression of the IP addresses across the duration of the scan. |