

The contents of this legacy page are no longer maintained nor supported, and are made available only for historical purposes.
Walrus - Gallery: Visualization & Navigation
These screenshots and animations are simply intended to give a feel for
what visualization and navigation in Walrus are like. The data shown are
not necessarily meaningful in themselves.
Click on a thumbnail for the larger version.
Skitter Monitors
champagne (9,175 nodes and 15,519 links)
![[img]](champ2.png)
riesling (54,893 nodes and 79,409 links)
![[img]](ries-t5.png)
![[img]](ries-t.png)
![[img]](ries-t-b.png)
![[img]](ries-t-c.png)
![[img]](ries-t2.png)
lhr (535,102 nodes and 601,678 links)
![[img]](lhr-old.png)
![[img]](lhr-nt2.png)
![[img]](lhr-nt3.png)
![[img]](lhr-t3.png)
CVS Repository (18,474 nodes and 18,473 links)
![[img]](cvs2.png)
![[img]](cvs3.png)
![[img]](cvs6.png)
Various Directory Trees
![[img]](lar-gr-l-1.png)
![[img]](lar-gr-l-13.png)
![[img]](lar-gr-l-7.png)
![[img]](med-gr-l-4.png)
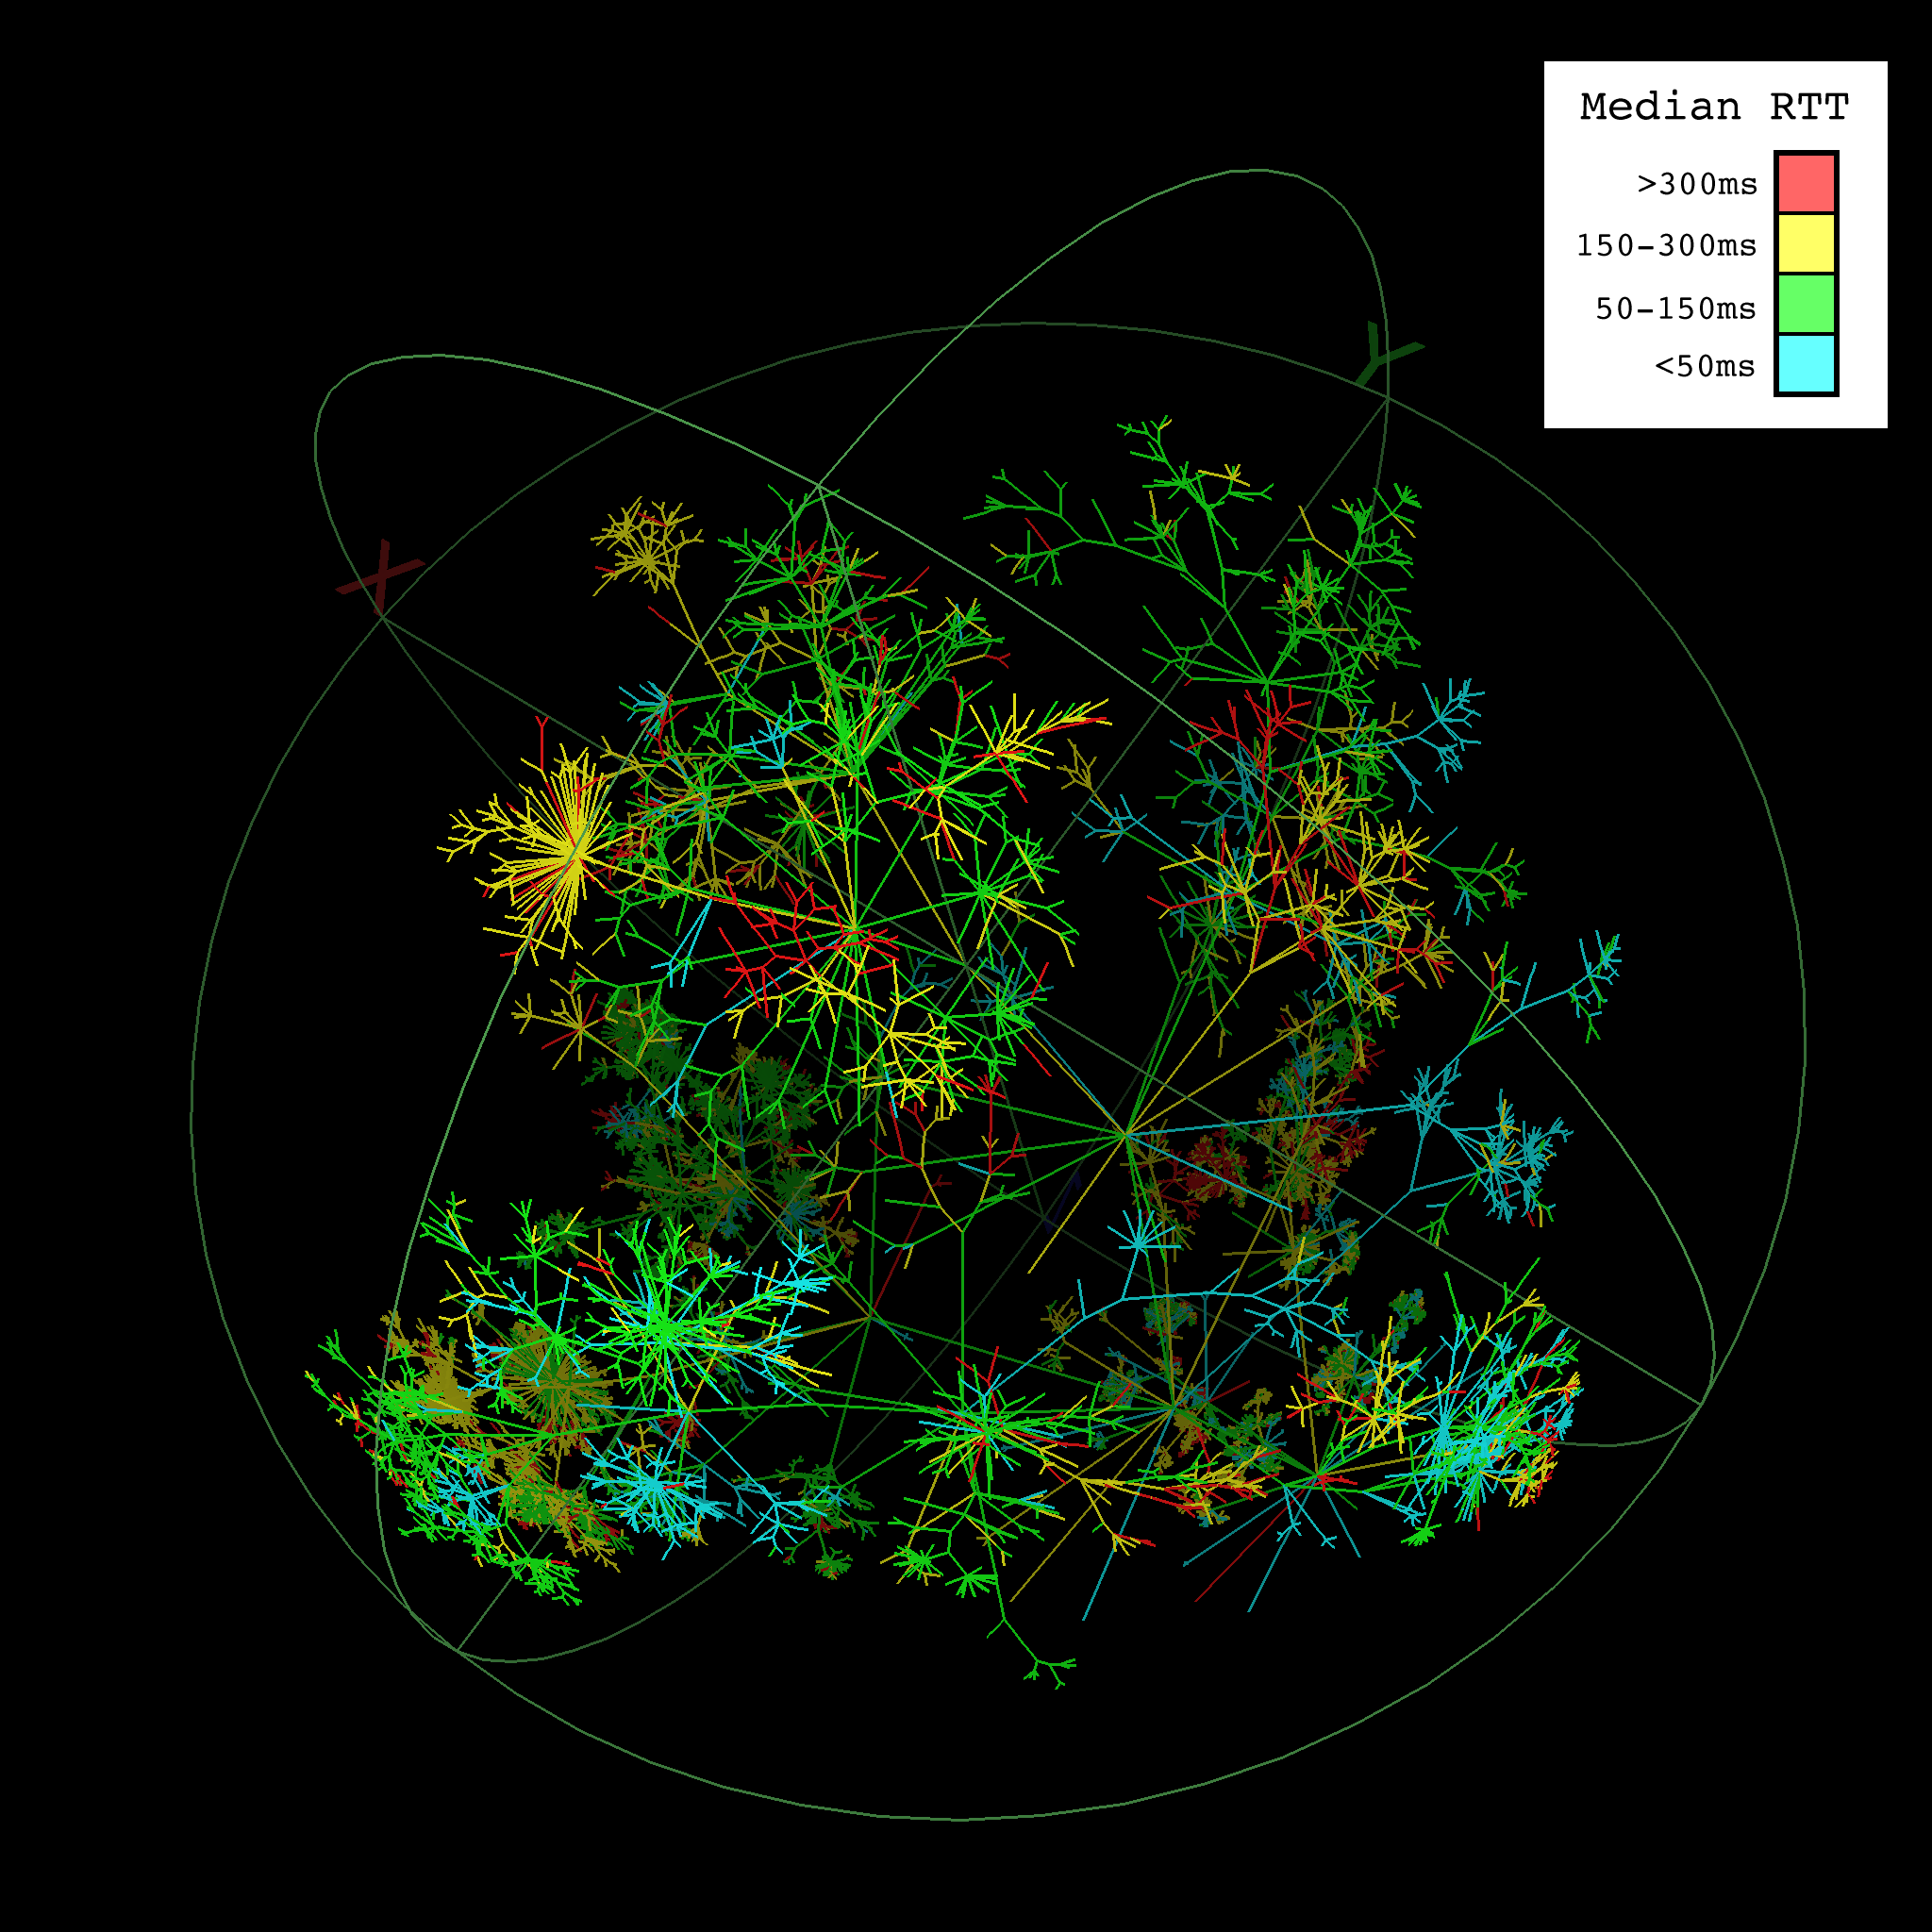
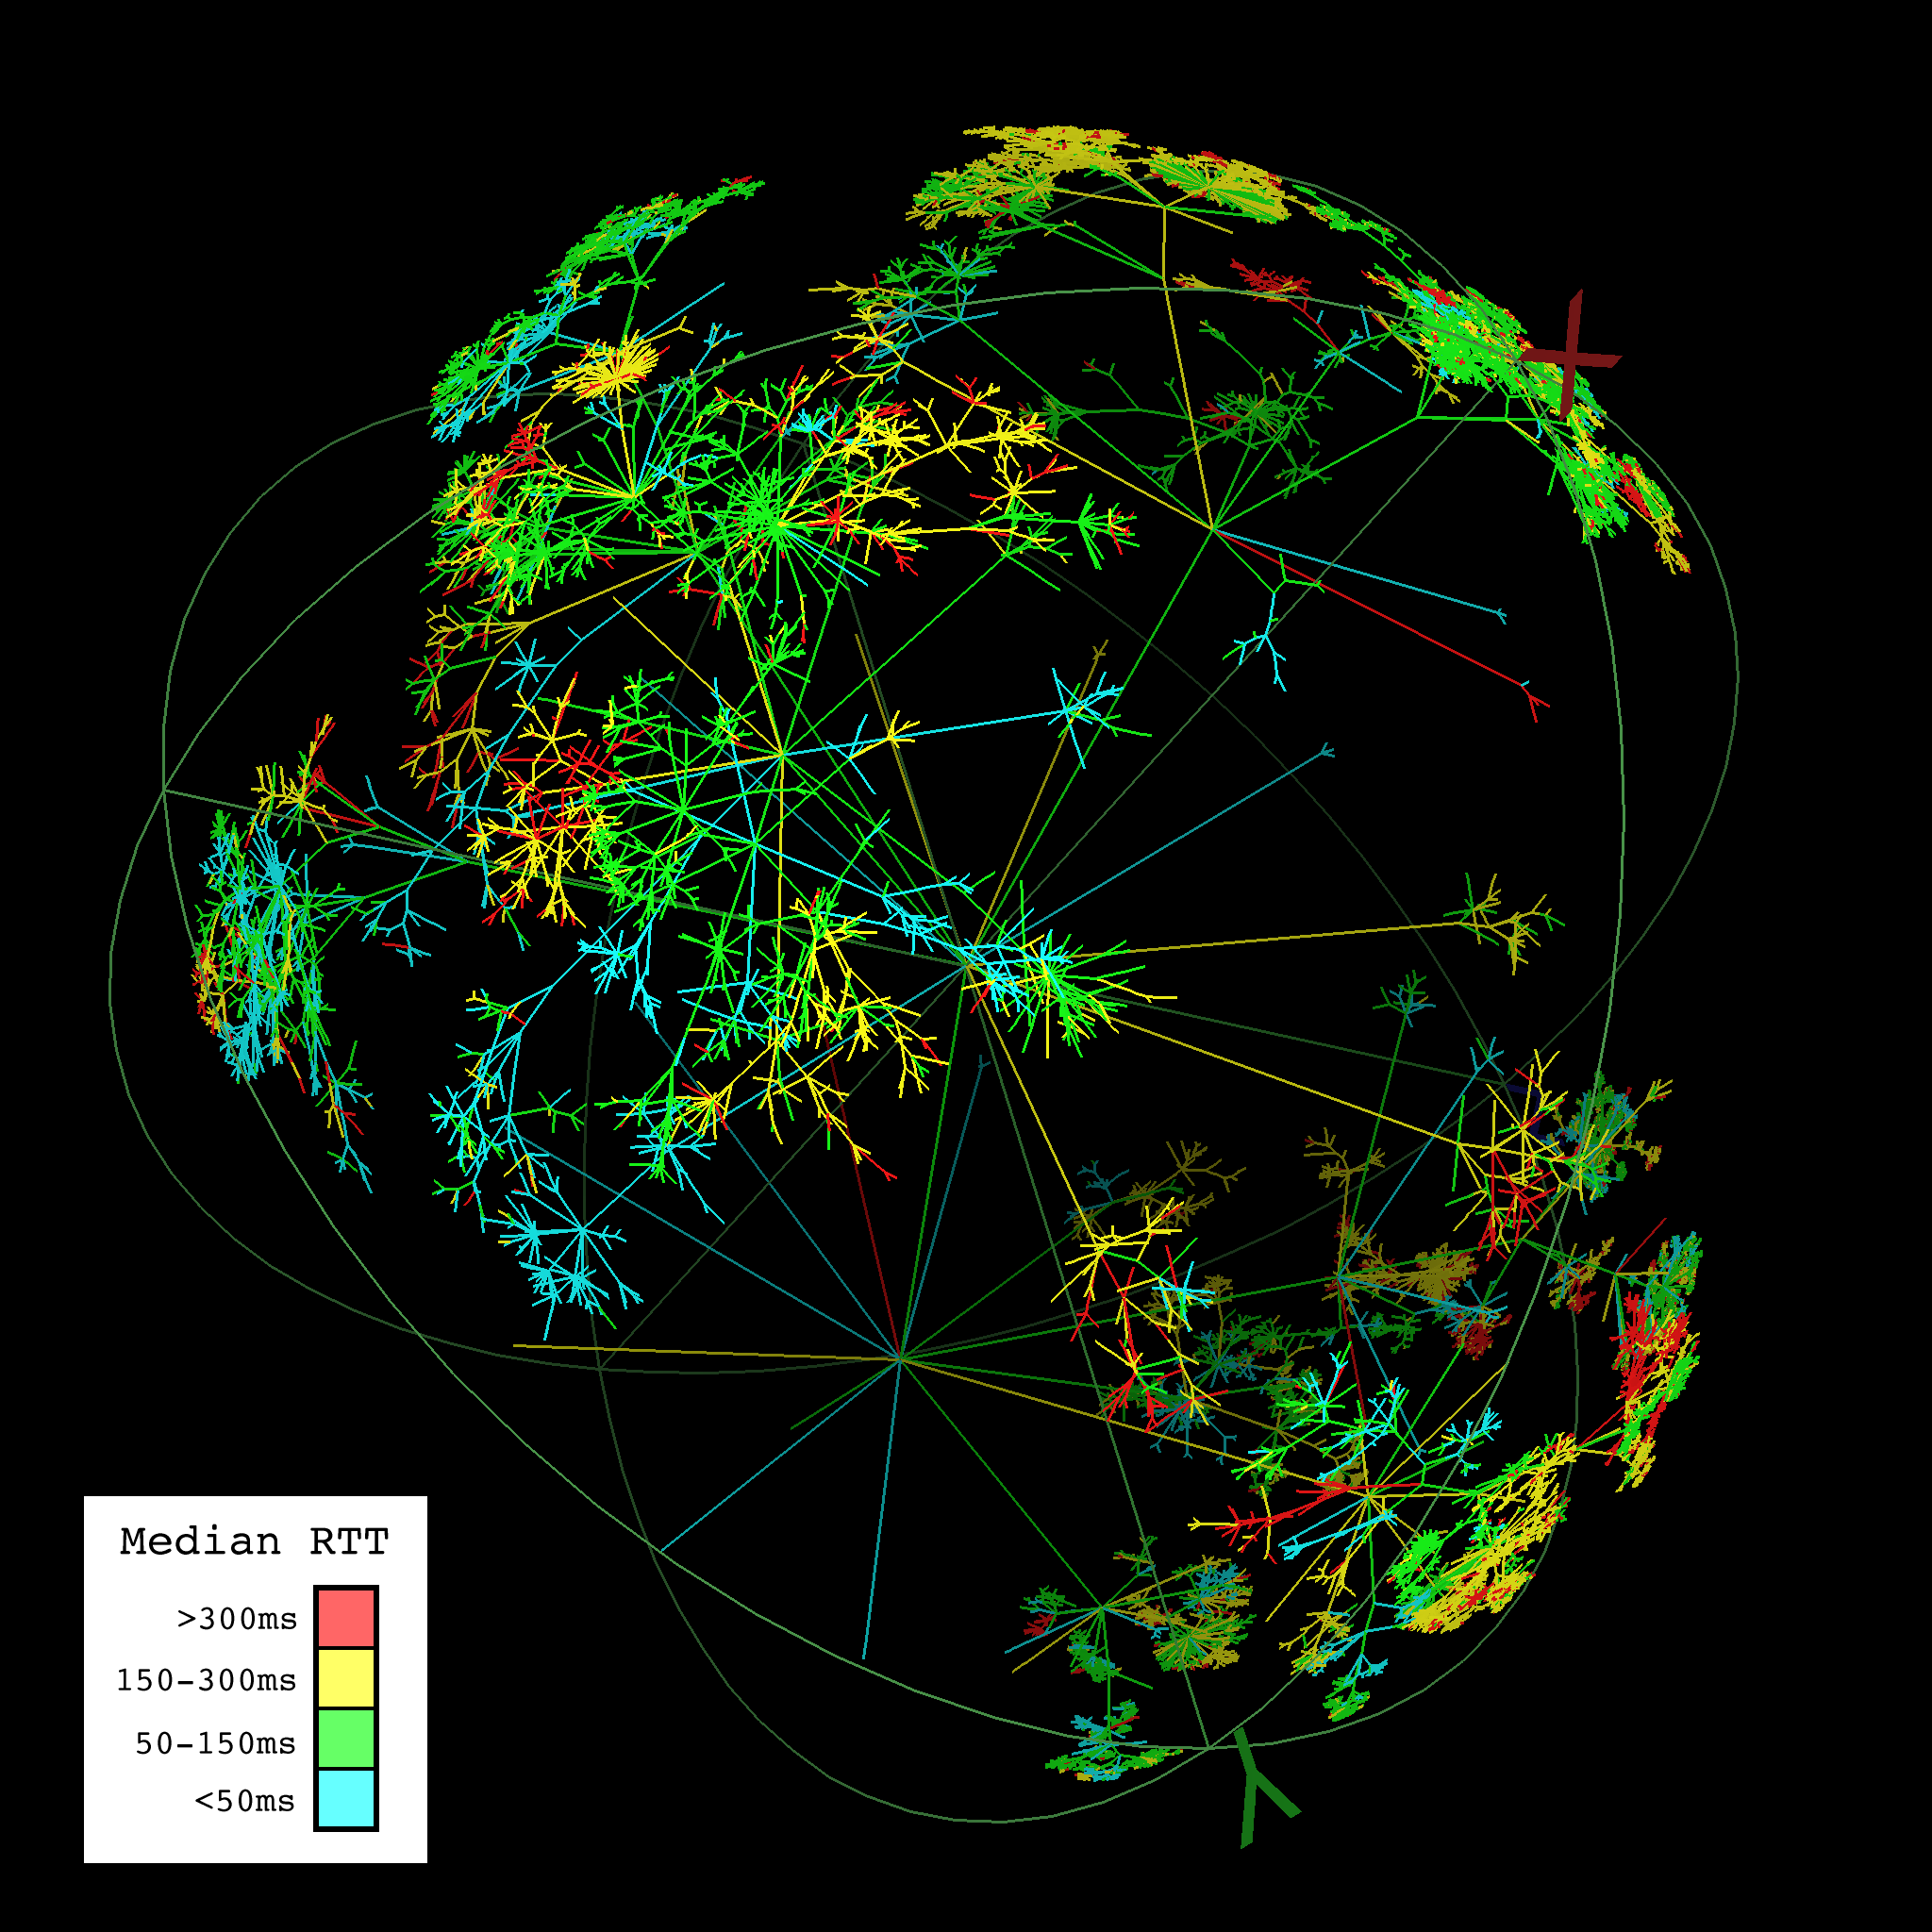
Round-Trip Time Measurements (63,631 nodes and 63,630 links)
A description of this data is available.
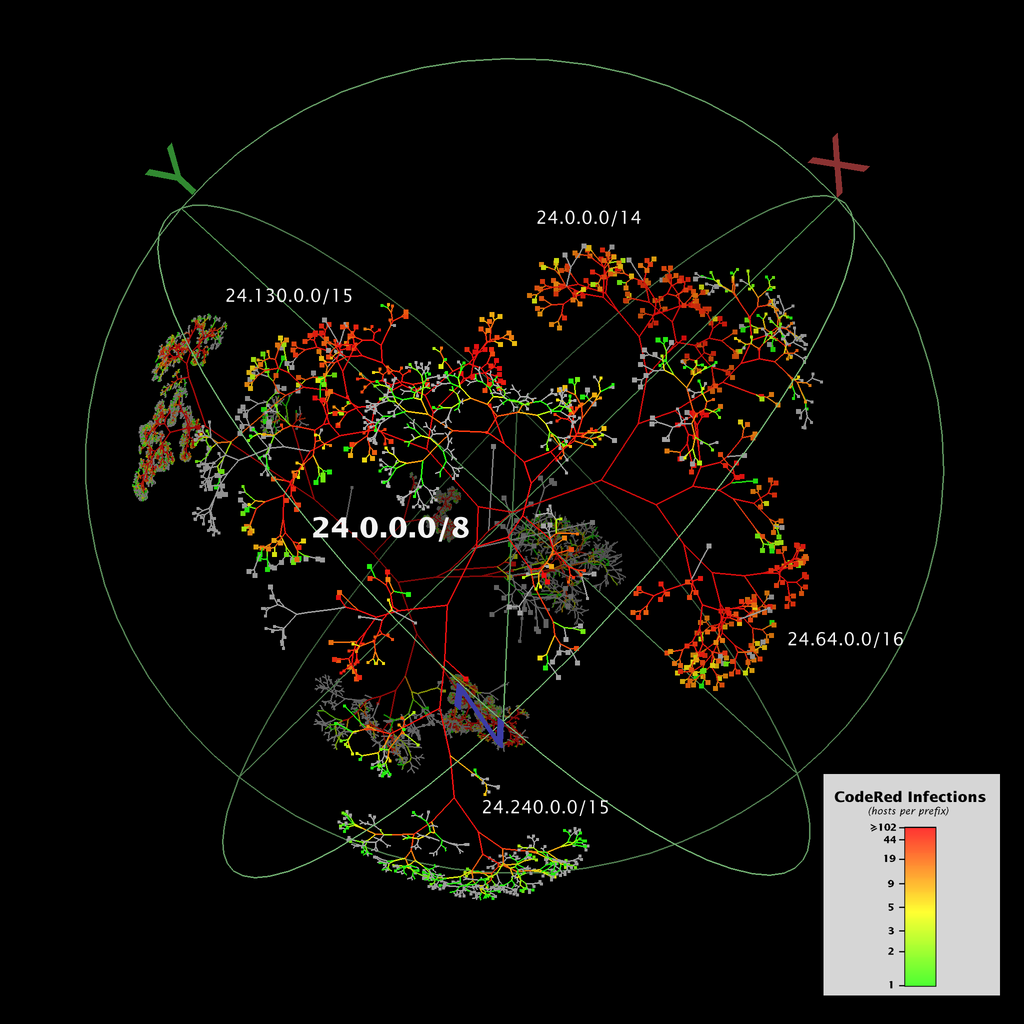
CodeRed Infections (321,986 nodes and 321,985 links)
A description of this data is available.
Animations
These animated GIFs show graph navigation in Walrus. Click on a thumbnail to load.
![[img]](wobble.gif) The CVS repository. [1.0MB]
The CVS repository. [1.0MB]
![[img]](lhr-anim.gif) The lhr skitter monitor. [3.0MB]
The lhr skitter monitor. [3.0MB]
![[img]](ries-anim.gif) The riesling skitter monitor. [3.7MB]
The riesling skitter monitor. [3.7MB]
![[img]](ries2-anim.gif) The riesling skitter monitor. [5.0MB]
The riesling skitter monitor. [5.0MB]
![[img]](xmas-snow2.gif) [Warning: 32.5MB]
[Warning: 32.5MB]
![[img]](xmas3.gif) [Warning: 15.4MB]
[Warning: 15.4MB]