

IPv6 AS Core: Visualizing IPv6 Internet Topology at a Macroscopic Scale in 2008
The current Internet network layer protocol - Internet Protocol version 4 (IPv4) - has been strained by the rapid growth of the Internet. Many regions of the world are beginning to transition from IPv4 to Internet Protocol version 6 (IPv6) to support the global need for a larger number of publicly accessible Internet addresses. The transition has been underway since 1997, with the IPv6 Internet coexisting with the IPv4 Internet.
Since 2000, CAIDA has generated AS Core graphs -- Internet Topology Maps also referred to as AS-level Internet Graphs -- in order to visualize the shifting topology of the Internet over time, as can be seen in the historical view.
Below, we present a visualization of a sample snapshot of AS-level IPv6 topology observed during the interval January 2-8, 2008.
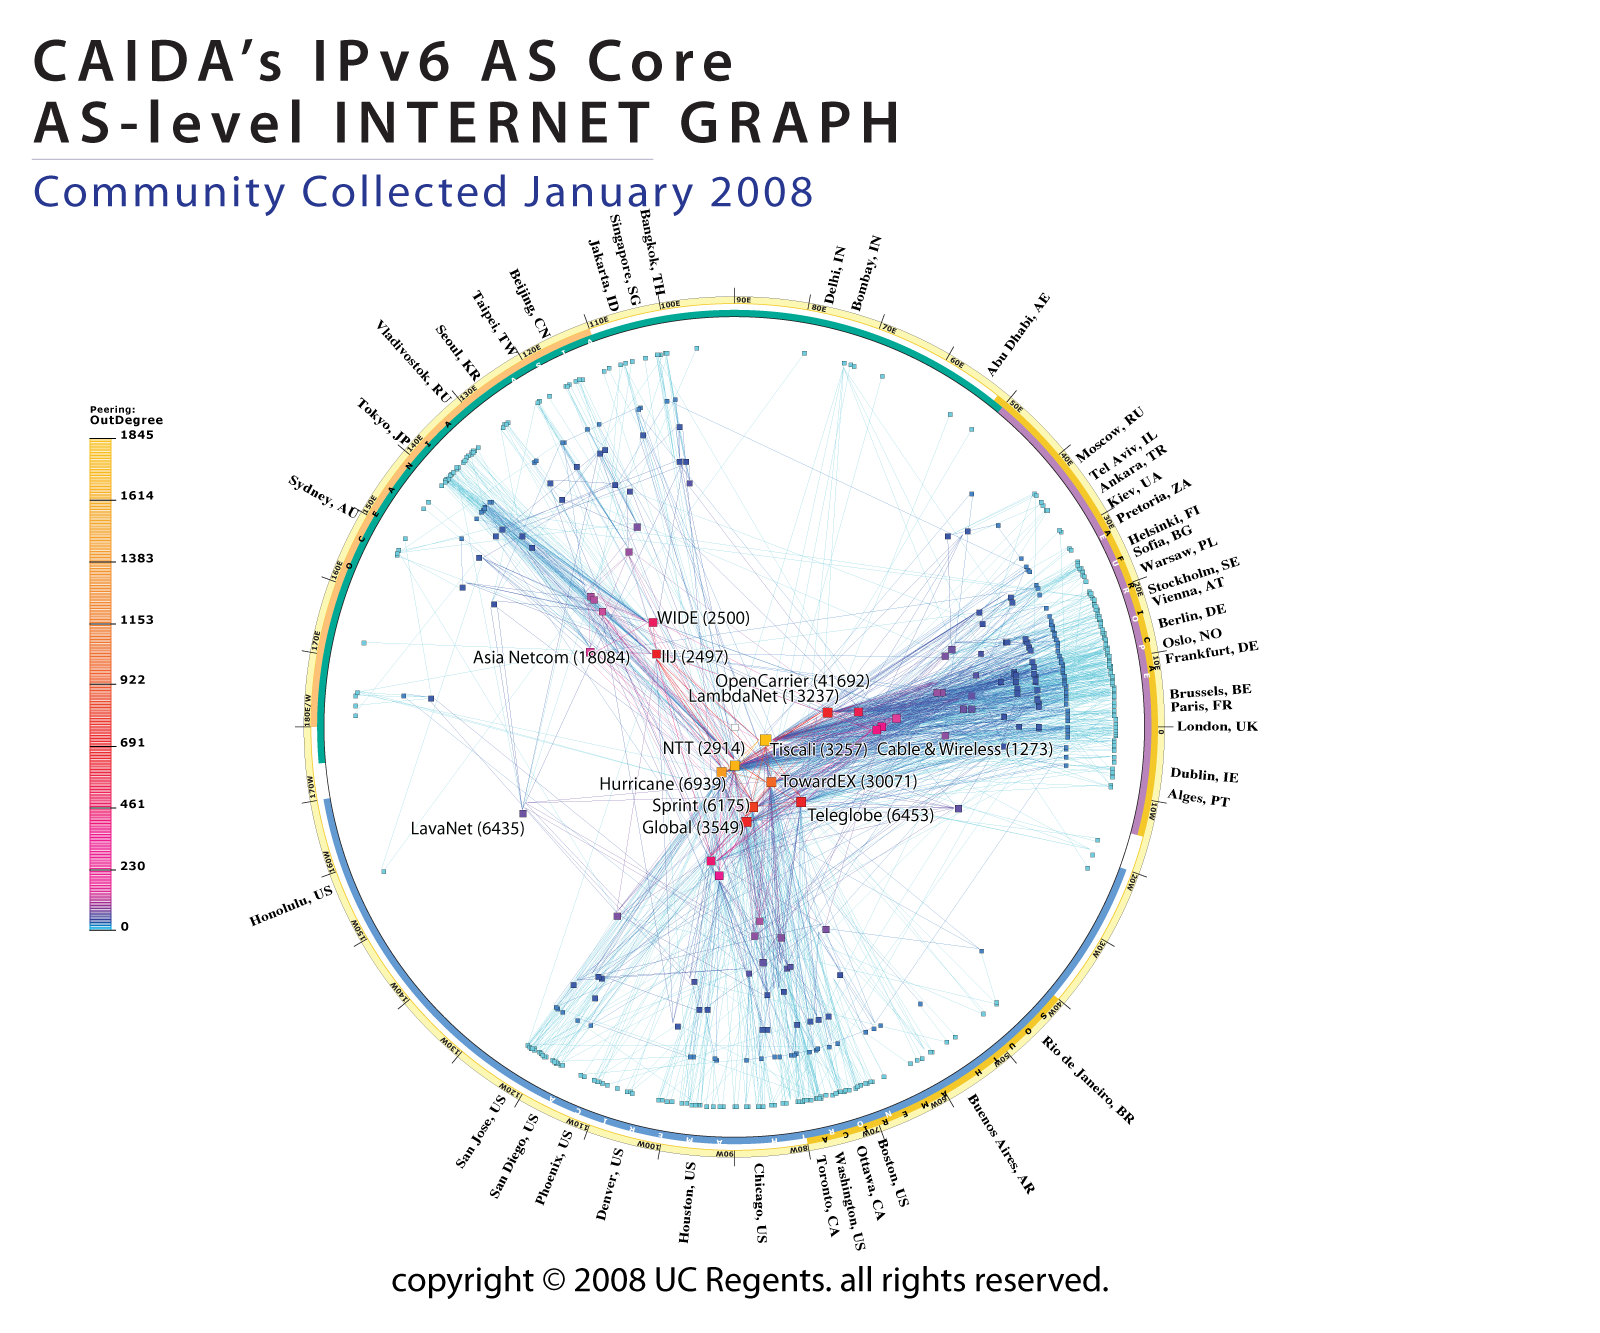
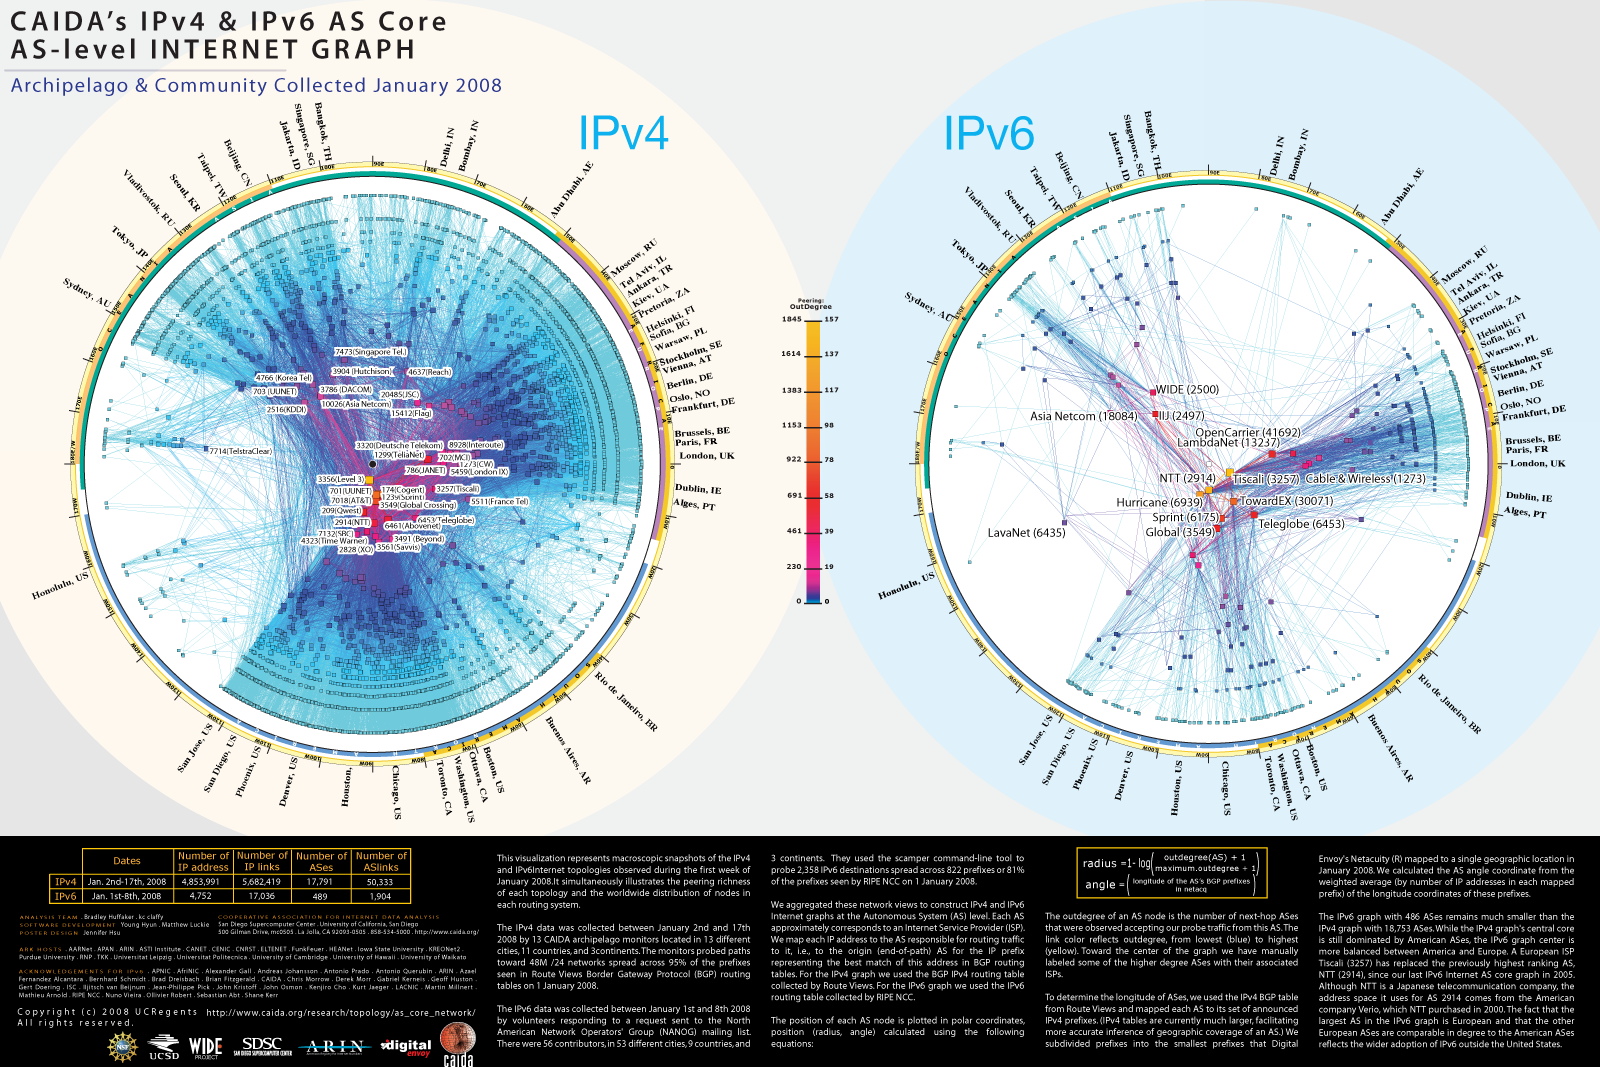
Figure 1. A snapshot of the Internet BGP-speaking AS core derived from scamper IPv6 topology probing in the first week of January 2008.
Poster version can be found below. Suitable for printing.
Data
This visualization represents a macroscopic snapshot of the IPv6 Internet topology collected during the first week of January 2008. Topology data was collected with scamper by volunteers responding to a request sent to the North American Network Operators' Group (NANOG) mailing list. There were 56 contributors in 53 different cities, in 9 countries, and 3 continents. The snapshot reflects measurements from a total of 97 different IPv6 source addresses from 68 unique IPv6 prefixes and Autonomous Systems (ASes). The resulting IPv6 level graph contains 4,752 IPv6 addresses and 526 IPv6 prefixes.
We aggregated this view of the network into a topology of ASes. Each AS approximately corresponds to an Internet Service Provider (ISP). We map each IPv6 address to the AS responsible for routing traffic to it, i.e., to the origin (end-of-path) AS for the IPv6 prefix representing the best match of this address in Border Gateway Protocol (BGP) routing tables. We use the largest publicly available set of core BGP IPv6 routing tables, collected by http://www.ripe.net/projects/ris/rawdata.html RIPE NCC. The resulting abstracted AS graph consists of 486 AS nodes and 1,904 AS-links (peering sessions).
We mapped these ASes to geographic locations by taking the IPv4 BGP table from Routeviews and mapping each AS to its set of announced IPv4 prefixes. (IPv4 tables are currently much larger, facilitating more accurate inference of geographic coverage of an AS.) We subdivided prefixes into the smallest prefixes that Digital Envoy's Netacuity ® mapped to a single geographic location in January 2008. We plot the AS angle coordinate at the weighted average (by number of IP addresses in each mapped prefix) of the longitude coordinates of these prefixes.
Layout
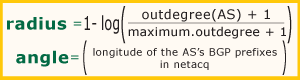
Figure 2. The equations for calculating the coordinates of an AS in the AS topology map.
The outdegree of an AS node is the number of next-hop ASes that were observed accepting our probe traffic from this AS. The link color reflects outdegree, from lowest (blue) to highest (yellow). Toward the center of the graph we have manually labeled some of the higher degree ASes with their associated ISP.
Comparative Analysis of scamper (traceroute) vs BGP topology data
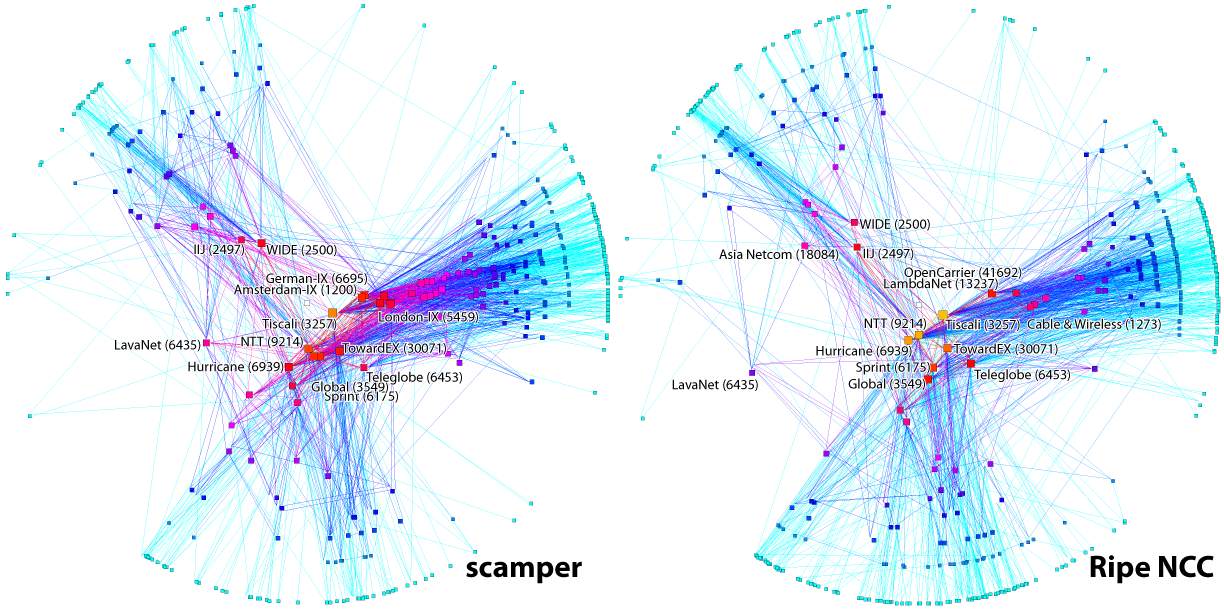
Figure 3. A comparison of two different methods of observing IPv6 AS topology: (1) probing forward IP paths with scamper, converting traversed IP addresses to ASes using longest BGP prefix match; and (2) inferring AS topology from BGP routing tables derived from BGP announcements of connectivity, and trusting that the announced connectivity actually transports traffic.
In addition to prefixes, RIPE NCC's BGP tables also contain AS paths for each prefix. We can use these AS paths to construct a 'BGP view' of the IPv6 AS level graph, shown on the left in Figure 3. Although the BGP view was larger than the scamper (traceroute-based) view in terms of ASes and IPv6 prefixes, it was smaller in terms of AS links. Table 1 compares coverage statistics for the two views, active probing vs. inference from routing announcements. The number of IPv6 sources in the scamper column reflects the number of IPv6 addresses stored as sources of the submitted traces, which may include duplicate private addresses. The number of IPv6 sources in the RIPE BGP table reflects the number of routers peering with the RIPE NCC BGP monitor. The number of source ASes reflects the number of ASes listed as the first AS in the BGP AS path.
| ||||||||||||||||||||||||||||||||||||||
The number of IPv6 prefixes in the scamper column counts the prefixes that contained at least one observed IPv6 address during the scamper path (active) probing. The number of IPv6 prefixes in the RIPE NCC BGP column is the number of prefixes actively announced as viewed from this routing table. Of the original 1,013 IPv6 prefixes in the RIPE NCC BGP snapshot, 80% (822) had at least one destination in our probe list. Of these prefixes, only 526 of these 1,013 prefixes were observed in scamper-observed paths, and only 467 prefixes were reached by a scamper probe targeting a destination in the prefix (the remaining 39 prefixes were seen in the traces, but not seen when they were the destination of the trace).
To calculate the number of ASes observed by scamper, we map each observed IPv6 address to the source AS for its longest matching IPv6 prefix found in the RIPE NCC BGP table. The number of ASes in the RIPE NCC BGP data includes those that do not originate any prefix announcements in the table, but act as transit. We compiled AS links by mapping adjacent IPv6 addresses to their corresponding ASes. Interestingly, although scamper observed only 58% of the ASes seen in the BGP table, we inferred 12% more AS links from the scamper-observed IPv6 addresses than the BGP table implies.
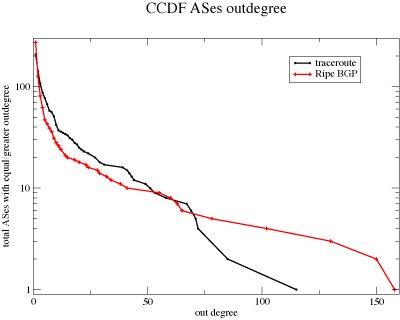 Figure 4. The complementary cumulative distribution
function (CCDF) plot of outdegree distribution of ASes the
scamper-derived and BGP-derived AS graphs shows that the
scamper/traceroute tool heavily samples ASes with outdegree
less than 50 while the RIPE BGP tables imply substantially higher
degree connectivity.
Figure 4. The complementary cumulative distribution
function (CCDF) plot of outdegree distribution of ASes the
scamper-derived and BGP-derived AS graphs shows that the
scamper/traceroute tool heavily samples ASes with outdegree
less than 50 while the RIPE BGP tables imply substantially higher
degree connectivity.
We emphasize that these two representations of topology data come from fundamentally different ways of sampling Internet connectivity: (1) passive observation of what publicly available BGP tables report about peering relationships, or (2) inferences from active transmission of traffic across a hopefully representative set of paths. Figure 4 plots the complementary cumulative distribution function (CCDF) of the outdegree for ASes in both data sets, and shows the difference in coverage achieved by the two sampling methods. Specifically, scamper/traceroute more heavily samples links connecting from ASes with moderate outdegree, between 5 and 50, while BGP data implies more links connecting high degree ASes. We explore this disparity further with the joint degree distribution of the ASes on either side of a given AS link.
Figures 5 and 6 show a joint degree distribution for ASes on sending and receiving sides of an inferred AS link. The color of each data point represents the density of AS links with degrees (x,y) on the sending and receiving ASes. The direction of a link corresponds to which direction a scamper probe observed the link, or which direction the BGP table implied traffic would flow. For example, observed path A B C yields directed links A->B and B->C. The x-axis of Figures 5 and 6 plots outdegree for sending ASes and the y-axis plots outdegree for the receiving ASes. Most links observed in the BGP data (Figure 6) connect ASes of all sizes to receiving ASes with outdegree less than 20. In contrast, Figure 5 shows that active scamper probe data observes many links from smaller outdegree ASes to larger outdegree ASes. The symmetric square patterns in Figure 5 reflect scamper observation of more bi-directional connectivity between ASes of moderate outdegree, between 5 and 50.
The difference in the graphs is consistent with the fact that scamper measurements originate from many more sources than there were peers in the BGP data sample. This enables acquisition of more topology data from outside the core, i.e., from ASes with smaller AS outdegrees. Many of the links captured by scamper/traceroute are peering links, which often do not get announced beyond a single neighbor AS. Our BGP table view is unlikely to capture these links.
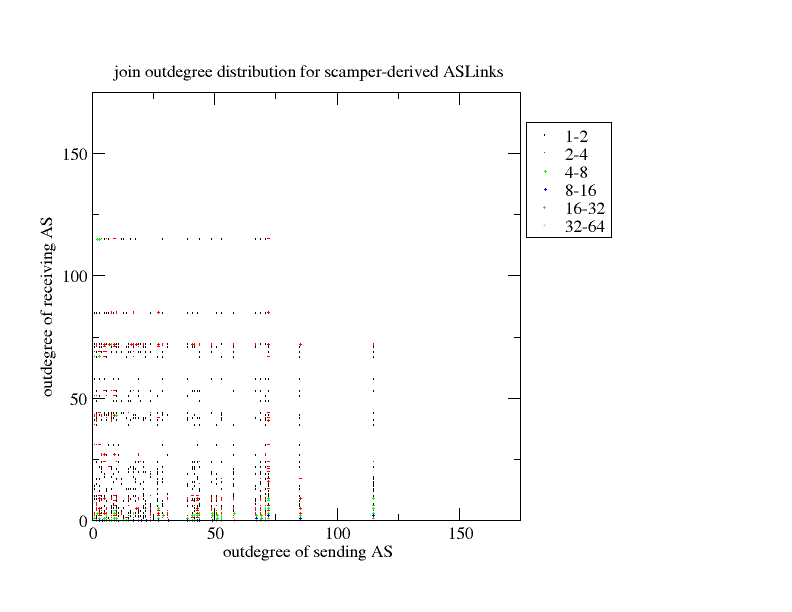 Figure 5. Joint outdegree
distribution for ASes on sending and receiving sides of
scamper-derived AS links. The color of each data point
represents the density of AS links with degrees (x,y) on
the sending and receiving ASes. The symmetry in the graph
reflects more bidirectional links observed between high and
low degree ASes, due to the sampling methodology.
Figure 5. Joint outdegree
distribution for ASes on sending and receiving sides of
scamper-derived AS links. The color of each data point
represents the density of AS links with degrees (x,y) on
the sending and receiving ASes. The symmetry in the graph
reflects more bidirectional links observed between high and
low degree ASes, due to the sampling methodology.
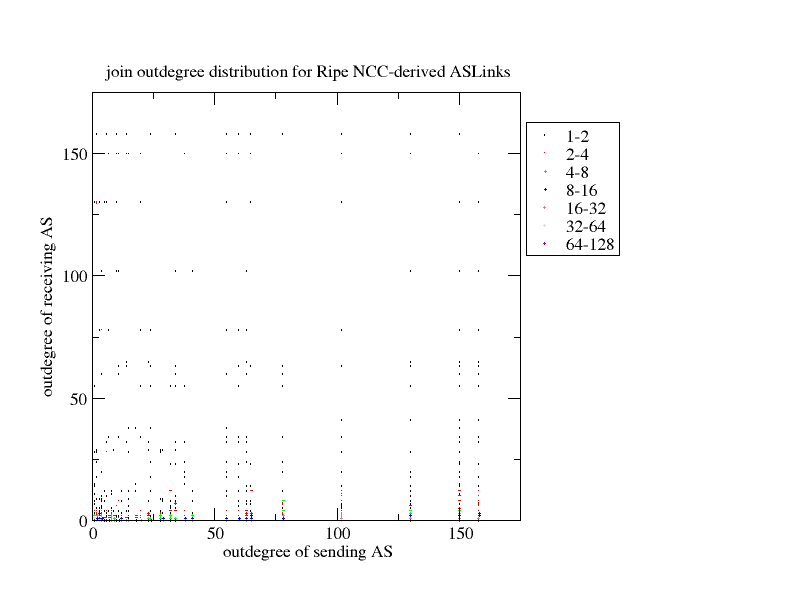 Figure 6. Joint outdegree
distribution for ASes on sending and receiving sides of
RIPE NCC BGP-derived AS links. The color of each data point
represents the density of AS links with degrees (x,y) on
the sending and receiving ASes. The asymmetry in the graph
reflects a preponderance of observed BGP announcements from
high degree ASes to low degree ASes.
Figure 6. Joint outdegree
distribution for ASes on sending and receiving sides of
RIPE NCC BGP-derived AS links. The color of each data point
represents the density of AS links with degrees (x,y) on
the sending and receiving ASes. The asymmetry in the graph
reflects a preponderance of observed BGP announcements from
high degree ASes to low degree ASes.
Reachability of IPv6 Address Prefixes Delegated by the Regional Internet Registries (RIRs)
In addition to graphing the AS-level topology and examining the link structure and distributions, we also measured how many of the RIR-delegated IPv6 address prefixes we could reach with a probe. (Unlike IPv4, in IPv6 thus far each delegation consists of a single prefix.) We created a destination list with a single IPv6 address (the .1 address) from each delegated IPv6 prefix seen in the RIR delegation reports from January 1, 2008.
Our plots distinguish between reached and seen since scamper saw several prefixes in the middle of a path (in 'transit') that we could not reach when we probed that prefix directly, as destinations. A possible explanation for this incongruity is that the packets were dropped at the border router when the traffic was directed at the prefix itself, but not when the prefix was used as transit.
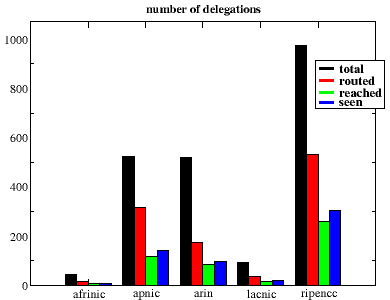 Figure 7. This graph shows the total number of IPv6
delegations by RIR on January 1, 2008. For each RIR we show the
number of routed delegations as well as the prefixes reached by
scamper, and those seen in the scamper paths.
Figure 7. This graph shows the total number of IPv6
delegations by RIR on January 1, 2008. For each RIR we show the
number of routed delegations as well as the prefixes reached by
scamper, and those seen in the scamper paths.
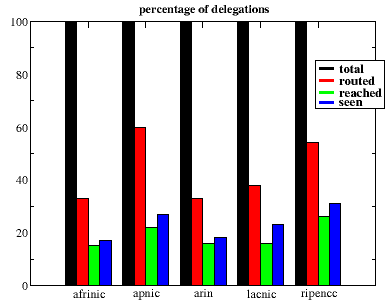 Figure 8. This graph shows the normalized
percentage of IPv6 delegations by RIR on January 1, 2008.
It includes the percentage of routed delegations,
the prefixes reached by scamper, and those observed
in the middle or end of scamper paths.
Figure 8. This graph shows the normalized
percentage of IPv6 delegations by RIR on January 1, 2008.
It includes the percentage of routed delegations,
the prefixes reached by scamper, and those observed
in the middle or end of scamper paths.
While all RIRs have made IPv6 delegations, Figure 7 shows that RIPE has most aggressively delegated IPv6 prefixes, at roughly twice the rates of APNIC and ARIN. Although RIPE NCC has a larger number of prefixes routed, Figure 8 shows that APNIC has a larger percentage of its delegated prefixes routed.
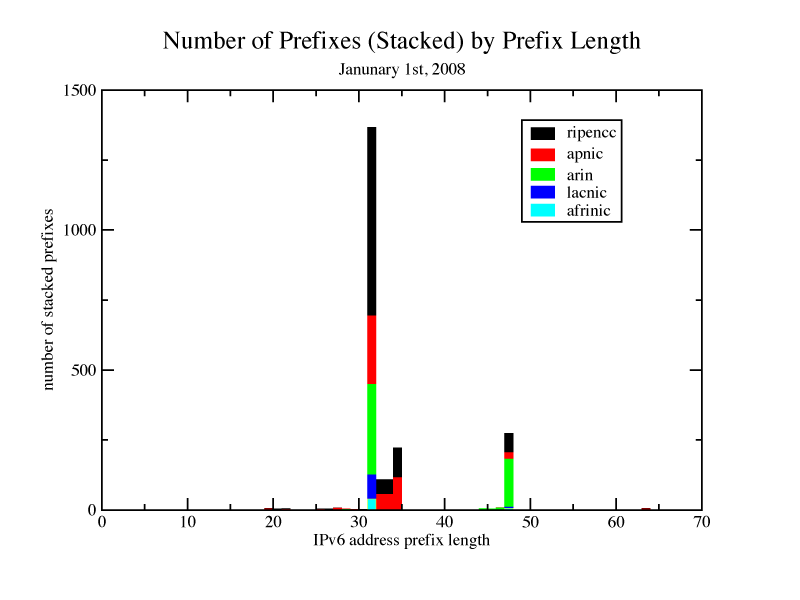
Figure 9. This graph shows the lengths of the IPv6 address prefixes delegated by each RIR.
Figure 9 shows how the network prefix delegations breakdown by RIR and by prefix length. Though each RIR sets its own assignment policy, the two most common delegation sizes so far have been /32 and /48, with only RIPE NCC and APNIC assigning a significant number of prefixes in the /33 to /35 range.
Figure 10 divides each delegated prefix into /48 sized chunks so we can compare the relative amount of address space covered by each RIR's delegations. When examined this way, the delegation gap between APNIC and RIPE shrinks, but the gap between these two RIRs and all the others is larger. Since a large percentage of RIPE NCC's routed prefixes come from its larger delegations (/32s), Figure 11 shows that RIPE's percentage of routed addresses is larger than its percentage of routed prefixes shown above in Figure 8. LACNIC also shows an increase, but both ARIN and APNIC show relative drops in their percentage of routed addresses verses routed prefixes, reflecting the smaller size of delegations in the ARIN and APNIC regions.
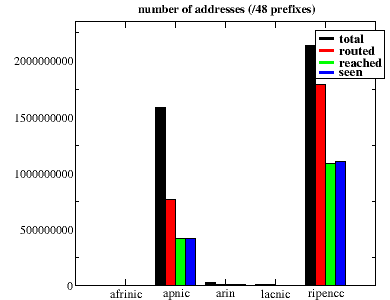
Figure 10. This graph shows the number of IPv6 addresses, counted in /48 prefixes, allocations observed in each state for each RIR.
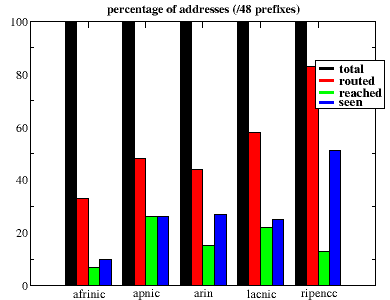
Figure 11. This graph shows the normalized percentage of IPv6 delegated addresses in each state for each of the RIRs.
Caveats
We emphasize the following limitations of CAIDA's scamper-based IPv6 AS core graph.
- Some organizations administer multiple ASes, although usually there is a one-to-one mapping between an AS and a network organization.
- The IPv6 Internet Topology Map AS-level graph reflects observations and conditions during the measurement window: January 2-8, 2008.
- The graph represents forward IP topology information, with IP addresses mapped to origin ASes using a BGP routing table. The graph does not reflect all information about peering sessions or constitute a complete route map. Our BGP table view is unlikely to capture peering links which do not get announced beyond a single neighbor AS and therefore incomplete.
- The graph reflects observations of the IP layer only, and does not capture information regarding lower layers, e.g., ATM, physical fiber, information.
- The graph does not address any performance or workload measurements, precluding comparison of ISPs in these dimensions.
- Nodes with many links may be located on the outer rim if their AS has an observed outdegree of zero.
Poster
(PNG image, 998kb) (PDF, 3.9 MB)
Acknowledgments
Analysis Team:
Bradley Huffaker,
Kimberly Claffy
Scamper software developer:
Matthew Luckie
Data Sources:
APNIC,
AfriNIC ,
Alexander Gall, Andreas Johansson, Antonio Prado,
Antonio Querubin,
ARIN,
Azael Fernandez Alcantara,
Bernhard Schmidt, Brad Dreisbach, Brian Fitzgerald,
CAIDA,
Chris Morrow,
Derek Morr,
Gabriel Kerneis, Geoff Huston, Gert Doering,
ISC,
Iljitsch van Beijnum, Jean-Philippe Pick,
John Kristoff, John Osmon,
Kenjiro Cho, Kurt Jaeger,
LACNIC,
Martin Millnert, Mathieu Arnold
RIPE NCC,
Nuno Vieira, Ollivier Robert, Sebastian Abt, Shane Kerr