

IPv4 and IPv6 AS Core: Visualizing IPv4 and IPv6 Internet Topology at a Macroscopic Scale in 2011
Since 2000, CAIDA has generated AS Core graphs -- Internet Topology Maps also referred to as AS-level Internet Graphs -- in order to visualize the shifting topology of the Internet over time, as can be seen in the historical view.
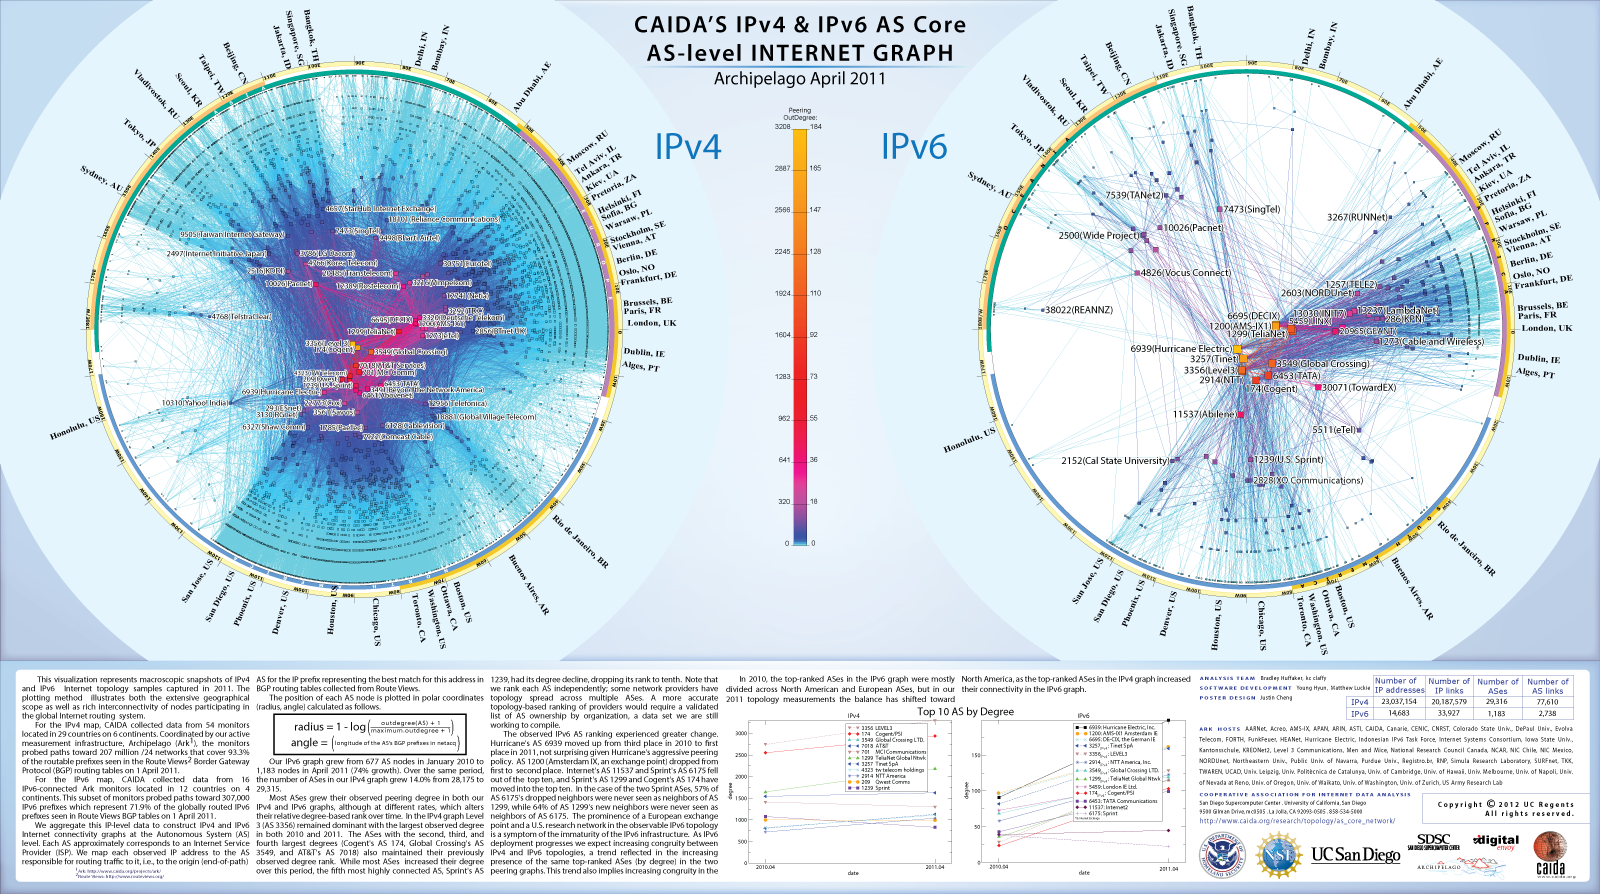
Presented below is CAIDA's 2011 visualization of both IPv4 and IPv6 Internet topology at the Autonomous System (AS) level.
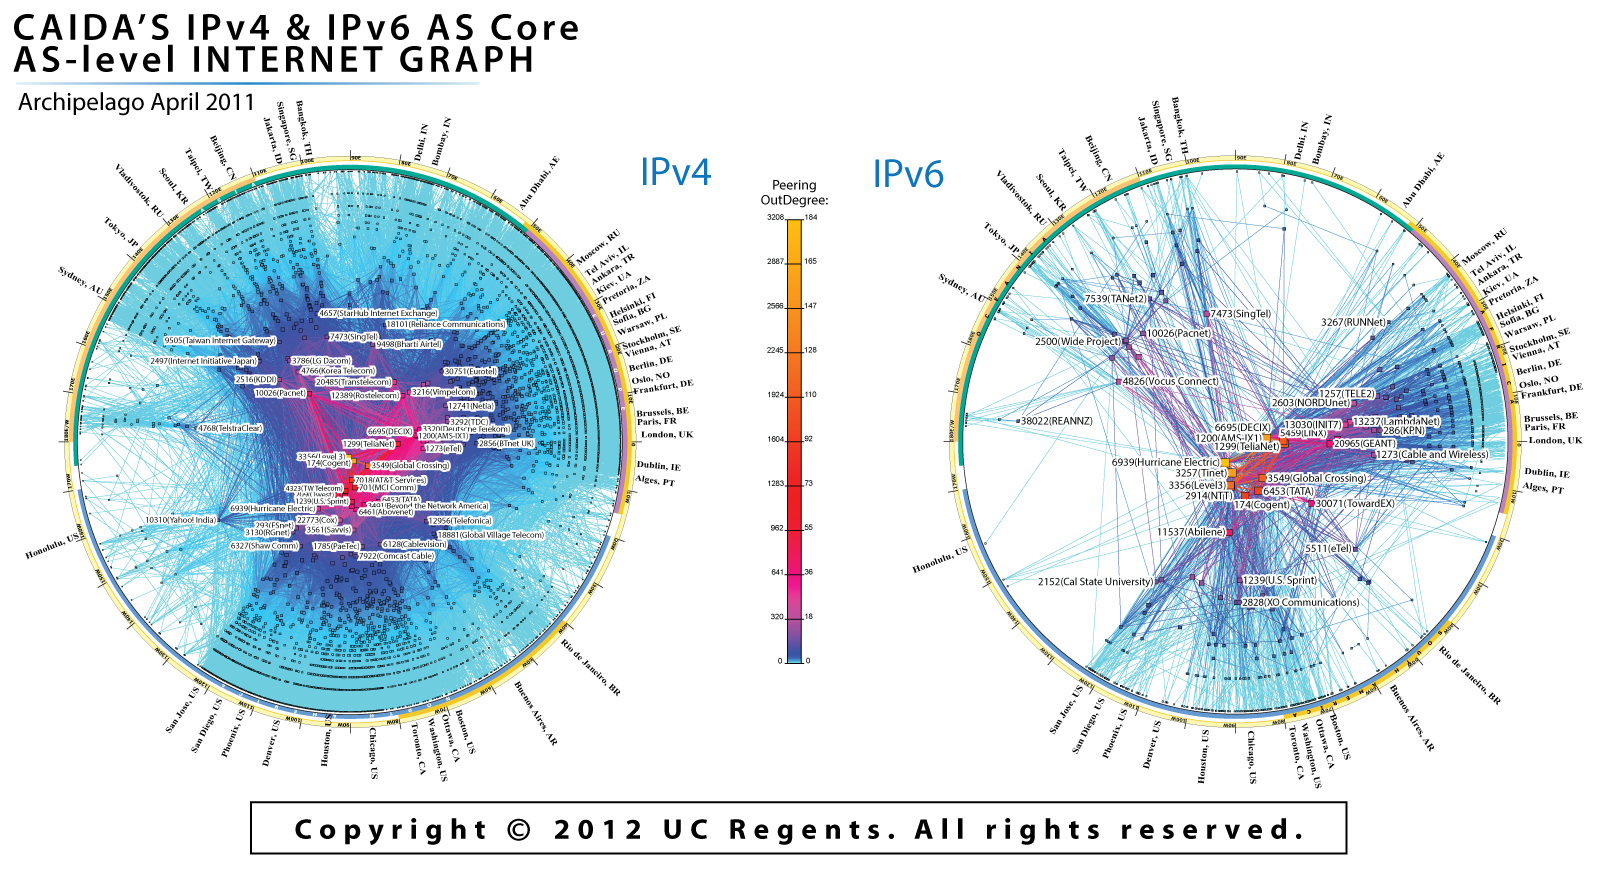 Figure 1. IPv4 and IPv6 AS Core April 2011.
Data Source
This visualization represents macroscopic snapshots of IPv4 and IPv6 Internet topology samples captured in 2011. The plotting method illustrates both the extensive geographical scope as well as rich interconnectivity of nodes participating in the global Internet routing system.
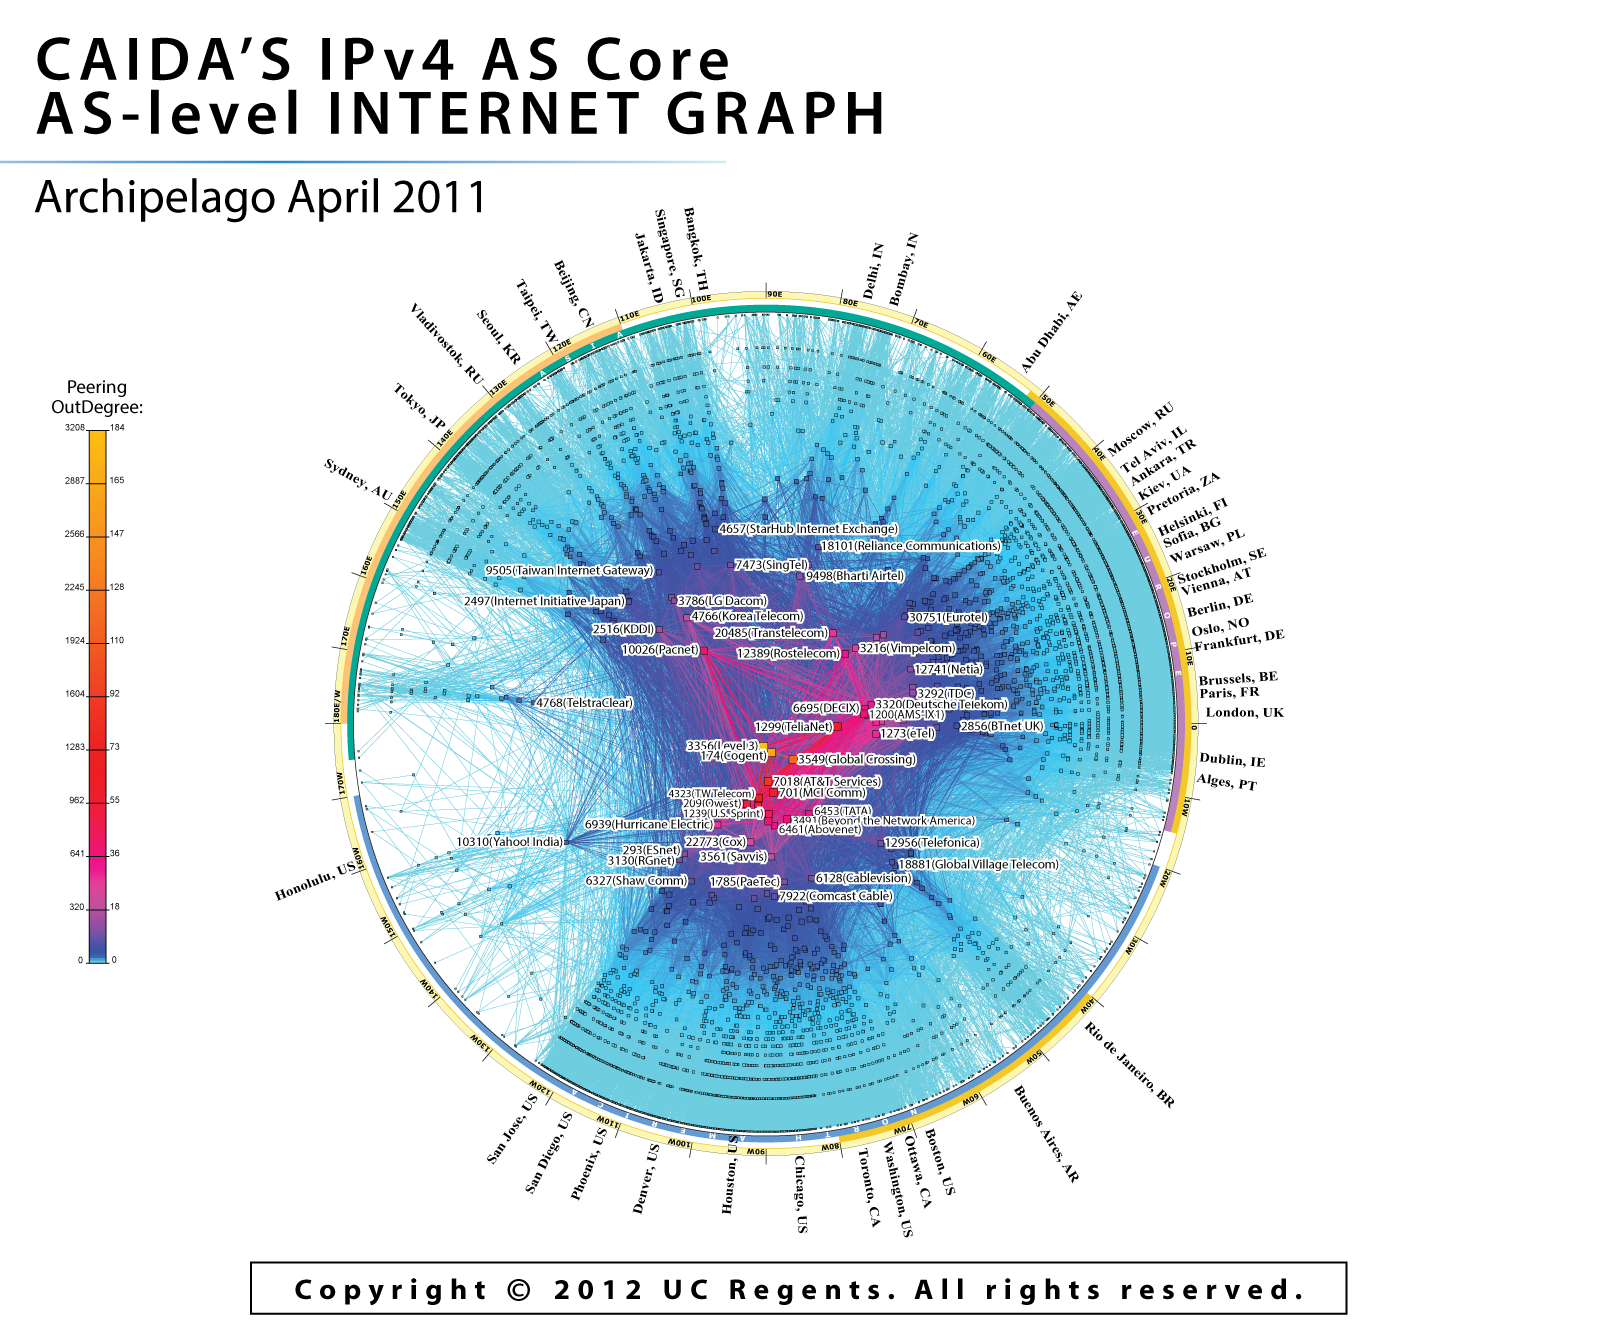
For the IPv4 map, CAIDA collected data from 54 monitors located in 29 countries on 6 continents. Coordinated by our active measurement infrastructure, Archipelago (Ark1), the monitors probed paths toward 207 million /24 networks that cover 93.3% of the routable prefixes seen in the Route Views2 Border Gateway Protocol (BGP) routing tables on 1 April 2011.
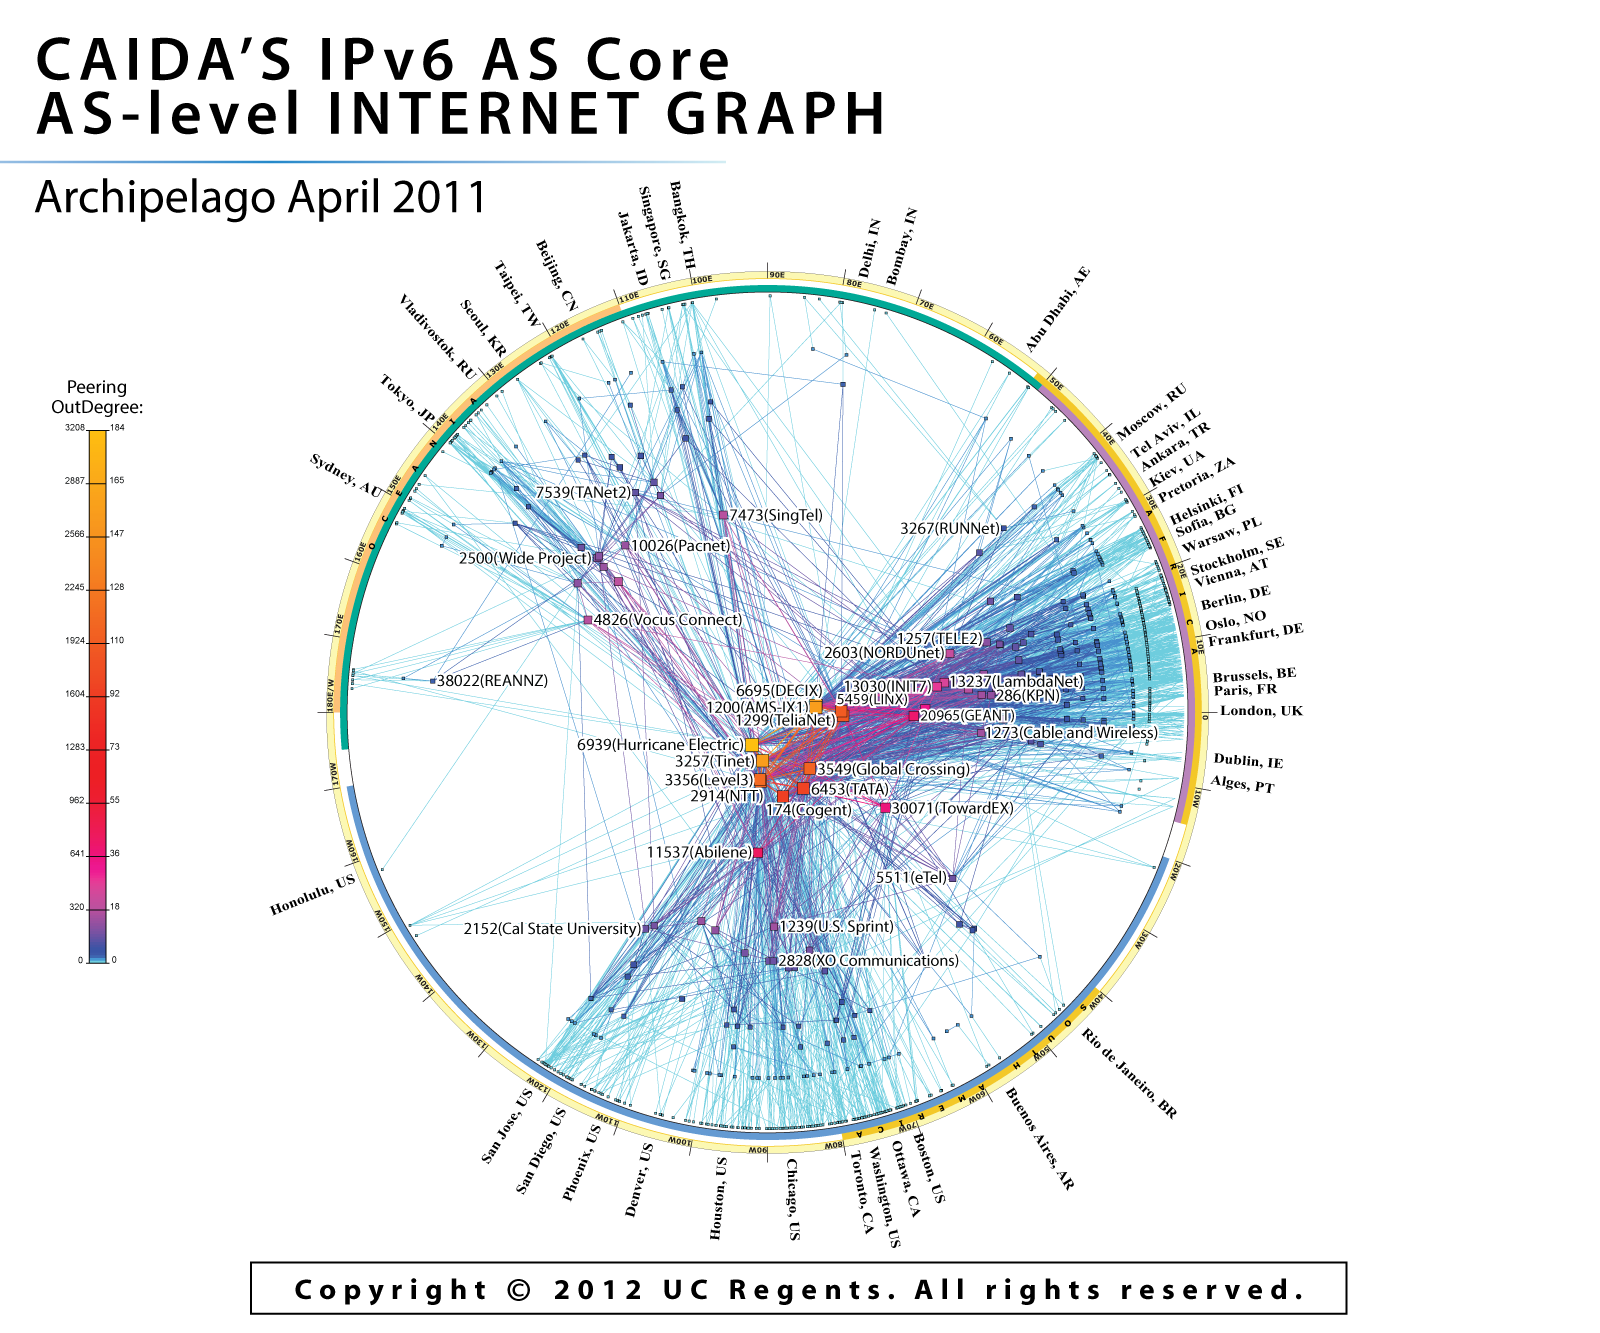
For the IPv6 map, CAIDA collected data from 16 IPv6-connected Ark monitors located in 12 countries on 4 continents. This subset of monitors probed paths toward 307,000 IPv6 prexes which represent 71.9% of the globally routed IPv6 prefixes seen in Route Views BGP tables on 1 April 2011.
We aggregate this IP-level data to construct IPv4 and IPv6 Internet connectivity graphs at the Autonomous System (AS) level. Each AS approximately corresponds to an Internet Service Provider (ISP). We map each observed IP address to the AS responsible for routing traffic to it, i.e., to the origin (end-of-path) AS for the IP prefix representing the best match for this address in BGP routing tables collected from Route Views.
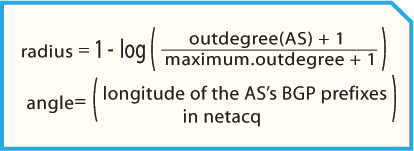
Figure 2. Coordinates of AS in AS core.
The position of each AS node is plotted in polar coordinates (radius, angle) calculated as indicated in Figure 2, on the right.
Our IPv6 graph grew from 515 AS nodes in January 2009 to 948 nodes in August 2010 (84% growth). Over the same period, the number of ASes in our IPv4 graph grew 22%, from 23K to 28K.
Most ASes grew their observed peering degree in both our IPv4 and IPv6 graphs, although at dierent rates, which alters their relative degree-based rank over time. In the IPv4 graph Level 3 (AS 3356) remained dominant with the largest observed degree in both 2010 and 2011. The ASes with the second, third, and fourth largest degrees (Cogent's AS 174, Global Crossing's AS 3549, and AT&T's AS 7018) also maintained their previously observed degree rank. While most ASes increased their degree over this period, the fifth most highly connected AS, Sprint's AS 1239, had its degree decline, dropping its rank to tenth. Note that we rank each AS independently; some network providers have topology spread across multiple ASes. A more accurate topology-based ranking of providers would require a validated list of AS ownership by organization, a data set we are still working to compile.
The observed IPv6 AS ranking experienced greater change. Hurricane's AS 6939 moved up from third place in 2010 to first place in 2011, not surprising given Hurricane's aggressive peering policy. AS 1200 (Amsterdam IX, an exchange point) dropped from first to second place. Internet's AS 11537 and Sprint's AS 6175 fell out of the top ten, and Sprint's AS 1299 and Cogent's AS 174 have moved into the top ten. In the case of the two Sprint ASes, 57% of AS 6175's dropped neighbors were never seen as neighbors of AS 1299, while 64% of AS 1299's new neighbors were never seen as neighbors of AS 6175. The prominence of a European exchange point and a U.S. research network in the observable IPv6 topology is a symptom of the immaturity of the IPv6 infrastructure. As IPv6 deployment progresses we expect increasing congruity between IPv4 and IPv6 topologies, a trend reflected in the increasing presence of the same top-ranked ASes (by degree) in the two peering graphs. This trend also implies increasing congruity in the
In 2010, the top-ranked ASes in the IPv6 graph were mostly divided across North American and European ASes, but in our 2011 topology measurements the balance has shifted toward North America, as the top-ranked ASes in the IPv4 graph increased their connectivity in the IPv6 graph. In neither 2009 nor 2010 are the top degree-ranked ASes the same across IPv4 and IPv6. The IPv4 core is centered primarly in the United States, while the IPv6 core includes Europe as well as the United States. We observed no high-degree "hub" IPv6 ASes in Asia, surprising given the reportedly large IPv6 deployment in Asia. This gap may reflect the geographic bias of our IPv6-capable monitor deployment: five in the US, four in Europe, and only one in Asia.
Conclusion
One of CAIDA's topology mapping project goals is to develop techniques to illustrate relationships and depict critical components of the Internet infrastructure. For more information about the topology mapping project, see: https://www.caida.org/projects/macroscopic/
For more information on methodology for ranking AS interconnectivity, see CAIDA's Introduction to Relationship-based AS Ranking.
Poster
 PNG image, 1.0 MB) (PDF, 4.9 MB)
Acknowledgments
CAIDA Topology Mapping Analysis Team: Brad Huffaker, kc claffy
Software Development: Young Hyun, Matthew Luckie
Poster Design: Justin Cheng