

Visualizing Internet Topology at a Macroscopic Scale
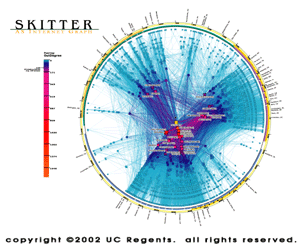
AS Core Visualization
We describe a visualization that shows a macroscopic snapshot of the Internet core taken from data collected during a two week period from April 1-16, 2002.
Input Data
The graph reflects 1,224,733 IP addresses and 2,093,194 IP links, (immediately adjacent addresses in a traceroute-like path) of skitter data from 16 monitors probing approximately 932,000 destinations spread across over 75,000 (70%) of globally routable network prefixes.We then aggregate this view of the network into a topology of Autonomous Systems (ASes), each of which approximately maps to an Internet Service Provider (ISP). We map each IP address to the AS responsible for routing it, i.e., the origin (end-of-path) AS for the best match IP prefix of this address in Border Gateway Protocol (BGP) routing tables collected by the University of Oregon's RouteViews project (http://www.antc.uoregon.edu/route-views/). The abstracted graph consists of 11,122 Autonomous System (AS) nodes and 35,752 peering sessions. For 123 ASes we could not provide geographical location. The resulting graph contains 10,999 ASes (84% of all ASes present in Oregon BGP table of Apr. 15, 2000) and 34,209 peering sessions.
Layout
The position of each AS node is plotted in polar
coordinates, position(radius, angle) or pos(r,
![]() ) calculated using the equations in the box below.
) calculated using the equations in the box below.
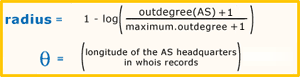 The outdegree of an AS node is the number of `next-hop'
ASes that were observed accepting traffic from this AS.
The link color reflects outdegree, from lowest (blue) to highest (yellow),
Some ISPs toward the center have been manually labeled.
The outdegree of an AS node is the number of `next-hop'
ASes that were observed accepting traffic from this AS.
The link color reflects outdegree, from lowest (blue) to highest (yellow),
Some ISPs toward the center have been manually labeled.
Insights
Graphing dimensions of peering richness and geographic information reveals the highly 'core-concentric' nature of ASes based in North America. This is true despite the recent ascendance of two European ISPs into the top 15 ASes. The top 13 ASes are based in the U.S. and one of the European ISPs in the top 15 is the European branch of an American company. While ISPs in Europe and Asia have many peering relationships with ISPs in the U.S. there are few links directly between ISPs in Asia and Europe. Both technical (cabling and router placement and management) as well as policy (business and cost models, geo-political considerations) factors contribute to peering arrangements represented in this graph.
Caveats
This visualization does have some limitations:
- Each AS headquarters reflects only its administrative home, not geographical location of actual infrastructure (which is often national or global).
- The graph does not reflect current conditions, only a snapshot taken in October 2000. More studies are needed to determine an appropriate sampling rate. (CAIDA hopes to have a daily update available by January 2001.)
- The graph only represents forward IP topology information, with IP addresses mapped to origin ASes using a BGP routing table. Other information about peering sessions or complete route maps is not reflected.
- The graph reflects the IP layer only, does not capture lower layer (e.g., ATM, physical fiber) information.
- The graph does not address any performance or workload measurements, precluding comparison of ISPs in these dimensions.
Conclusion
One of CAIDA's skitter project goals is to develop techniques to illustrate relationships and depict critical components of the Internet infrastructure.
For more information about skitter, see: https://www.caida.org/catalog/software/skitter.
Demonstration
If you would like to try out a demo of the CAIDA tools used to construct this graph, please see https://www.caida.org/projects/internetatlas/gallery/ascore/demo.
Acknowledgments
CAIDA contributors to the visualization: Brad Huffaker, Andre Broido, kc claffy, Marina Fomenkov, Sean McCreary, David Moore, and Oliver Jakubiec.