

AS Core: Visualizing IPv4 Internet Topology at a Macroscopic Scale in 2017
Since 2000, CAIDA has generated AS Core graphs -- Internet Topology Maps also referred to as AS-level Internet Graphs -- in order to visualize the shifting topology of the Internet over time, as can be seen in the historical view.
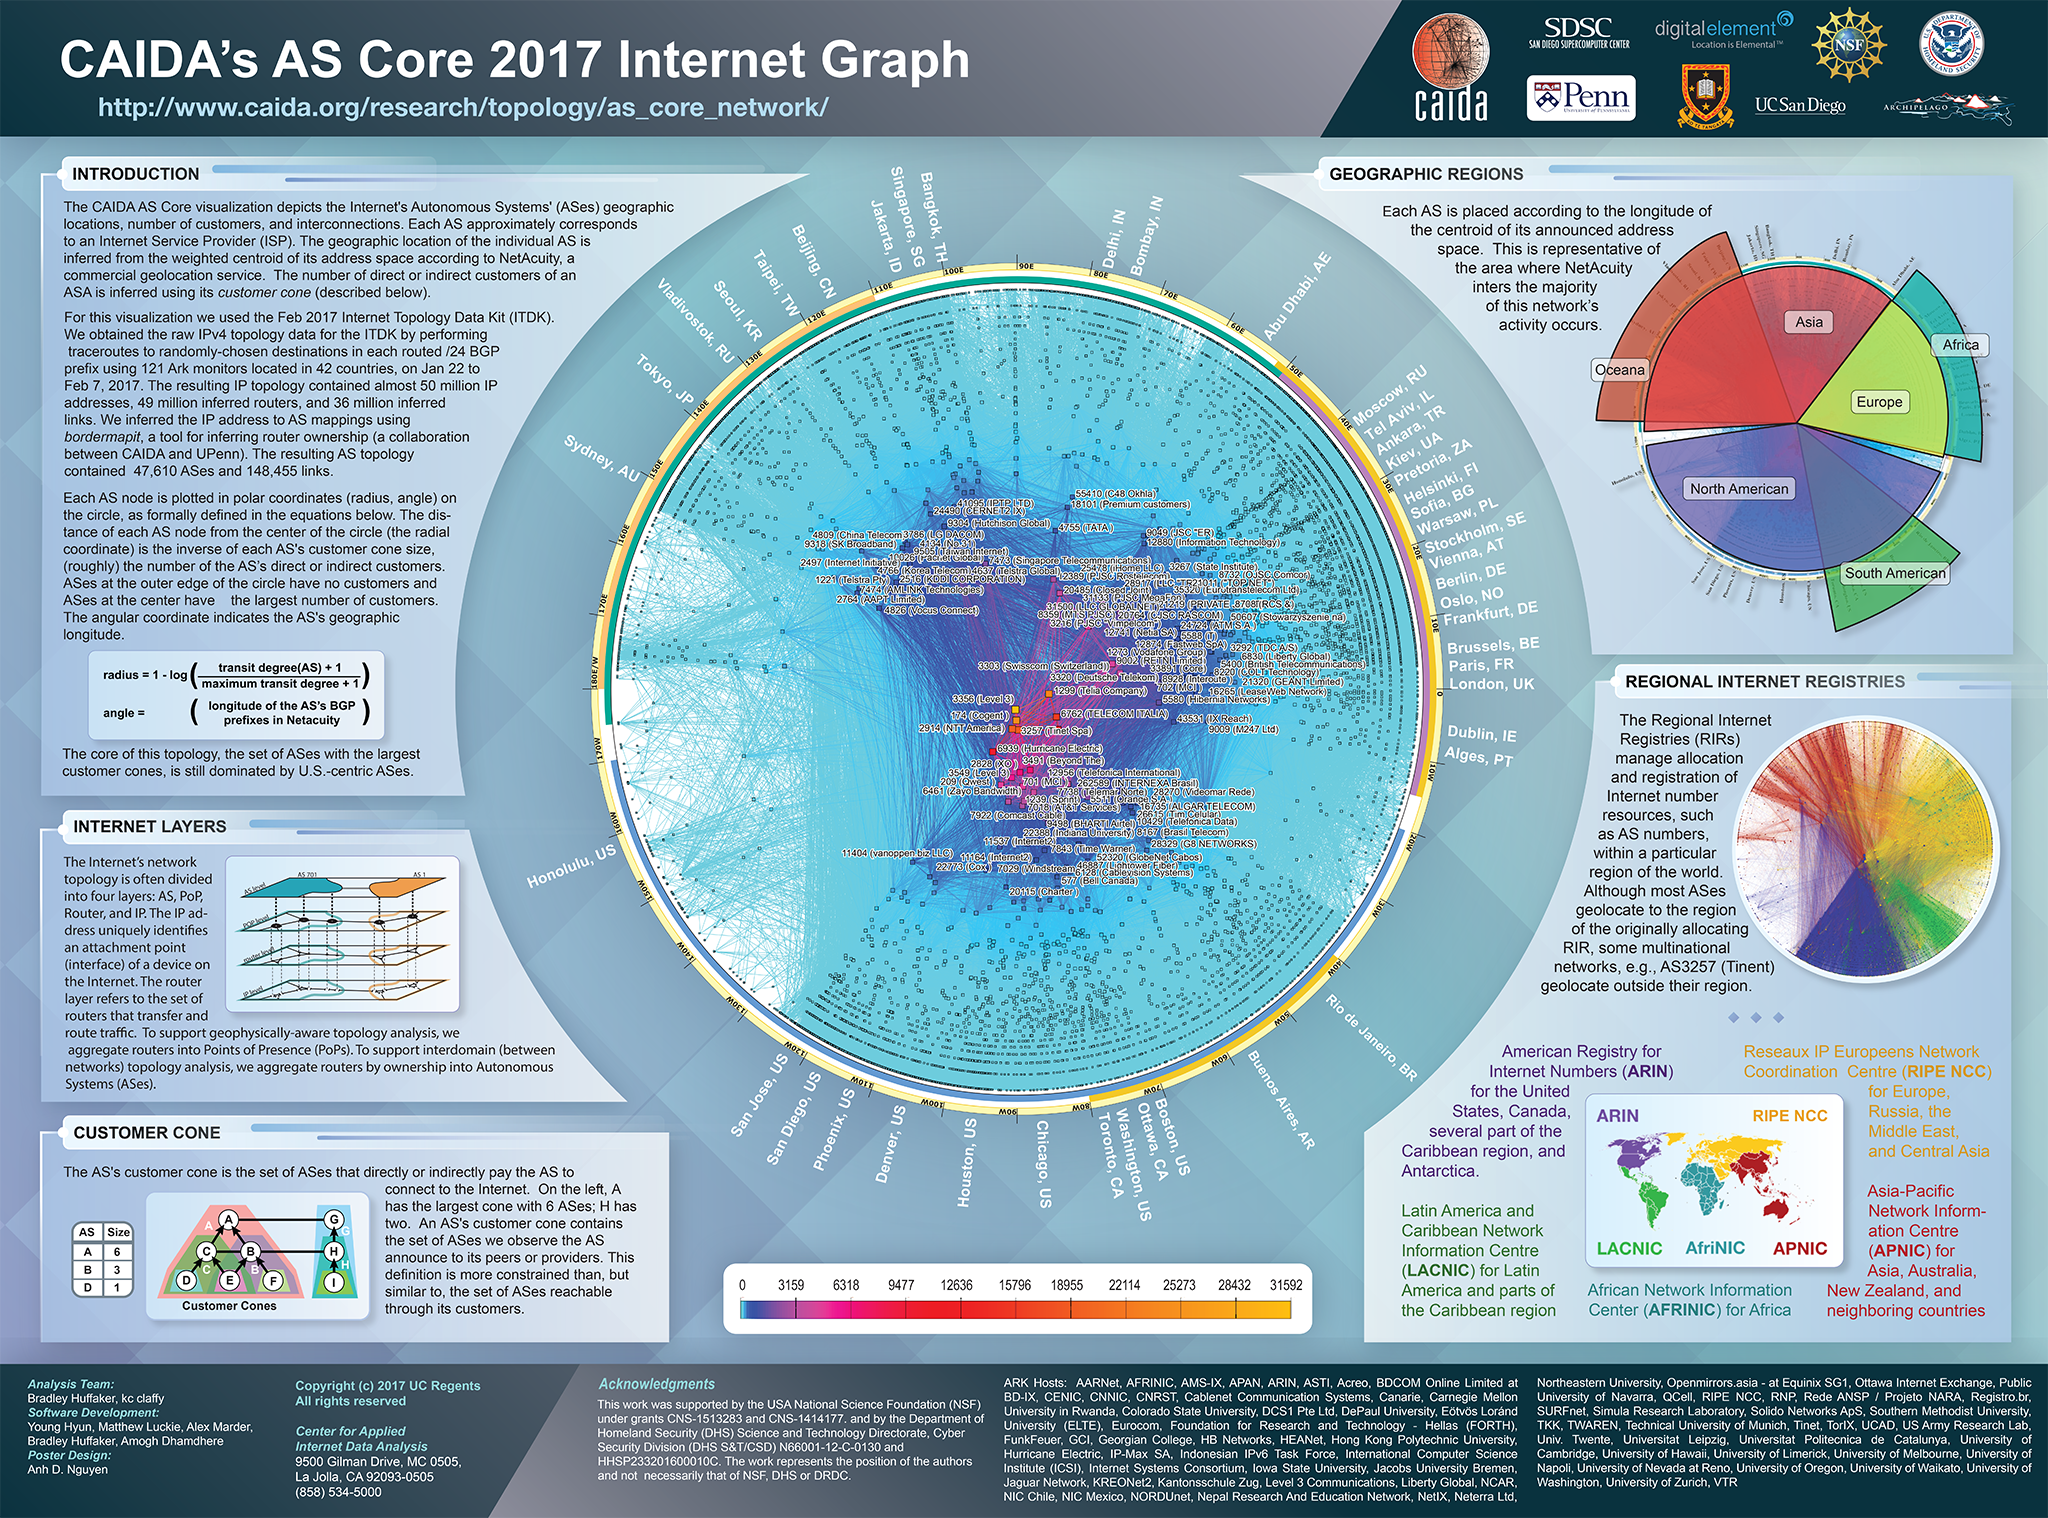
Presented below is CAIDA's 2017 visualization of IPv4 Internet topology at the Autonomous System (AS) level.
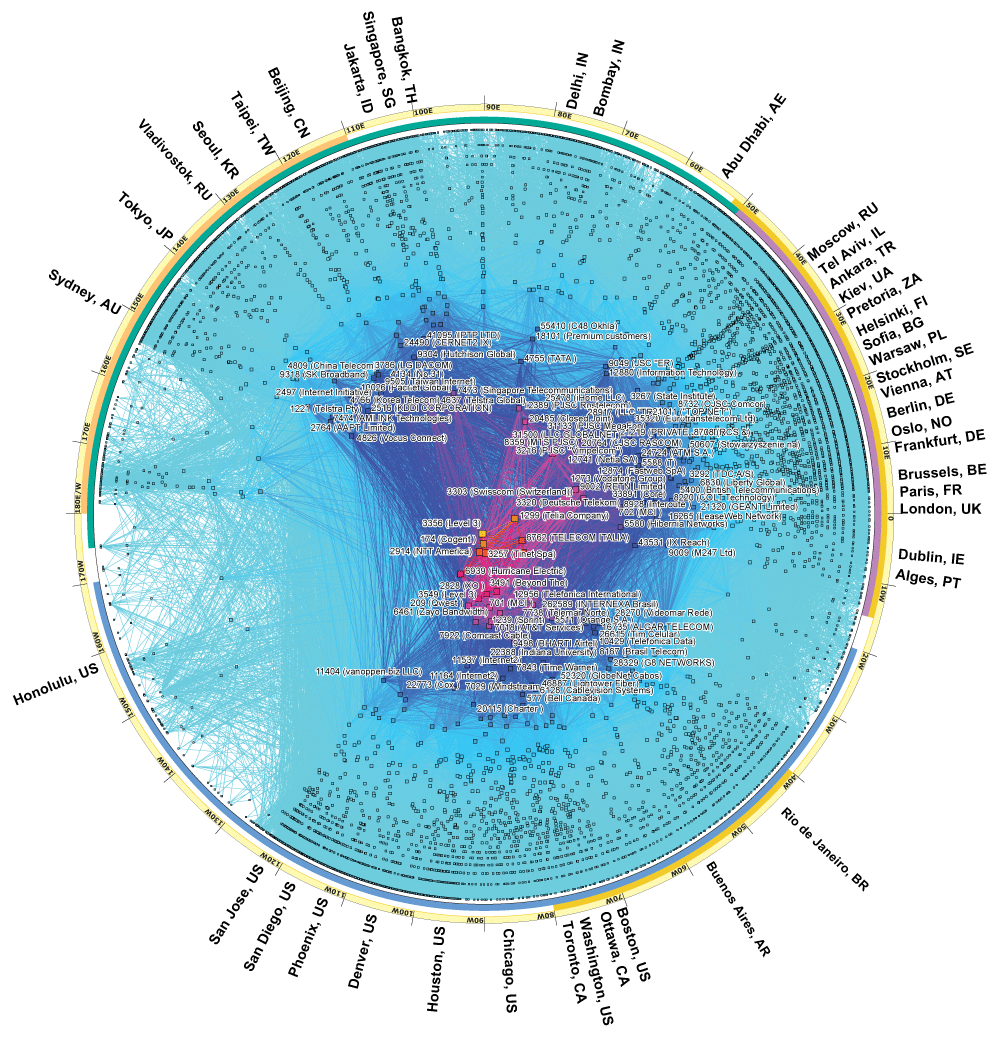
IPv4 AS Core February 2017.
Introduction
The CAIDA AS Core visualization depicts the Internet's Autonomous Systems' (ASes) geographic locations, number of customers, and interconnections. Each AS approximately corresponds to an Internet Service Provider (ISP). The geographic location of the individual AS is inferred from the weighted centroid of its address space according to NetAcuity, a commercial geolocation service. The number of direct or indirect customers of an ASA is inferred using its customer cone (described below).
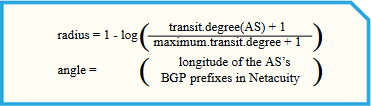
Coordinates of AS in AS core visualization.
For this visualization we used the Feb 2017 Internet Topology Data Kit (ITDK). We obtained the raw IPv4 topology data for the ITDK by performing traceroutes to randomly-chosen destinations in each routed /24 BGP prefix using 121 Ark monitors located in 42 countries, on Jan 22 to Feb 7, 2017. The resulting IP topology contained almost 50 million IP addresses, 49 million inferred routers, and 36 million inferred links. We inferred the IP address to AS mappings using bordermapit, a tool for inferring router ownership (a collaboration between CAIDA and UPenn). The resulting AS topology contained 47,610 ASes and 148,455 links.
Each AS node is plotted in polar coordinates (radius, angle) on the circle, as formally defined in the equations below. The distance of each AS node from the center of the circle (the radial coordinate) is the inverse of each AS's customer cone size, (roughly) the number of the AS's direct or indirect customers. ASes at the outer edge of the circle have no customers and ASes at the center have the largest number of customers. The angular coordinate indicates the AS's geographic longitude.
The core of this topology, the set of ASes with the largest customer cones, is still dominated by U.S.-centric ASes.
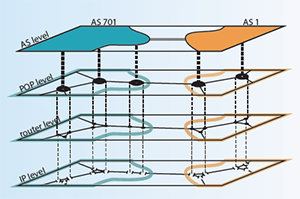
Internet Layers: AS, PoP, Router, and IP.
Internet Layers
The Internet's network topology is often divided into four layers: AS, PoP, Router, and IP. The IP addresses an attachment point (interface) of a device on the Internet. The router layer refers to the set of routers that transfer and route trac. To support geophysically-aware topology analysis, we aggregate routers into Points of Presence (PoPs). To support interdomain (between networks) topology analysis, we aggregate routers by ownership into Autonomous Systems (ASes).
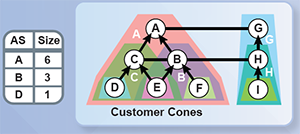
Customer cones
Customer Cone
The AS's customer cone is the set of ASes that directly or indirectly pay the AS to connect to the Internet. On the left, A has the largest cone with 6 ASes; H has two. An AS's customer cone contains the set of ASes we observe the AS announce to its peers or providers. This definition is more constrained than, but similar to, the set of ASes reachable through its customers.
Geographic Regions
Each AS is placed according to the longitude of the centroid of its announced address space. This is representative of the area where NetAcuity inters the majority of this network's activity occurs.
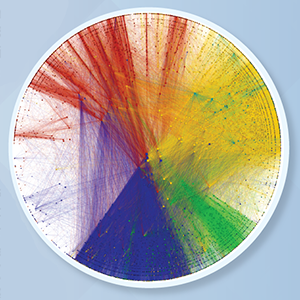
AS Core by Regional Internet Registries.
Regional Internet Registries
The Regional Internet Registries (RIRs) manage allocation and registration of Internet number resources, such as AS numbers, within a particular region of the world. Although most ASes geolocate to the region of the originally allocating RIR, some multinational networks, e.g., AS3257 (Tinent) geolocate outside their region.
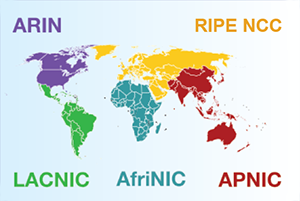
The five Regional Internet Registries (RIRs).
- American Registry for Internet Numbers (ARIN) for the United States, Canada, several part of the Caribbean region, and Antarctica.
- Reseaux IP Europeens Network Coordination Centre (RIPE NCC) for Europe, Russia, the Middle East, and Central Asia.
- Latin America and Caribbean Network Information Centre (LACNIC) for Latin America and parts of the Caribbean region.
- African Network Information Center (AFRINIC) for Africa.
- Asia-Pacific Network Information Centre (APNIC) for Asia, Australia, New Zealand, and neighboring countries.
This work was supported by the USA National Science Foundation (NSF) under grants CNS-1513283 and CNS-1414177. and by the Department of Homeland Security (DHS) Science and Technology Directorate, Cyber Security Division (DHS S&T/CSD) N66001-12-C-0130 and HHSP233201600010C. The work represents the position of the authors and not necessarily that of NSF, DHS or DRDC.
For more information about the topology mapping project, see: https://www.caida.org/projects/macroscopic/
For details on a more sophisticated methodology for ranking AS interconnectivity, based on inferring AS relationships from BGP data, see CAIDA's Introduction to Relationship-based AS Ranking at https://www.caida.org/catalog/datasets/as-relationships/.
Demonstration
If you would like to try out a demo of the CAIDA tools used to construct this graph, please see https://www.caida.org/projects/internetatlas/gallery/ascore/demo.
Poster
Acknowledgments
CAIDA
Topology Mapping Analysis Team: Brad Huffaker, kc claffy
Software Development: Young Hyun, Matthew Luckie, Alex Marder, Bradley Huffaker, Amogh Dhamdhere
Poster
Design: Anh D. Nguyen