

Hyperbolic CCN Forwarding
Below we show the performance metrics for the modified greedy forwarding (MGF) algorithm
in the CCN testbed. The metrics and the algorithm are described in Section X of
this paper.
The results are reported for the full CCN graph, and also for all the graphs
obtained from the full graph by removing one link without disconnecting the full
graph.
Each experiment has three files associated with it:
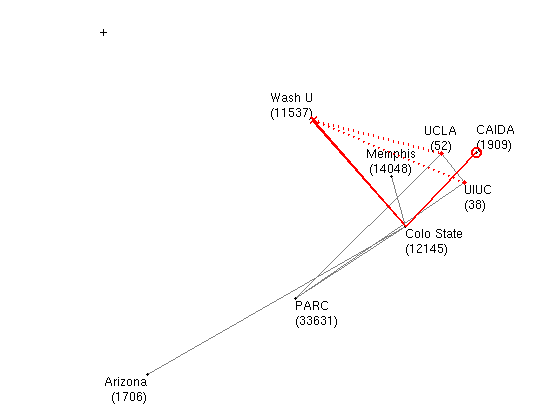 The origin of the hyperbolic plane is marked by the plus sign.
The two unsuccessful paths from CAIDA are shown in red: the circle is the source,
solid lines are forwarded links, "X" marks the local minimum,
and dotted lines artificially connect the local minimum to the
destinations. All other visualization details are as in Fig.5 of
this paper.
The origin of the hyperbolic plane is marked by the plus sign.
The two unsuccessful paths from CAIDA are shown in red: the circle is the source,
solid lines are forwarded links, "X" marks the local minimum,
and dotted lines artificially connect the local minimum to the
destinations. All other visualization details are as in Fig.5 of
this paper.
stretch 1: avg 1.0083, max 1.3333
stretch 2: avg 1.7715, max 4.1066
stretch 3: avg 1.7465, max 3.1452
links, paths
stretch 1: avg 1.0000, max 1.0000
stretch 2: avg 1.8605, max 4.1066
stretch 3: avg 1.8605, max 4.1066
links, paths
stretch 1: avg 1.0000, max 1.0000
stretch 2: avg 1.7810, max 3.8571
stretch 3: avg 1.7810, max 3.8571
links, paths
stretch 1: avg 1.0000, max 1.0000
stretch 2: avg 1.8002, max 3.1452
stretch 3: avg 1.8002, max 3.1452
links, paths
 The origin of the hyperbolic plane is marked by the plus sign.
stretch 1: avg 1.0000, max 1.0000
stretch 2: avg 1.4175, max 2.0340
stretch 3: avg 1.4175, max 2.0340
links, paths
stretch 1: avg 1.0000, max 1.0000
stretch 2: avg 1.5169, max 3.0874
stretch 3: avg 1.5169, max 3.0874
links, paths
stretch 1: avg 1.0000, max 1.0000
stretch 2: avg 1.5344, max 3.1368
stretch 3: avg 1.5344, max 3.1368
links, paths
stretch 1: avg 1.0000, max 1.0000
stretch 2: avg 1.4355, max 2.0340
stretch 3: avg 1.4355, max 2.0340
links, paths
 The origin of the hyperbolic plane is marked by the plus sign.
stretch 1: avg 1.0000, max 1.0000
stretch 2: avg 1.0550, max 1.1944
stretch 3: avg 1.0550, max 1.1944
links, paths
stretch 1: avg 1.0000, max 1.0000
stretch 2: avg 1.1922, max 2.8580
stretch 3: avg 1.1922, max 2.8580
links, paths
stretch 1: avg 1.0000, max 1.0000
stretch 2: avg 1.1951, max 2.8580
stretch 3: avg 1.1951, max 2.8580
links, paths
stretch 1: avg 1.0000, max 1.0000
stretch 2: avg 1.0578, max 1.1944
stretch 3: avg 1.0578, max 1.1944
links, paths
- nodes describes the nodes and their polar coordinates in the hyperbolic plane. The format is self-documenting.
- links lists each link as a pair of AS numbers.
- paths
files contain the forwarding paths between all source-destination pairs.
Each line represents one path between a source-destination pair,
and has the format:
AS1 AS2 AS3 ... ASN-1 ASN outcome
AS1 is the source and ASN is the destination. AS2 ... ASN-1 are other hops along the path; each is preceeded with a "-" or "+" if the distance to the destination decreased or increased, compared to the previous hop. Outcome is either "s" for success, or "f" for failure. If outcome is "f", then ASN-1 is the hop at which the forwarding algorithm gave up.
original
The origin of the hyperbolic plane is marked by the plus sign.
The two unsuccessful paths from CAIDA are shown in red: the circle is the source,
solid lines are forwarded links, "X" marks the local minimum,
and dotted lines artificially connect the local minimum to the
destinations. All other visualization details are as in Fig.5 of
this paper.The CCN testbed graph with the hyperbolic coordinates of the involved ASs given in Supplementary Information of this paper.
nodesfull graph
success ratio: 0.7143stretch 1: avg 1.0083, max 1.3333
stretch 2: avg 1.7715, max 4.1066
stretch 3: avg 1.7465, max 3.1452
links, paths
removed link 33631-38
success ratio: 0.7143stretch 1: avg 1.0000, max 1.0000
stretch 2: avg 1.8605, max 4.1066
stretch 3: avg 1.8605, max 4.1066
links, paths
removed link 33631-52
success ratio: 0.6786stretch 1: avg 1.0000, max 1.0000
stretch 2: avg 1.7810, max 3.8571
stretch 3: avg 1.7810, max 3.8571
links, paths
removed link 52-38
success ratio: 0.7143stretch 1: avg 1.0000, max 1.0000
stretch 2: avg 1.8002, max 3.1452
stretch 3: avg 1.8002, max 3.1452
links, paths
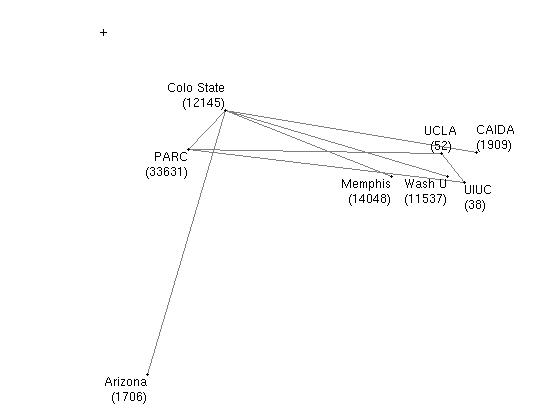
moved
The origin of the hyperbolic plane is marked by the plus sign.The "original" graph above, with the PARC and Colo State hub nodes moved closer to the center, and the Wash U leaf node moved further from the center.
nodesfull graph
success ratio: 1.0000stretch 1: avg 1.0000, max 1.0000
stretch 2: avg 1.4175, max 2.0340
stretch 3: avg 1.4175, max 2.0340
links, paths
removed link 33631-38
success ratio: 0.8929stretch 1: avg 1.0000, max 1.0000
stretch 2: avg 1.5169, max 3.0874
stretch 3: avg 1.5169, max 3.0874
links, paths
removed link 33631-52
success ratio: 0.8929stretch 1: avg 1.0000, max 1.0000
stretch 2: avg 1.5344, max 3.1368
stretch 3: avg 1.5344, max 3.1368
links, paths
removed link 52-38
success ratio: 1.0000stretch 1: avg 1.0000, max 1.0000
stretch 2: avg 1.4355, max 2.0340
stretch 3: avg 1.4355, max 2.0340
links, paths
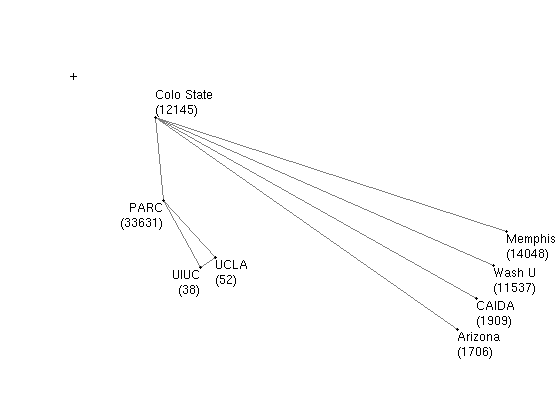
manual
The origin of the hyperbolic plane is marked by the plus sign.The CCN testbed graph with hyperbolic coordinates assigned manually to better match their position in the CCN topology.
nodesfull graph
success ratio: 1.0000stretch 1: avg 1.0000, max 1.0000
stretch 2: avg 1.0550, max 1.1944
stretch 3: avg 1.0550, max 1.1944
links, paths
removed link 33631-38
success ratio: 1.0000stretch 1: avg 1.0000, max 1.0000
stretch 2: avg 1.1922, max 2.8580
stretch 3: avg 1.1922, max 2.8580
links, paths
removed link 33631-52
success ratio: 1.0000stretch 1: avg 1.0000, max 1.0000
stretch 2: avg 1.1951, max 2.8580
stretch 3: avg 1.1951, max 2.8580
links, paths
removed link 52-38
success ratio: 1.0000stretch 1: avg 1.0000, max 1.0000
stretch 2: avg 1.0578, max 1.1944
stretch 3: avg 1.0578, max 1.1944
links, paths