

IPv4 and IPv6 AS Core: Visualizing IPv4 and IPv6 Internet Topology at a Macroscopic Scale in 2010
Since 2000, CAIDA has generated AS Core graphs -- Internet Topology Maps also referred to as AS-level Internet Graphs -- in order to visualize the shifting topology of the Internet over time, as can be seen in the historical view.
Presented below is CAIDA's 2010 visualization of both IPv4 and IPv6 Internet topology at the Autonomous System (AS) level.
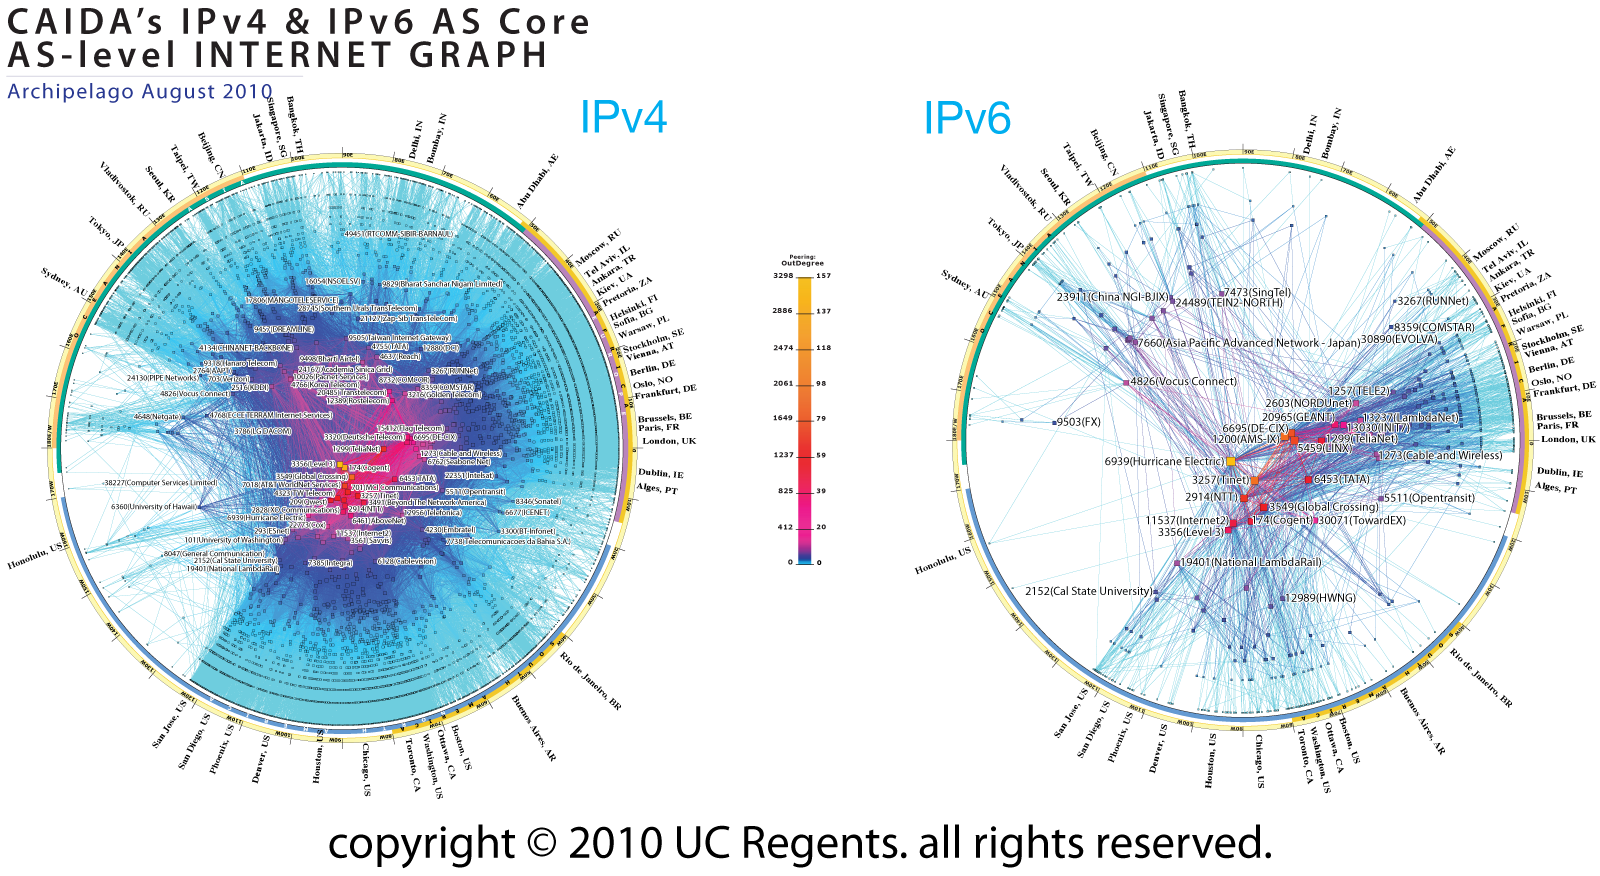 Figure 1. IPv4 and IPv6 AS Core August 2010.
Data Source
This visualization represents macroscopic snapshots of IPv4 and IPv6 Internet topology samples captured in 2010. The plotting method illustrates both the extensive geographical scope as well as rich interconnectivity of nodes participating in the global Internet routing system.
For the IPv4 map, CAIDA collected data from 45 monitors located in 24 countries on 6 continents. Coordinated by our active measurement infrastructure, Archipelago (Ark), the monitors probed paths toward 174 million /24 networks that cover 96% of the routable prefixes seen in the Route Views Border Gateway Protocol (BGP) routing tables on 1 August 2010.
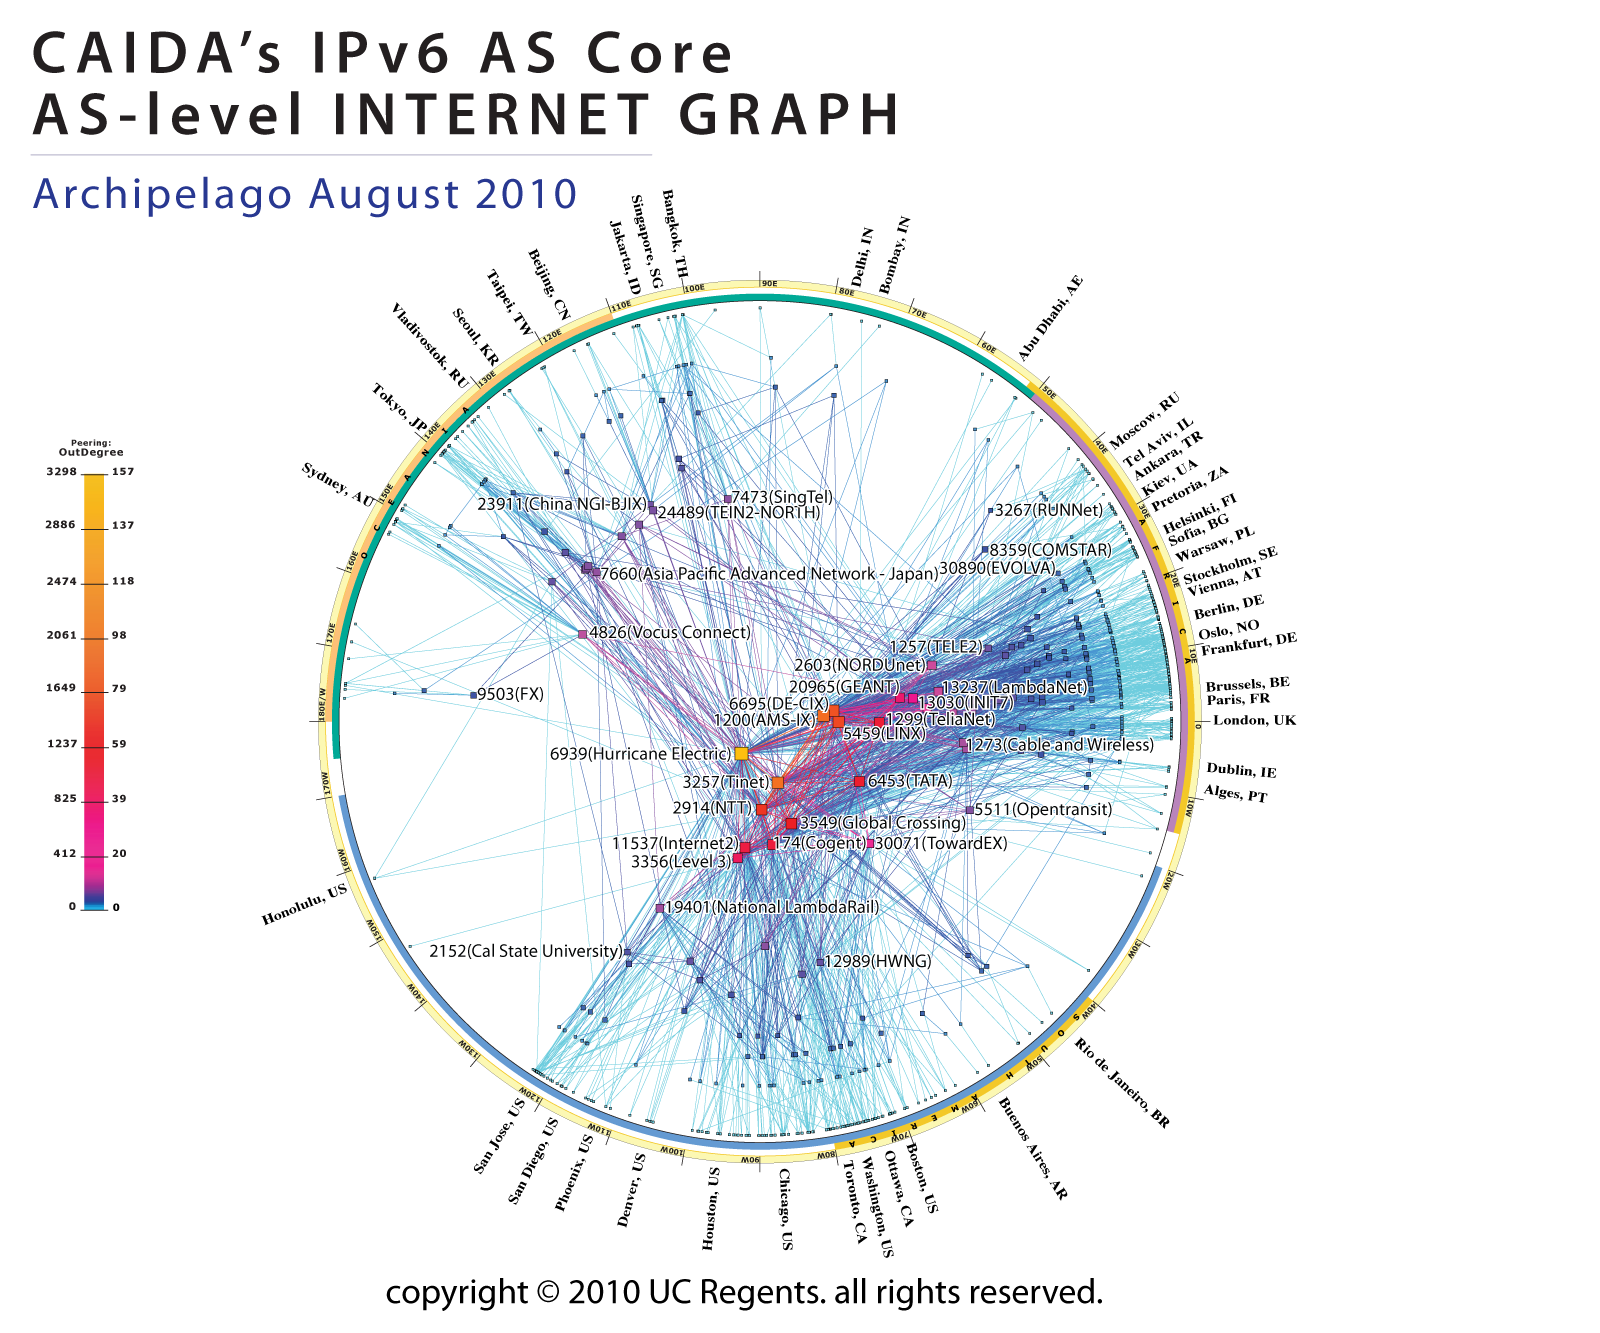
For the IPv6 map, CAIDA collected data from 12 Ark monitors located in 6 countries on 3 continents. This subset of monitors probed paths toward 307 thousand IPv6 prefixes which represent 99.6% of the globally routed IPv6 prefixes seen in Route View's BGP tables on 1 August 2010.
We aggregate this IP-level data to construct IPv4 and IPv6 Internet connectivity graphs at the Autonomous System (AS) level. Each AS approximately corresponds to an Internet Service Provider (ISP). We map each observed IP address to the AS responsible for routing traffic to it, i.e., to the origin (end-of-path) AS for the IP prefix representing the best match for this address in BGP routing tables collected from Route Views.
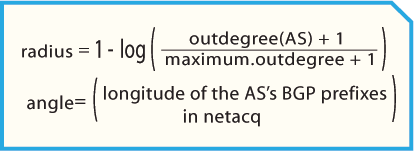
Figure 2. Coordinates of AS in AS core.
The position of each AS node is plotted in polar coordinates (radius, angle) calculated as indicated in Figure 2, on the right.
Our IPv6 graph grew from 515 AS nodes in January 2009 to 948 nodes in August 2010 (84% growth). Over the same period, the number of ASes in our IPv4 graph grew 22%, from 23K to 28K.
Most ASes grew their observed peering degree in both our IPv4 and IPv6 graphs, although at different rates, which alters their relative degree-based rank over time. In the IPv4 graph, AS 3356 remained dominant, with the largest observed degree in both 2009 and 2010. The second and third largest ASes, AS 174 and AS 3549, also maintained the same observed degree relative to the largest degree AS (3356) for the last two years. In contrast, ASes 7018, 701, and 1239 saw observed peering degree declines relative to the largest degree AS 3356, slipping to 4th, 5th, and 7th place. Note that we rank each AS independently; some network providers have topology spread across multiple ASes. A more accurate topology-based ranking of providers would require a validated list of AS ownership -- data not currently available.
The observed IPv6 AS ranking experienced greater change. AS 6939 moved up from 2nd place in 2009 to 1st place in 2010. AS 1200 dropped from 1st to 3rd place. AS 12008 and 6175 fell out of the top ten, allowing AS 1299 and 174 to rise to 9th and 10th place. The third and fourth ranked ASes -- AS1200 and AS6695 -- are both exchange points rather than transit providers, reflecting the less mature state of the IPv6 topology, i.e., characterized by relatively fewer private peering relationships.
In neither 2009 nor 2010 are the top degree-ranked ASes the same across IPv4 and IPv6. The IPv4 core is centered primarly in the United States, while the IPv6 core includes Europe as well as the United States. We observed no high-degree "hub" IPv6 ASes in Asia, surprising given the reportedly large IPv6 deployment in Asia. This gap may reflect the geographic bias of our IPv6-capable monitor deployment: five in the US, four in Europe, and only one in Asia.
Conclusion
One of CAIDA's topology mapping project goals is to develop techniques to illustrate relationships and depict critical components of the Internet infrastructure. For more information about the topology mapping project, see: https://www.caida.org/projects/macroscopic/
For more information on methodology for ranking AS interconnectivity, see CAIDA's Introduction to Relationship-based AS Ranking.
Demonstration
If you would like to try out a demo of the CAIDA tools used to construct this graph, please see https://www.caida.org/projects/internetatlas/gallery/ascore/demo.
Poster
 PNG image, 1.1 MB) (PDF, 11.1 MB)
Acknowledgments
CAIDA Topology Mapping Analysis Team: Brad Huffaker, kc claffy
Software Development: Young Hyun, Matthew Luckie
Poster Design: Connie Lyu, Will Michaelsen