

The contents of this legacy page are no longer maintained nor supported, and are made available only for historical purposes.
Query load aggregated by continent
Figure 1, 2, 3 and 4 present another different view of the query load, this time aggregated by continent.
Figure 1 includes the load of every node in the cloud. Figure 2, 3 and 4 are separated by node.
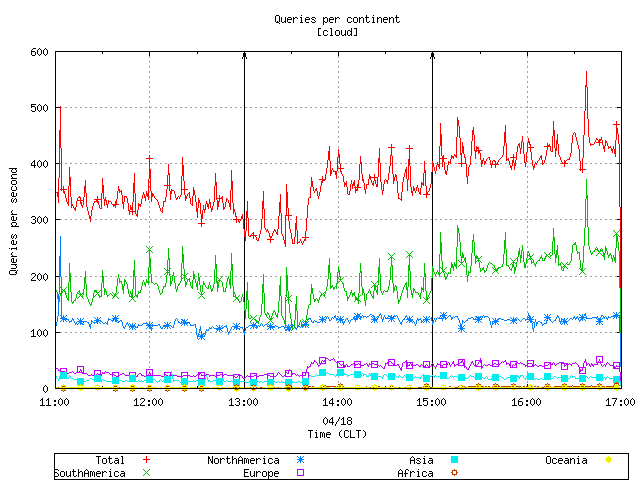
Figure 1. Query load organized by continent in every anycast node
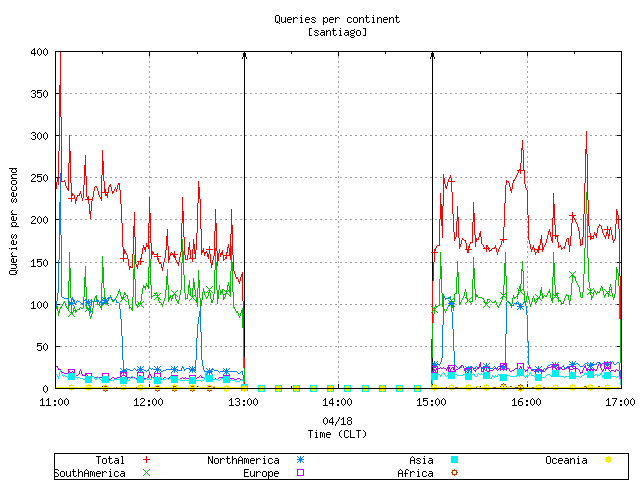
Figure 2. Query load organized by continent in santiago node
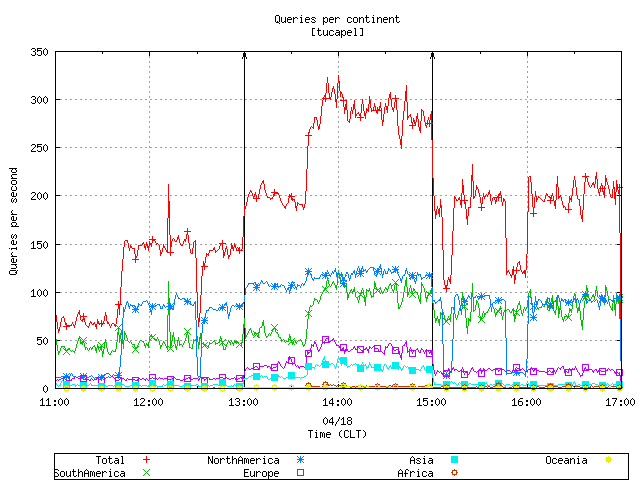
Figure 3. Query load organized by continent in tucapel node
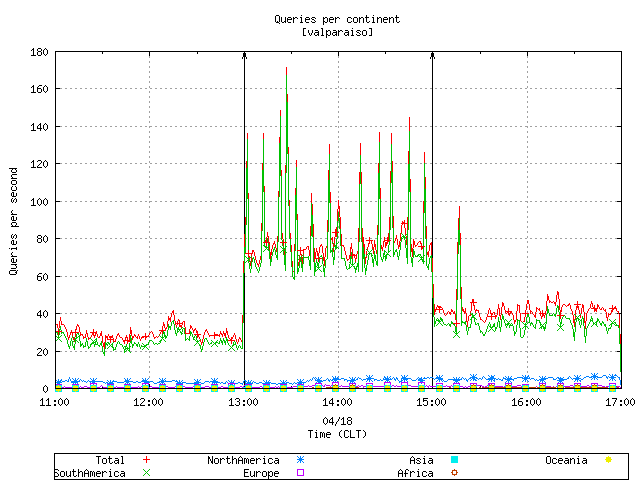
Figure 4. Query load organized by continent in valparaiso node