Anycast Switching Experiment for Chilean .CL ccTLD
Introduction
Setup of .CL anycast cloud
The DNS infrastructure for .CL located in Chile consists of one unicast node ns.nic.cl and an anycast cloud a.nic.cl organized in three nodes called "santiago", "valparaiso" and "tucapel". The unicast server and the node "santiago" are in Santiago, the capital city of Chile. The node "valparaiso" is in Valparaiso, 150 km east of Santiago. The node "tucapel" is in Concepcion, 520 km south of Santiago.
Note that the machine hosting the unicast ns.nic.cl server provides not only primary DNS service for the .CL zone, but also secondary DNS service to other Latin American ccTLDs under the name ns-ext.nic.cl. In an emergency, it could also provide DNS service as a member of the anycast cloud answering to the name ns-any.nic.cl.
Experiment
The proposed experiment consisted of three phases. First, we collected a background sample by capturing packet traces on every interface of all the nodes in the .CL anycast cloud. Next, we removed a node and watched how clients redirected their requests to the next available node. Finally, we re-introduced the removed node back into the cloud and observed how the load rebalanced after the recovery of a node.
We conducted two practice experiments that helped us to find the optimal experiment design and collection time. Our third and final experiment described in this report lasted six hours, with two hours for each phase. We determined that this duration is sufficient for the topology to converge after the shutdown and the subsequent recovery.
On April 18th 2007, from 11:00 till 17:00 CLT (15:00 till 21:00 UTC), we captured UDP queries and responses on every node and every interface of the .CL anycast cloud. We shut down the anycast node "santiago" at 13:00 CLT. The node remained deactivated for two hours. We then reintroduced the node back to the cloud at 15:00 CLT.
Results
Query load
During the six hour collection period we recorded 7,894,909 queries originating from 187,334 unique source addresses.
Figures 1 and 2 below present the query load of each node in the .CL anycast cloud binned in ten minute and one minute granularity, respectively. The vertical black lines at 13:00 and 15:00 show the start and end times of the "santiago" node removal.
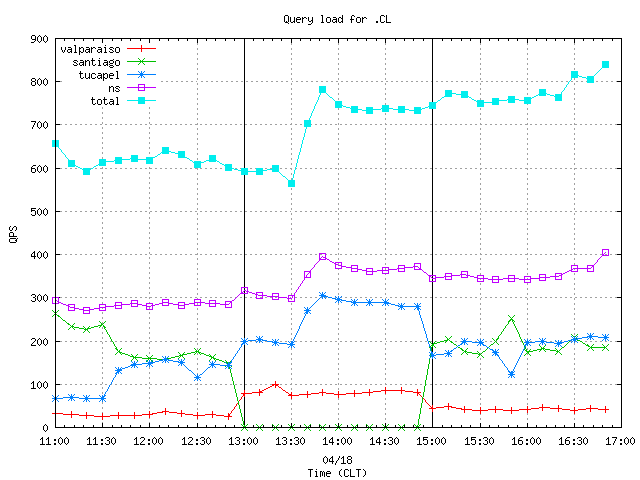
Figure 1. The query load per anycast node at 10 minute granularity.
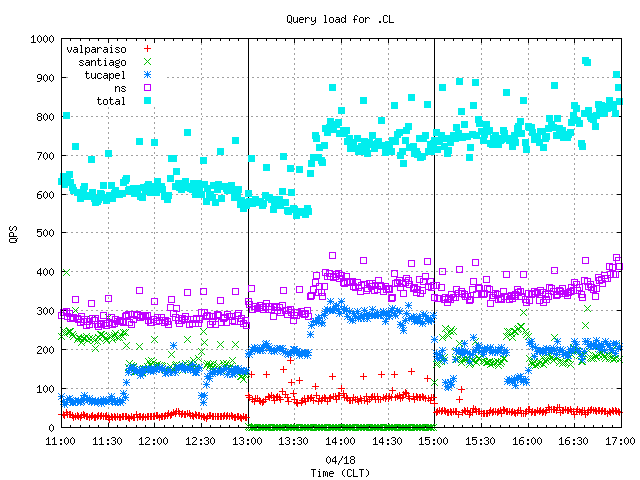
Figure 2. The query load on the anycast and unicast
servers at one minute granularity.
For comparison, Figure 3 shows the query load as measured by DNS Statistics Collector software (DSC) that is installed on all .CL servers located in Chile.
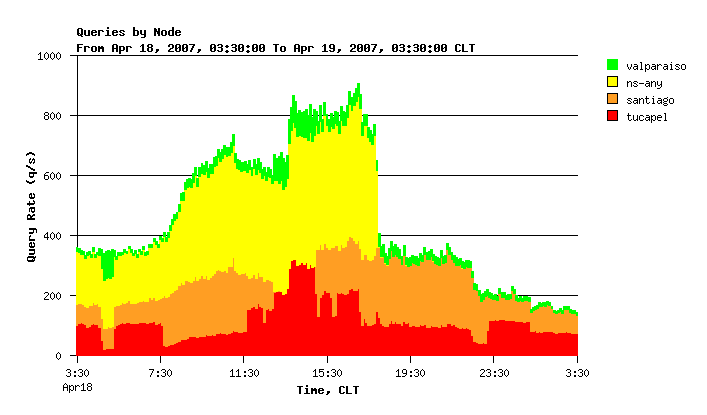
Figure 3. The query load reported by DSC.
Minutes after the end of the experiment the configuration of the collector running on the unicast server host was adjusted to include only the queries sent to the anycast address of the server. This configuration change explaining the disappearance of the yellow area in Figure 3 allowed DSC to generate separate graphs for each role of that machine (cf. Introduction).
Figure 1-3 all indicate that starting at about 13:40 CLT the query load begins to increase on every node in the anycast cloud and on the unicast server. We examined the captured packets more closely in order to explain this peak. Figure 4 showing the rate of queries by type clearly reveals that the peak is due to a sudden increase in the rate of MX queries.
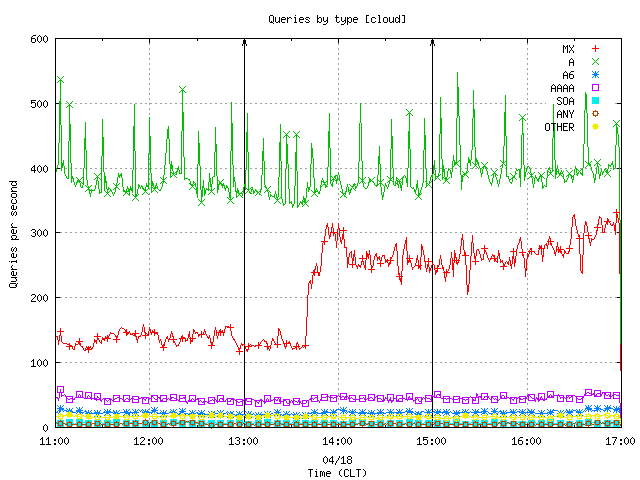
Figure 4. The query load aggregated by QTYPE.
The graph in Figure 5 is similar to the one in Figure 4 but again uses the alternative source data collected with the DSC software. From this graph we clearly see that the anomaly persisted for about 3.5 hours.
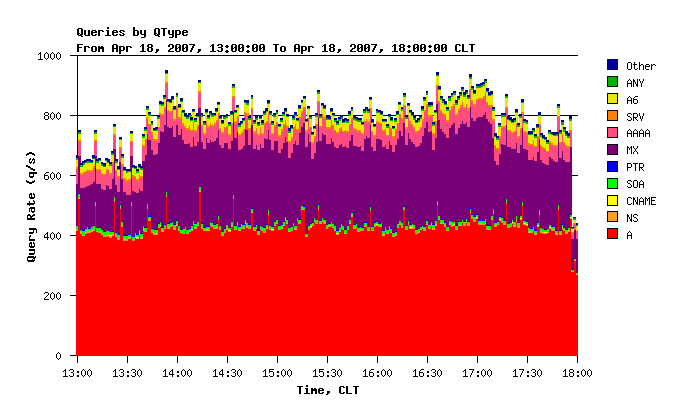
Figure 5. The query load by QTYPE as reported by DSC.
Load redistribution
While the total query load remains stable during the "santiago" node shutdown and recovery (cf. Figures 1 and 2), it gets redistributed between two other anycast nodes and to the unicast server. Figure 6 presents the percentage of the total query load handled by each individual node vs. time. i
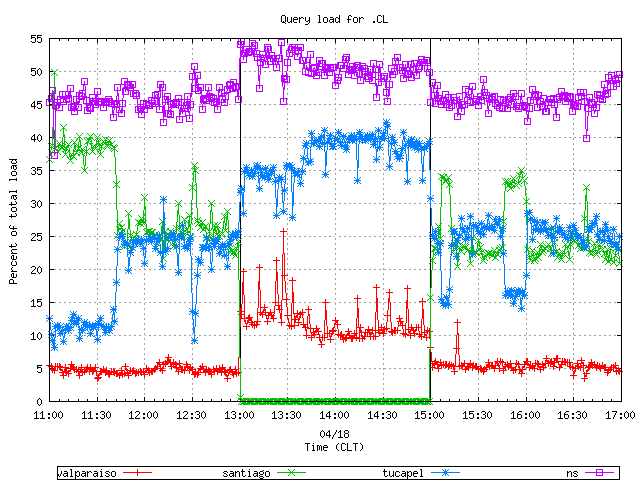
Figure 6. A distribution of the combined query load between the
anycast and unicast servers.
After the shutdown of the santiago node, approximately 7% of its load shifts to valparaiso, 10% to tucapel and 8% to the unicast server.
Geographic characterization of query load
We have considered the geographic origin of observed queries. Figure 7 presents the number of unique clients per second aggregated by countries. We plot the top five countries separately, group the rest as "other". Figure 7, 8 and 9 include one symbol for each 11 points to improve readability when printed in black and white. We plot this data to check if a significant number of clients left the cloud and started querying elsewhere. Separately, we graph the details of the number of unique clients querying the individual nodes of the .CL anycast cloud.
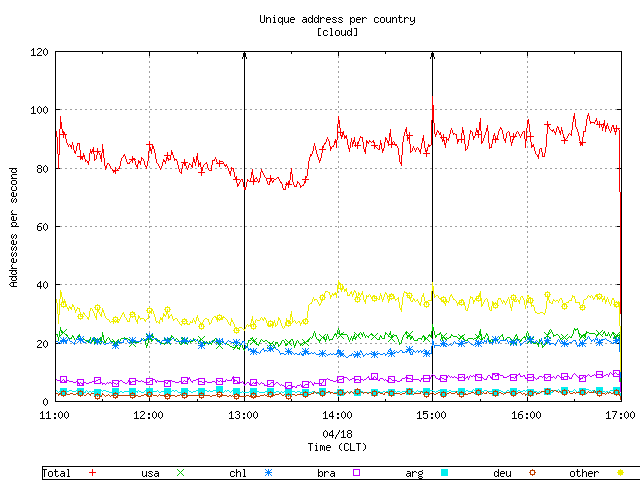
Figure 7. The rate of unique clients querying the anycast cloud.
Figure 7 shows no noticeable variation on the number of clients querying the anycast cloud at the time of shutdown or recovery.
Figures 8 and 9 graph the query load aggregated by geographic location of the clients sending queries to the anycast cloud. Figure 8 aggregates the queries by the country of the source address and plots the top five and groups the rest as "other". Figure 9 aggregates the queries by continent. Separately, we graph the details of query load per node aggregated by country and query load per node aggregated by continent.
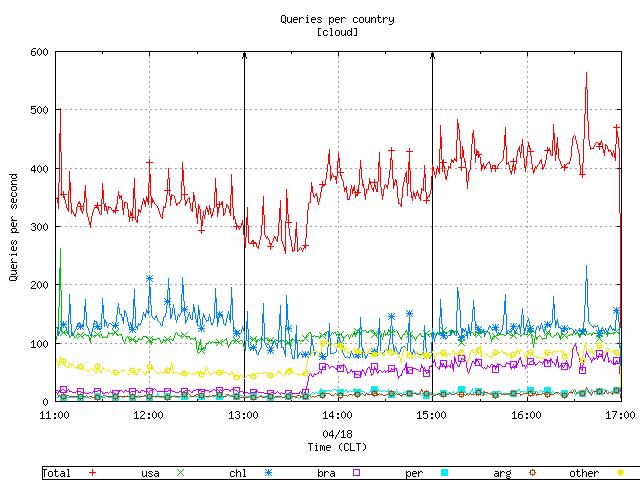
Figure 8. The query load aggregated by country.
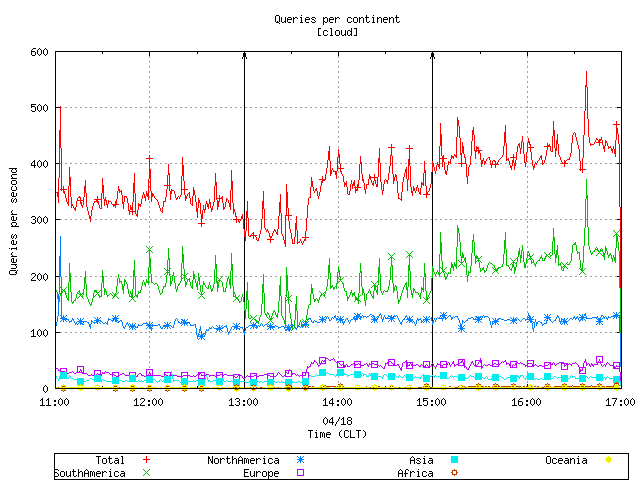
Figure 9. The query load aggregated by continent.
Figures 8 and 9 above show a spiky query rate of traffic originating from Chile and South America. Figure 10 shows the mean and standard deviation of the query rate for every client coming from Chile, and plots the top 9 by standard deviation.
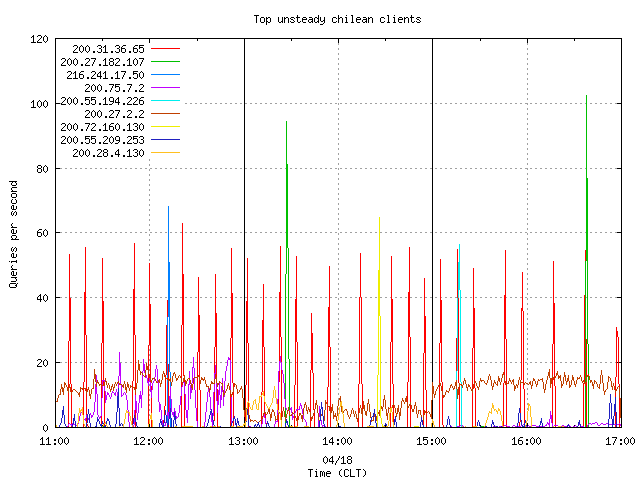
Figure 10. The top unsteady chilean clients querying the anycast cloud.
Based on the graph in Figure 10, the question arises, Why does the client 200.31.36.65 create those spikes? A closer look reveals identical queries from the client containing <IN, A, EXCH_STGO.viconto.cl> occur in bursts every 10 minutes, last around 20 seconds, and reach approximately 60 queries per second. The source address, according to the LACNIC Whois database belongs to the same company registering the domain 'viconto.cl'. Given this information, one might surmise that the problem comes from an internal client querying the local resolver and that local resolver is not authoritative for the viconto.cl zone. This allowed the internal query to "leak" to the Internet and out to the .CL nameservers.
As the second step of the analysis, we checked the spikes produced by 200.27.182.107, 200.72.160.130, 216.241.17.50, and 200.55.194.226. Each produced queries containing <IN, A, ns5.chileadmin.cl.imm.cl> and <IN, A, ns6.chileadmin.cl.imm.cl>. We can explain these queries by an incorrectly configured zone (imm.cl) where the delegation was written using relative and not FQDN (Fully Qualified Domain Names). It is worth mentioning that this configuration mistake has not been corrected at the time of writing.
Next, we checked the behaviour of the client 200.75.7.2 during the first two hours of the experiment. This client produced mainly MX queries iterating over an alphabetic-ordered domain name list. Below, Figure 11 displays the query load aggregated by country with the previously listed anomolous clients filtered out and shows a notable reduction of spikes.
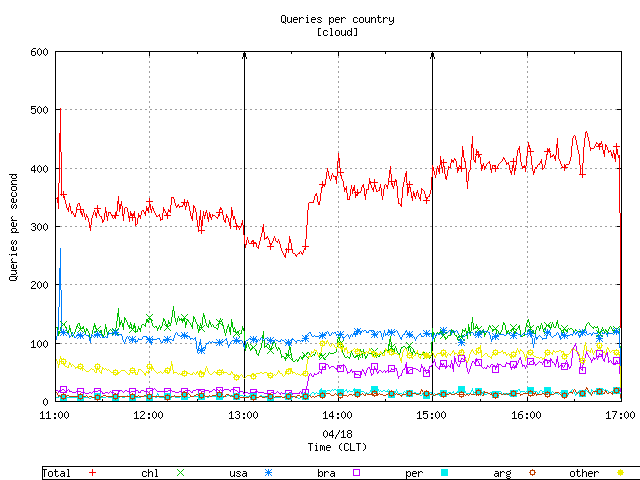
Figure 11. The query load aggregated by country with anomoloug clients filtered out.
| Queries per second | Number of unique sources |
Query load [# of queries] |
Percentage of total load |
Queries per address |
|---|---|---|---|---|
| < 0.01 | 172 790 | 647 944 | 8.207 | 3.750 |
| 0.01 - 0.1 | 11 594 | 726899 | 9.207 | 62.696 |
| 0.1 - 1 | 2 602 | 1 518 605 | 19.235 | 583.630 |
| 1 - 10 | 346 | 3 130 768 | 39.656 | 9048.462 |
| 10 - 100 | 2 | 1 870 693 | 23.695 | 935 346.500 |
| Total | 187 334 | 7 894 909 | 100.000 | 42.143 |
Table 1. The source data for Figure 5 above showing a histogram of the query rate per source.
Results of switching
We offer the following statistics from the switching experiment.
- 44 968 unique source addresses switched (24.004%)
- 72 390 total switches
- An average of 1.610 switches per unique source (which indicates that some of the clients switched and stayed despite the recovery)
-
Table 2 presents the average switching time using the TOP N most
prolific switching sources. In this particular case, the "Top 5" do
not represent common, well-behaved clients. This could be explained
by the most prolific source (207.218.205.18) showing erratic
switching behavior as presented in Figure 12.
As more clients get included in the calculations, the
average switching time converges closer to the expected values.
The distribution of query load per source address
Figure 5 presents a histogram of the number of sources versus the query rate sent from each source. A large number of the sources send only a few queries. Two clients are responsible for 23% of the total query load. Table 1 presents the data used in the histogram.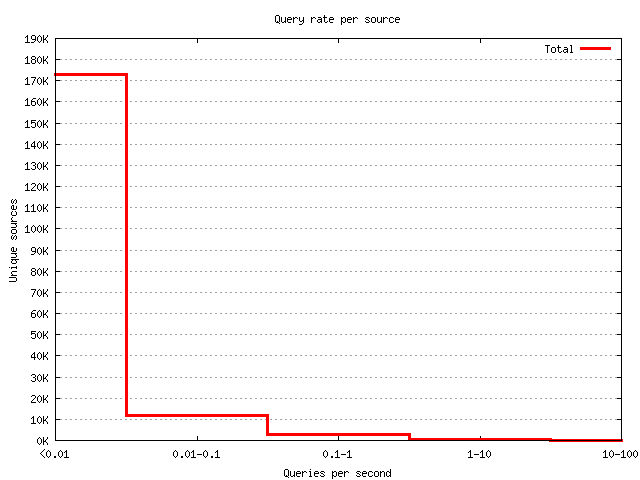
Figure 5. The query load histogram presents the number of sources versus the query rate sent from each source.
N Switch time
santiago -> tucapel
[s]Switch time
santiago -> valparaiso
[s]Switch time
tucapel -> santiago
[s]Switch time
valparaiso -> santiago
[s]Percentage of
total query load5 0.035 106.287 0.066 123.222 26.527 8 0.062 64.079 0.074 73.612 27.802 10 0.062 56.815 0.074 62.976 28.579 15 0.062 40.863 0.074 55.749 30.100 20 0.077 29.848 0.200 48.159 31.455
Table 2. The average switching time for the Top N switching sources.
Client switches per server node
Table 3 presents the number of client switches between server nodes recorded
during the experiment.
A switch is defined as a client sending a query to one node and
later sending a query to a totally different node, no matter the
time elapsed between queries.
A two way switch is defined as a client switching from one
node to another and then back. A reverse two way switch
describes a two way switch but seen from the receiving node . To
determine the total number of switches from one node to another, we
count all the single direction switches plus the two way
switches in either direction.
We asked the question, "How does the load from the node
taken down (santiago) spread across the other nodes?" The sources
moving from santiago to valparaiso generated 4.059% percent of the
query load. On the other hand, the clients switching from santiago
to tucapel generated a 22.268% of the total load.
| valparaiso -> santiago | valparaiso -> tucapel | santiago -> valparaiso | santiago -> tucapel | tucapel -> valparaiso | tucapel -> santiago | |
|---|---|---|---|---|---|---|
| One way switch | 245 | 251 | 540 | 8586 | 42 | 9752 |
| Two way switch | 1720 | 47 | 5 | 129 | 84 | 24501 |
| Reverse two way switch | 5 | 84 | 1 720 | 24 501 | 47 | 129 |
| Total | 1 971 | 382 | 2 265 | 33 217 | 173 | 34 382 |
| Percentage of queries generated by the clients switching to: | 0.952 | 1.654 | 4.059 | 22.269 | 0.816 | 2.660 |
Table 3. The number of client switches between nodes.
Switches in time
Figure 12 below illustrates the behavior of the top 5 most prolific sources sending queries to the cloud. The solid line represent the queries and the arrows represent the direction of the switch.
The address 207.218.205.18 (red line) accounts for approximately 20% of the total query load observed. Upon closer inspection, the client appears to come from a company (Everyones Internet, based in Houston TX) that provides DNS services. The company appears to be searching the namespace for available domain names to register under .CL for intellectual property protection or speculation.
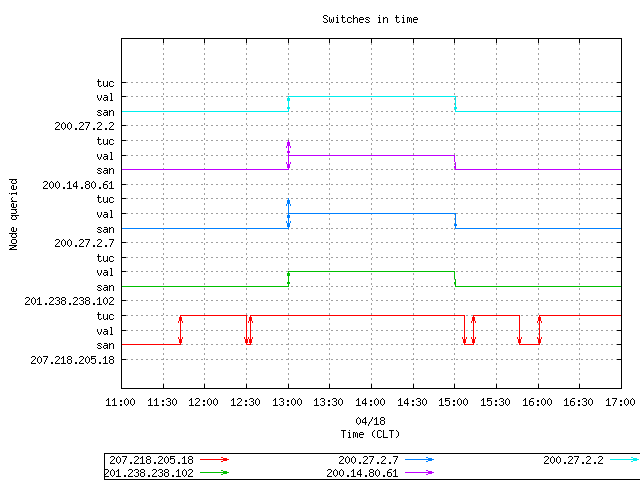
Figure 12. The behavior of the top 5 most prolific clients.
We expected the clients, after switching from the shutdown node to the next working node, to remain on the selected working node. In the case of 200.27.2.2 and 201.238.238.102 there is a round of switches back and forth before the clients select the definitive working node. In the case of 200.14.80.61 and 200.27.2.7, at the time of santiago shutdown, they switched to tucapel, then back to santiago and then to valparaiso their last selection. Client 207.218.205.18 shows a totally unexpected and erratic behavior, switching between santiago and tucapel several times. It appears that this client may have "anticipated" the shutdown, switching from the deactivated node before that happened and returning to that node after the recovery.
A closer look at the switching process
To get a sense of the downtime experienced by a client when an anycast node (santiago) becomes unavailable, we inspected the queries originated by the top five most prolific switching client sources. We calculate and graph the time elapsed between the node shutdown and the last query received at the shutdown node. We also show the first queries received on the node once we reintroduced it into the cloud. Given the erratic behavior of 207.218.205.18 as shown in Figure 12, we omitted this client from the graph and replaced it with the client 200.142.99.6.
The shutdown
Figure 13 presents the queries received by the anycast cloud from the selected sources starting 60 seconds before and ending 90 seconds after the shutdown. The vertical line at 0 designates the shutdown time.
Table 4 presents the exact time elapsed between the shutdown and the last query seen on the deactivated node. Note an "overlap" between last seen query time and switch time. That could be explained by a clock skew of aroud +0.6 seconds, despite the use of NTP.
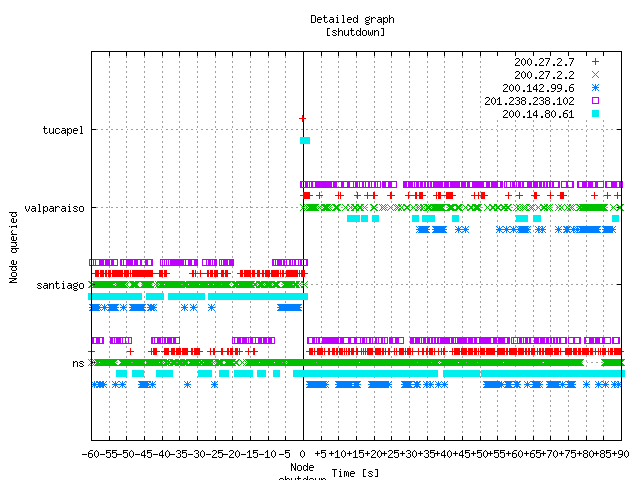
Figure 13. The destination of queries around the time of the shutdown.
| IP Address | Elapsed Time* | Switching Time [s] |
|---|---|---|
| 200.27.2.7 | 0.307 | 0.071 |
| 200.27.2.2 | 0.341 | 0.114 |
| 200.142.99.6 | < 0 | 32.767 |
| 201.238.238.102 | 0.355 | < 0 |
| 200.14.80.61 | 0.355 | 13.319 [0.039] |
Table 4. The switching time during the node (santiago) shutdown.
* The elapsed time between the server node shutdown and receipt of the last recorded query.
The recovery
Figure 14 shows the queries returning to the server node (santiago) upon its reappearance into the anycast cloud.
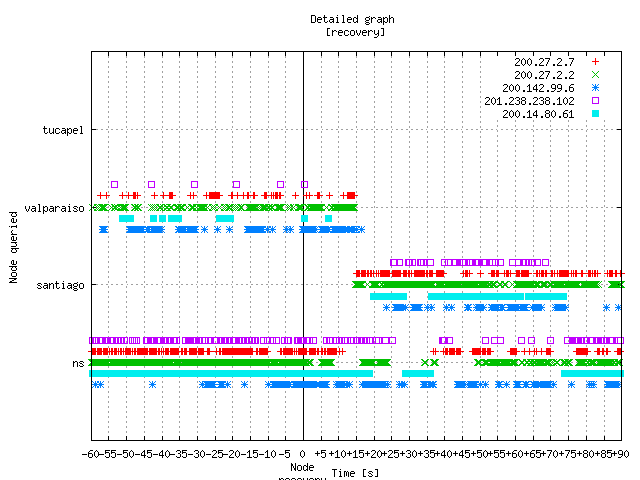
Figure 14. The queries received by the server node (santiago) upon its return to service.
At this point we define "convergence time" as the time elapsed between the return in service of the node and the first query received on that node.
| IP Address | Convergence Time | Switching Time [s] |
|---|---|---|
| 200.27.2.7 | 14.543 | 0.416 |
| 200.27.2.2 | 14.403 | 0.239 |
| 200.142.99.6 | 16.493 | 7.007 |
| 201.238.238.102 | 0.358 | 24.961 |
| 200.14.80.61 | 7.196 | 12.61 |
Table 5. The switching time after recovery of the server node (santiago).
Conclusions
- We find the transition period of the shutdown is surprinsingly short, approximately one second taking into account the clock skew. If we designate the shutdown as a critical event, having one second of unavailability for .CL clients is a good metric of stability and reliability of the service provided by NIC Chile to the chilean community.
- At the time of the recovery, a lower convergence time could be seen (around 14 seconds compared with around 23 second on the first experiment).
-
During the shutdown and restore of the (santiago) node, we detected a change in the query rate for a couple of clients. One potential explanation for this behavior is that traffic was directed "somewhere else". Considering the .CL name server architecture, the unicast server in Chile, named "ns.nic.cl" is the likely natural candidate for this traffic.
Figure 13 shows a reduction in the "density" of points for clients 200.27.2.7 and 200.142.99.6 after the shutdown. The query rate of these two clients to node "santiago" is not preserved when they move to node "valparaiso". At the same time, density observed in "ns.nic.cl" for the same clients increases after the shutdown.
At the time of shutdown and recovery, the total query load on all nodes did not change, but the distribution among nodes, as presented in Figure 6, shows an increase in the load on "ns.nic.cl". At the recovery, the query load returns to the level seen before the shutdown.
We conclude that part of the load seen by the anycast cloud moved to the unicast server, probably selected by the clients based on a lower RTT.
Additional Content
The Number of Unique Clients Querying the Individual Nodes of the .CL Anycast Cloud
Figures 1, 2, and 3 below present the number of unique clients per second seen by each node in the Anycast cloud.

Figure 1. The number of unique addresses querying the santiago node.

Figure 2. The number of unique addresses querying the tucapel node

Figure 3. The number of unique addresses querying the valparaiso node.
The Query Load Aggregated by Country Per .CL Anycast Node
Figures 1, 2, and 3 below present a view of the query load aggregated by country. To avoid cluttering the graph with lines, we select the top five (5) countries and include the rest as "other".

Figure 1. The query load aggregated by country for the santiago node.

Figure 2. The query load aggregated by country for the tucapel node.
Query load aggregated by continent
Figure 1, 2, 3 and 4 present another different view of the query load, this time aggregated by continent.
Figure 1 includes the load of every node in the cloud. Figure 2, 3 and 4 are separated by node.

Figure 1. Query load organized by continent in every anycast node

Figure 2. Query load organized by continent in santiago node

