

The contents of this legacy page are no longer maintained nor supported, and are made available only for historical purposes.
The Number of Unique Clients Querying the Individual Nodes of the .CL Anycast Cloud
Figures 1, 2, and 3 below present the number of unique clients per second seen by each node in the Anycast cloud.
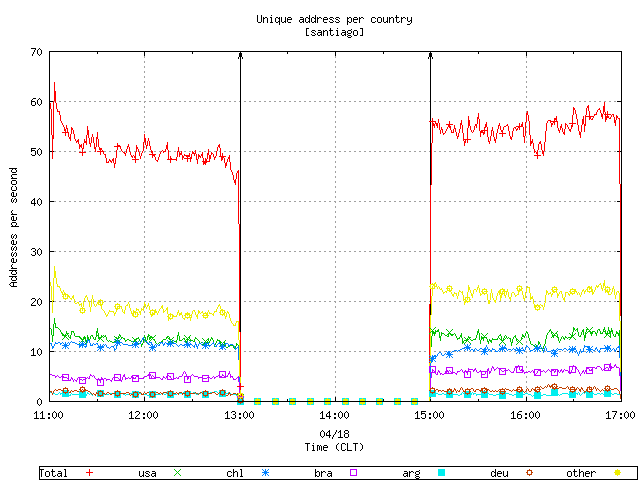
Figure 1. The number of unique addresses querying the santiago node.
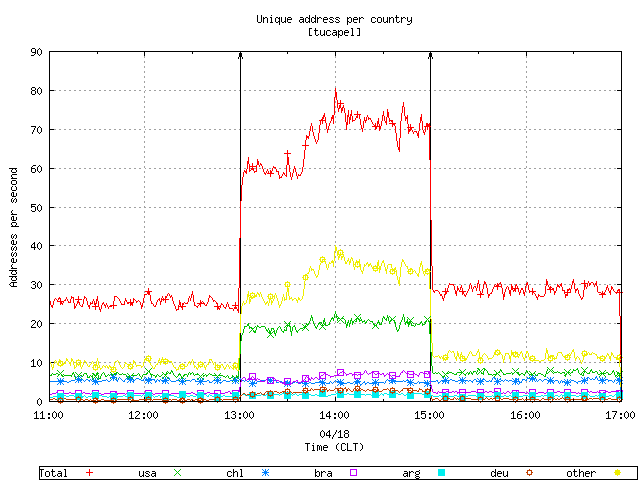
Figure 2. The number of unique addresses querying the tucapel node
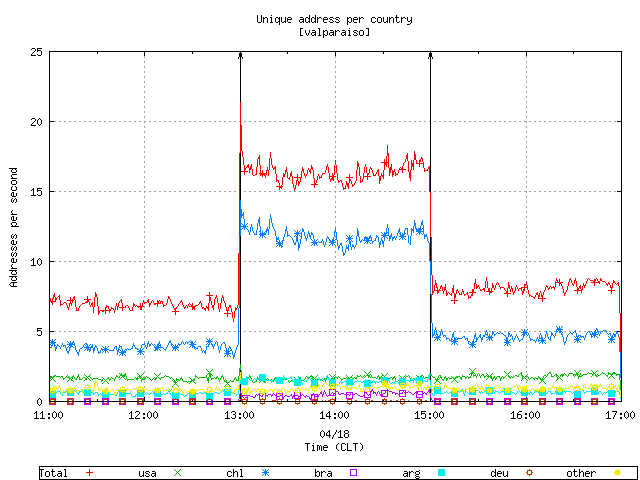
Figure 3. The number of unique addresses querying the valparaiso node.