

A Comparison of Traffic from the DNS Root Nameservers as Measured in DITL 2006 and 2007
Introduction
In pursuit of models of the nature and evolution of traffic at the Domain Name Service (DNS) root nameservers, this report uses traces collected during DITL 2006 and DITL 2007 to present a comparison of several parameters, including query rate, client rate, query type distribution, percentage of clients switching between anycast instances, client persistence, traffic validity, EDNS support and EDNS buffer size. We hope these collection events and the resulting data and analysis inspire further interest in three endeavors: empirical study of the Internet; investment required to support macroscopic Internet measurements from strategic points around the world; and progress on answering questions of interest to technology and policy researchers.
General Statistics
Table 1 below presents general statistics that describe the 2006 and 2007 DITL datasets. Of note, with nearly identical numbers of instances measured, the 2006 dataset contains nearly twice the duration of the 2007 dataset, yet the query counts and number of unique clients show near identical values, indicating a near doubling of traffic.
| DITL 2006 | DITL 2007 | ||
|---|---|---|---|
| Root Servers | Root Servers | ORSN | |
| Dataset duration | 47.2 h | 24 h | 24 h |
| Number of instances: observed/total |
C: 4/4 F: 34/37 K: 17/17 |
C: 4/4 F: 36/40 K: 15/17 M: 6/6 |
2/13 |
| Query count | 3.86 billion | 3.84 billion | 4.1 million |
| Unique clients | ~2.8 million | ~2.8 million | 1 650 |
| Recursive Queries | 4.02 % | 17.04 % | 11.59 % | TCP |
| Bytes | 1.40 % | 1.65 % | 0.17 % |
| Packets | 2.26 % | 2.67 % | 0.22 % |
| Queries | ~221 K | ~700 K | 48 |
| Queries from RFC1918 address space |
2.73 % | 4.26 % | 0.3 % |
| Table 1. A comparison of general statistics describing the 2006 and 2007 DITL datasets. | |||
Mean Query Rates
Figure 1 below presents the mean query rates observed at 50 instances of the C, K and F root servers that participated in both DITL 2006 and 2007 collection events. The instances are ordered by their 2006 query rates. For 24 instances, the query rate increased by at least 50%. For 13 instances, query rate decreased by up to 70%. Here, we provide the full listing of the mean query rate variation data.
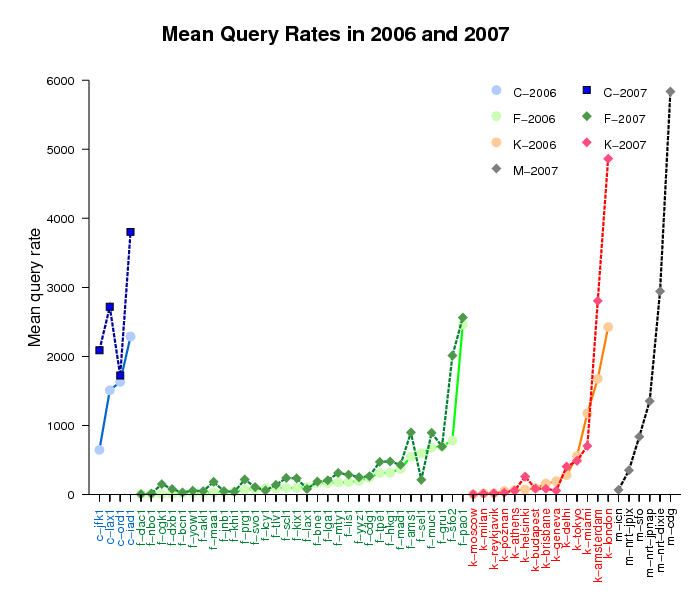
Figure 1. Mean query rates observed at 50 instances of
the C, F, K, and M root servers in 2006 and 2007.
Mean Client Rates
Figure 2 below presents the mean client rates observed at the same 50 instances as in Figure 1 above, displayed in the same order. For 36 instances, the unique client rate increased, and for 17 of them the increase was at least 50%. Fifteen instances saw the mean client rate decrease by as much as 51.3%. Here we provide the full listing of the mean client rate variation data.
Comparing Figures 1 and 2, we note that the query rates and the client rates generally do not correlate. Some instances exhibit an increase in traffic and a decrease in clients.
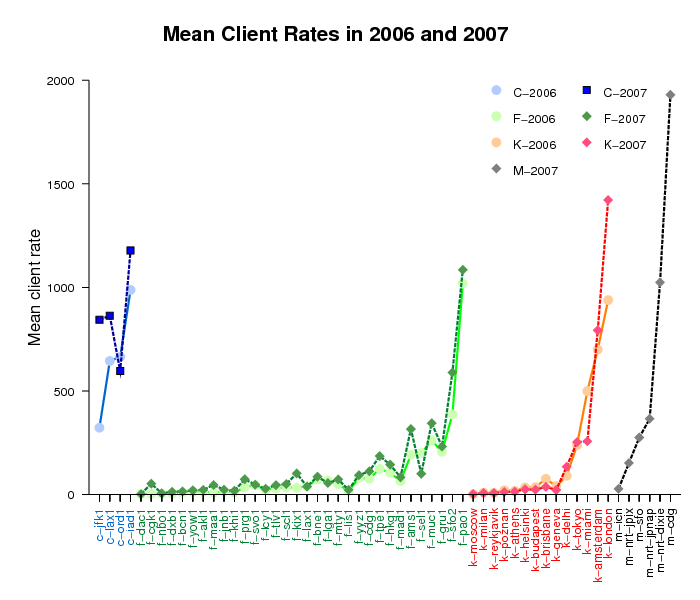
Figure 2. Mean client rate observed at 50 instances of
the C, F, K, and M root servers for the DITL 2006 and 2007 datasets.
Query/Client Ratios
To compare the query load in traces of different durations, we calculate the ratio of the average number of queries to the average number of unique clients per instance. Figure 3 below shows the results of these calculations. On average, we show three queries per client, but some instances (f-lis1, k-helsinki, f-dxb1, f-mad1, f-scl1, f-mty1, k-athens, f-maa1) serve much busier clientele.
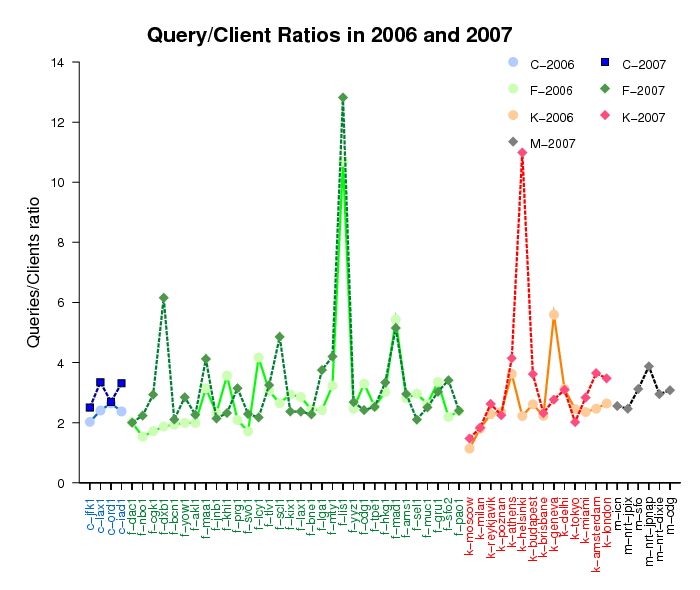
Figure 3. Query/client ratios observed at 50 instances of
the C, F, K, and M root servers for the DITL 2006 and 2007 datasets.
Distribution of Clients by the Number of Anycast Instances Queried
The majority of clients ( approximately 99%) use from one to four instances of the DNS root servers for their requests. In 2007 data, we see an increase in the number of clients sending queries to four instances or more. The 2007 dataset includes capture of 6 global instances of M-root that were not in the 2006 dataset, so it presents a slightly more complete picture of client behavior.
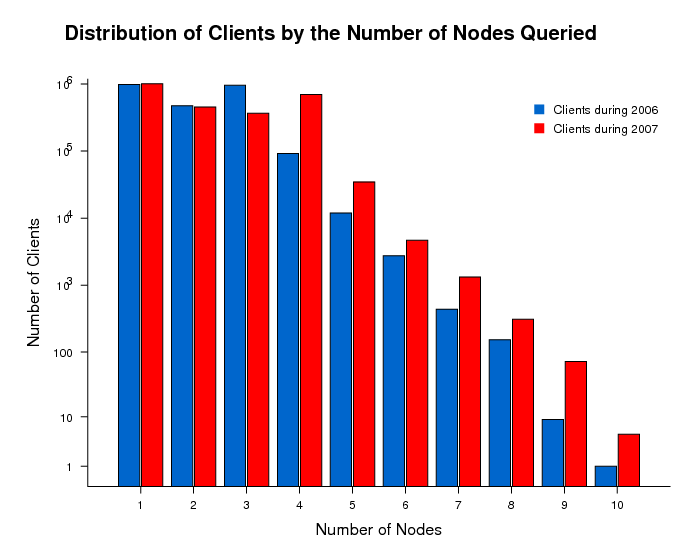
Figure 4. Distribution of clients by the number of nodes queried in
the DITL 2006 and 2007 datasets.
Switching Instances Within Anycast Cloud
The multiple instances of an anycast root nameserver form an anycast
cloud. Figure 5 below displays the percentage of clients that
switch instances within a single observed anycast cloud.
While a client's application
selects which root server to use, it is the global routing system
that routes each request to a particular anycast instance of the
selected root server. Between 2006 and 2007, the percentage of
clients switching instances within the same anycast cloud dropped
by a factor of 2 or more. This decrease is indicative of a more
stable global routing system and is consistent with
Verisign's observations of the J-root server behavior.
A more detailed analysis of a sample (of 20-30) of the instances
switches confirmed that most of them were triggered by changes
in the announcement of the prefix containing the client address.
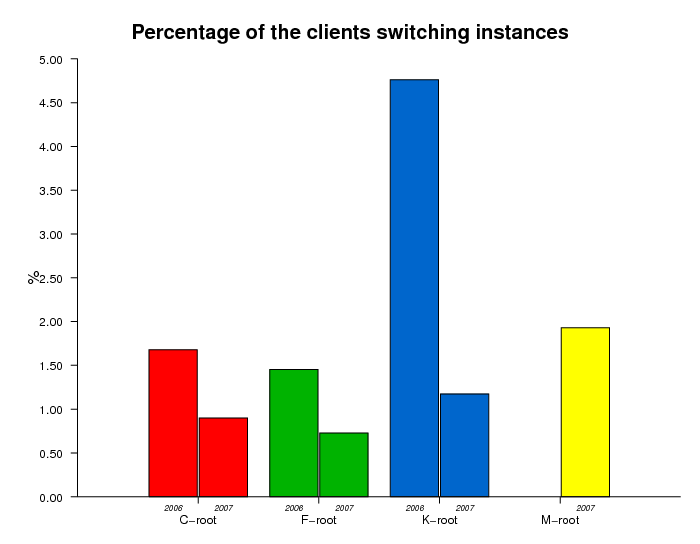
Figure 5. Percent of clients switching instances within the anycast clouds
in the DITL 2006 and 2007 datasets.
Client Persistence
For the C, F, and K root servers, we analyzed the "persistence" of clients, defined as those using the same anycast cloud or the same anycast instance in 2006 and 2007. Blue, orange, and green colors show clients observed in both datasets, only in 2006, and only in 2007, respectively.
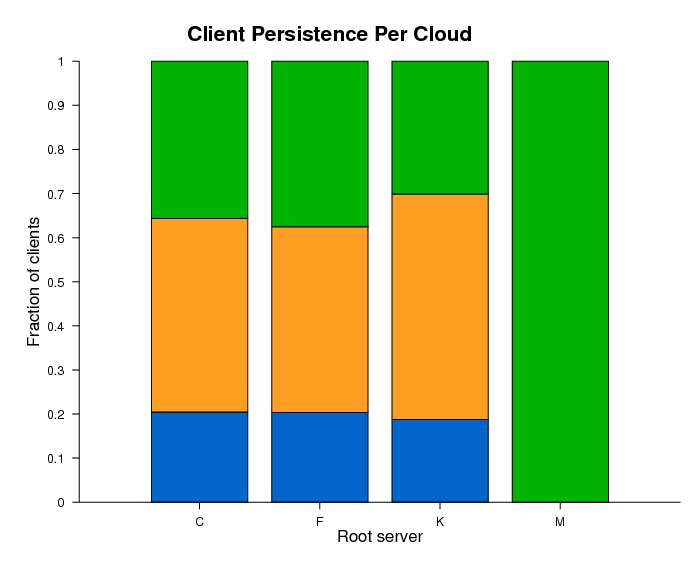
Figure 6a. Clients querying four DNS root anycast clouds in
the DITL 2006 and 2007 datasets.
Blue, orange, and green colors show clients observed in both
datasets, only in 2006, and only in 2007, respectively.
Figure 6a shows that approximately 20% of clients sent requests to the same anycast cloud in both 2006 and 2007, 45-50% of clients queried a particular anycast cloud only in 2006, and the remaining 30-35% of clients we observe only in the 2007 data.
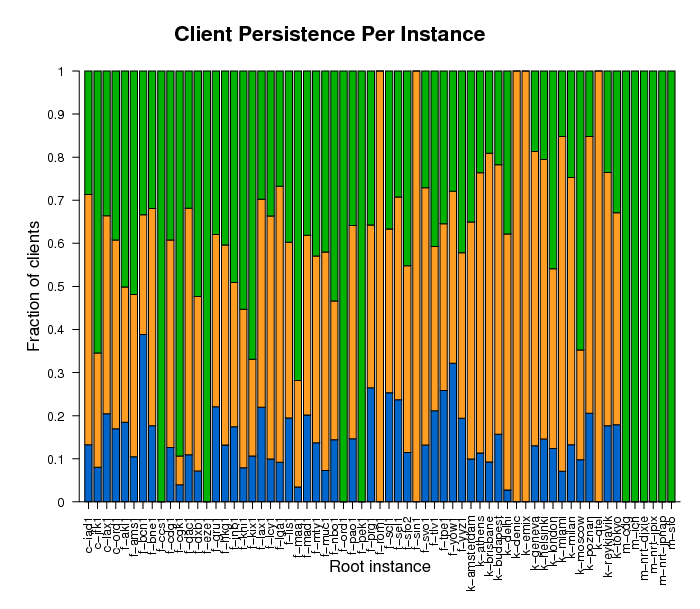
Figure 6b. Persistence of clients querying anycast instances
the DITL 2006 and 2007 datasets.
Blue, orange, and green colors show clients observed in both
datasets, only in 2006, and only in 2007, respectively.
Figure 6b shows high variability in the persistence of clients by instance. It also shows which instances were observed only in 2006 (f-sin1, f-rom1, k-qtel, k-emix, k-denic) and which were observed only in 2007 (f-ccs1, f-eze1, f-ord1, f-pek1 and all M-root instances).
Distribution of Queries by Query Type
The DNS root nameservers receive various types of queries;
both valid and invalid. Figure 7 displays the distribution of these
queries by query type. For all four anycast clouds in our analysis,
A-type queries that request an IPv4 address mapping for a hostname
are the most common (about 60% of the total) and their fraction
remains stable across 2006 and 2007. The fraction of SOA-type queries,
which request the start of authority for a zone, i.e.,
which DNS server provides authoritative answers about
a specified domain, decreased slightly from the 2006 to
2007 datasets. MX queries, which ask which host acts as
the mail exchange server for a domain, increased their fraction
for C-root and K-root and decreased their fraction for F-root,
between the 2006 and 2007 datasets.
We notice a slight increase in AAAA-type queries, which
map an IPv6 address to a hostname, on all four root servers.
We attribute this increase to more clients using operating systems
with native IPv6 capabilities such as Apple's MacOSX®
and Microsoft's Windows Vista®.
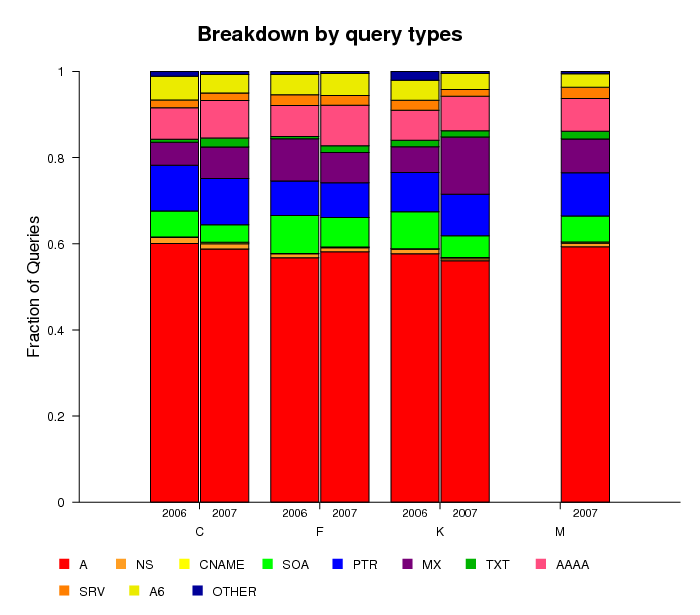
Figure 7. Distribution of queries by query type for DITL 2006 and 2007 datasets.
Distribution of Source Port Numbers
When clients execute queries to the Domain Name Services (DNS), they must select a source port to establish the data connection and receive the response. Figure 8 shows the distribution of source port numbers used by clients. The vast majority of queries use port numbers 53, 1024, 32768, and 32769. Unless configured with a fixed port number, the selection of the source port for outgoing UDP packets depends on the operating system implementation. Typical ranges used by different OSes are: 1024-4999, 1024-65535, 32768-65565, and 49152-65565. The peak mode at port 53 indicates the presence of old BIND 8 clients or administrators explicitly using that configuration. Per RFC 768, source port 0 is reserved, but some TCP/IP stack implementations allow programs to use it. Also some scanning programs explicitly use it as a source port. Queries from port 0 represent <1% of all queries.
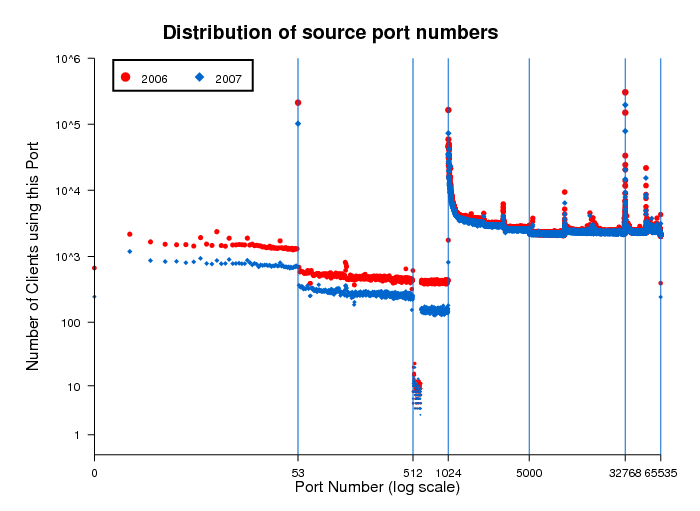
Figure 8. This plot shows the distribution of source port numbers selected by clients.
Distribution of Clients by Query Rate
A distribution of query rates across clients hints at client demand and [mis]behavior. Figures 9a and 9b show the binned distribution of clients by their average query rate during the observation period, differentiated by query rate intervals shown on the X-axis. The Y-axis is in log scale and shows the percentage of total clients in each query interval on the left, and the percentage of total queries sent by the clients in that interval on the right. Both distributions are highly skewed: 95% of clients have query rates less than 1 in 100 seconds and produce about 7% of the observed query load. Yet <0.1% of clients have query rates greater than 1 per second and these chatty clients are responsible for approximately 50% of the total load in the 2006 dataset and approximately 60% of the total load in 2007 dataset.
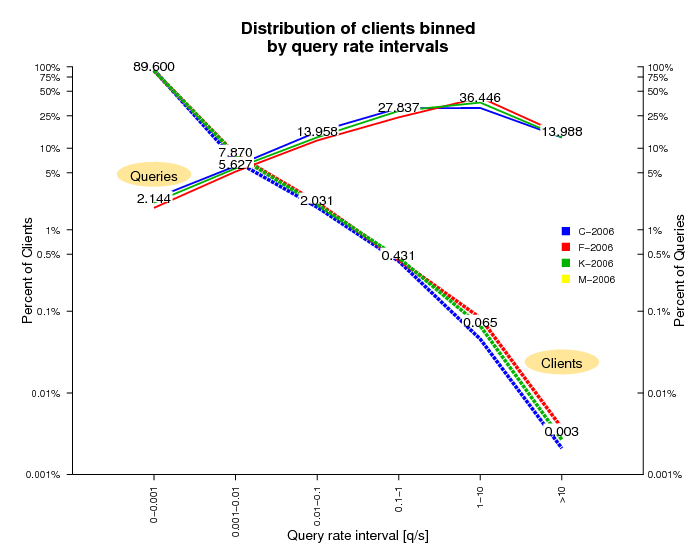
Figure 9a. This figure shows the distribution of clients in the DITL 2006 dataset binned by query rate intervals.
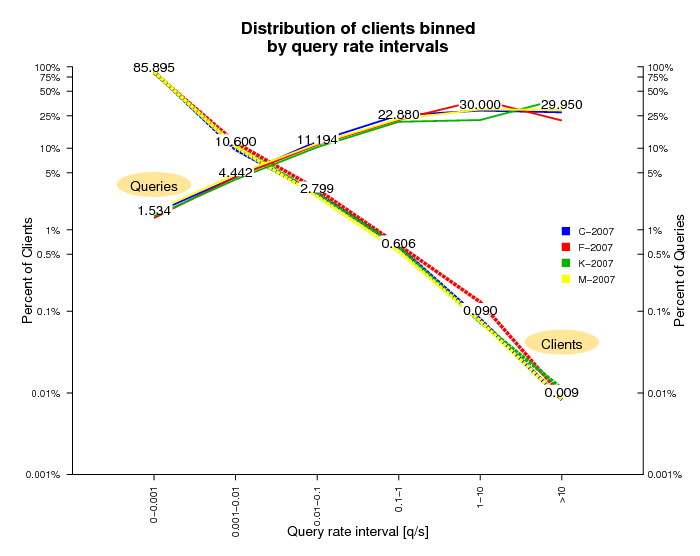
Figure 9b. This figure shows the distribution of clients in the DITL 2007 dataset binned by query rate intervals.
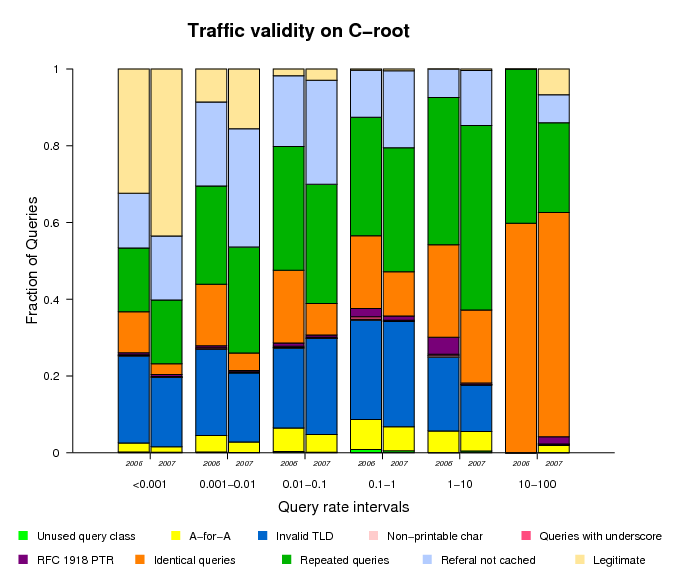
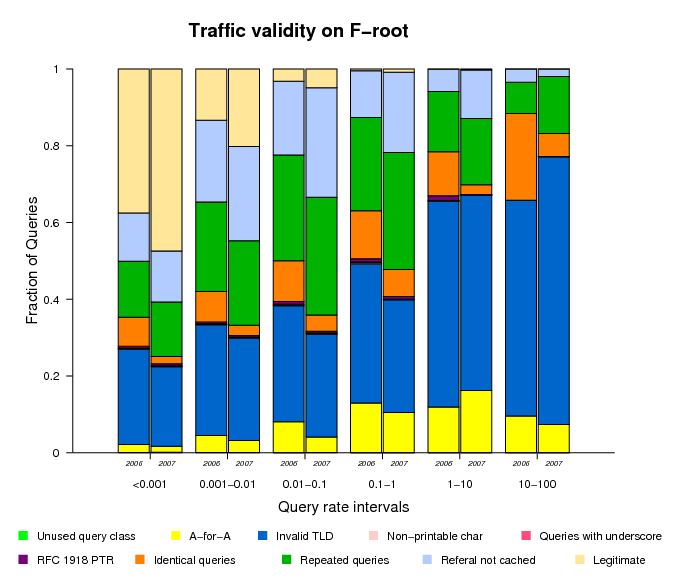
Traffic Validity
As mentioned above, the DNS root nameservers receive many types of both valid and invalid queries. To better understand and characterize the invalid traffic, we classified invalid queries into the following categories:
- Unused query class
A query with a class not included in the 5 currently defined (RFC 2929, section 3.2) - A-for-A
A query of type A where the query ''name'' is already an IPv4 address. e.g. <IN, A, 192.16.3.0> - Invalid TLD
A query for a name with an invalid TLD, based on the list published by IANA. e.g. <IN, MX, localhost.lan> - Non-printable characters
A query for a name with characters that are not alphanumeric or dash. <IN, A, www.ra^B.us> - Queries with underscore
to show the wide use of the invalid _ symbol. <IN, SRV, _ldap._tcp.dc._msdcs.SK0530-K32-1.> - RFC 1918 PTR
A query of type PTR for an IPv4 address from private address space. e.g., <IN, PTR, 171.144.144.10.in-addr.arpa> - Identical queries
A query having the same type, class, name and id as a previously seen one. There is no time limit to count an identical query. - Repeated queries
A query having the same type, class and name as a previously seen one. There is no time limit to count a repeated query. - Referral not cached
If a client sends a query such as <A, IN, www.ucsd.edu> and later a query for <MX, IN, mail.mit.edu> the 2nd one is counted as ''referral not cached'' because that client should keep a copy of the referral answer pointing to the .edu authoritative nameservers.
Classifying all queries observed in our traces is prohibitively expensive in terms of required disk space and running time. Therefore, we use a sample composed of the queries sent by 10% of the source addresses targeting each root server.
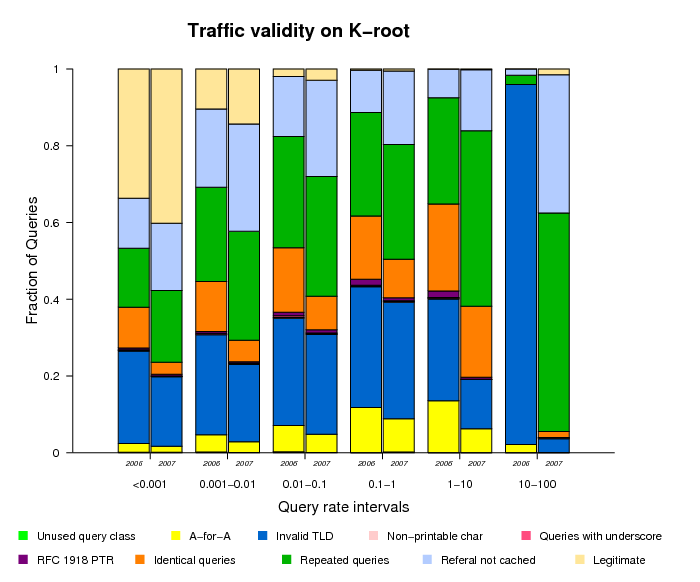
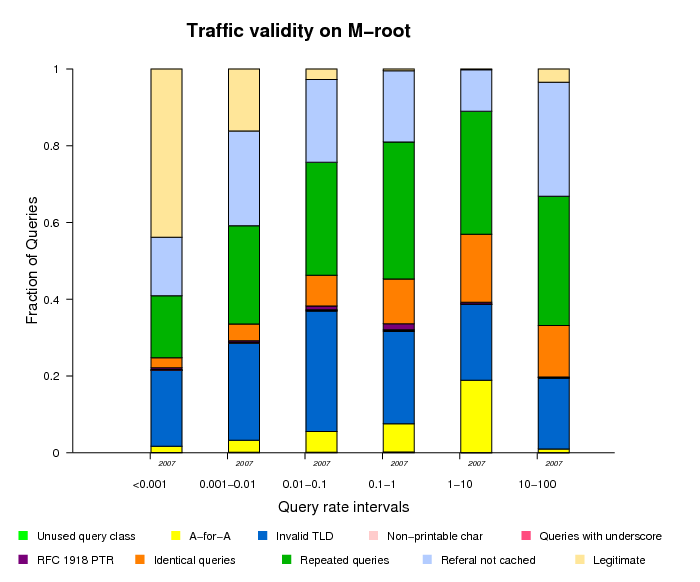
For all root nameservers, we found the fraction of valid queries decreasing with increasing query rate.
| C-root | F-root |
|---|---|
|
|
|
Figure 10a. Valid/invalid queries sent to all instances of C-root during DITL 2006 and 2007. The rightmost column includes queries from only three of the most prolific sources in our sample. One client out of those three presented an unusually high proportion of valid traffic (18% compared with <1% for the other two). |
Figure 10b. Valid/invalid queries sent to all instances of F-root during DITL 2006 and 2007. We found a surprisingly high proportion of queries for invalid top-level domains (TLD). We also found that some of the anycast F-root instances received >50% of queries attributable to this category. |
| K-root | M-root |
|
|
|
Figure 10c. Valid/invalid queries sent to all instances of K-root during DITL 2006 and 2007. |
Figure 10d. Valid/invalid queries sent to all instances of M-root during DITL 2007 (M-root did not participate in DITL 2006). |
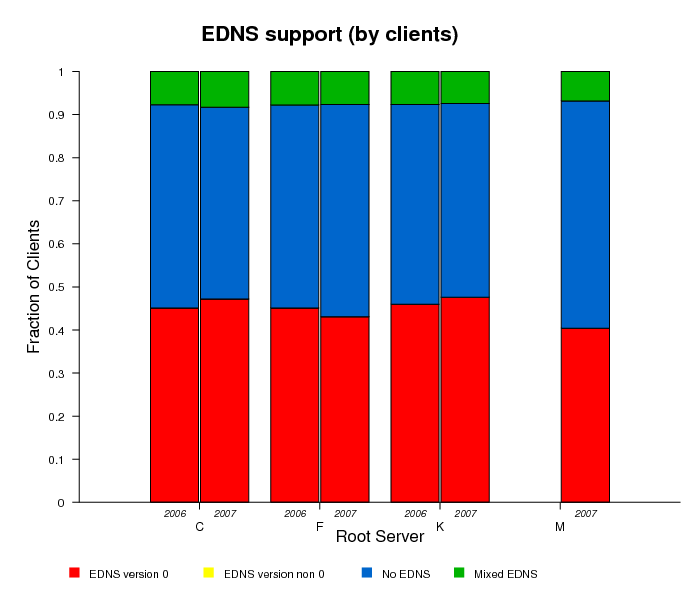
EDNS Support
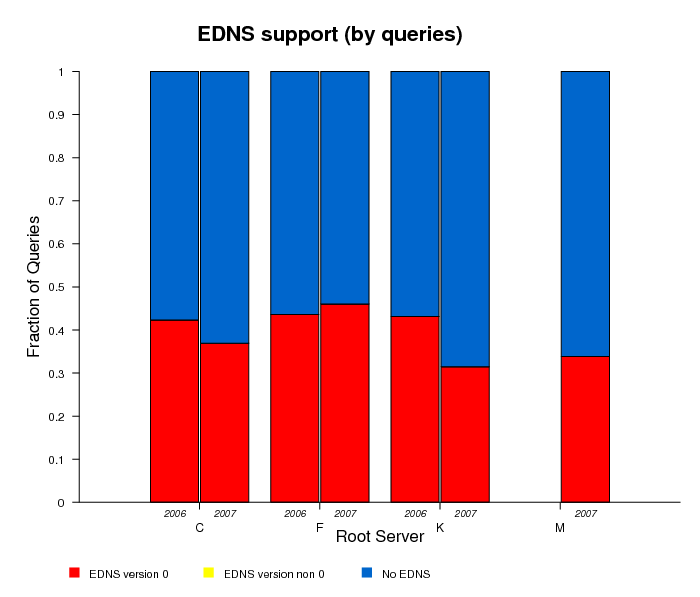
EDNS (Extension Mechanisms for DNS), defined by RFC 2671, provides extended capabilities to the DNS protocol making possible to add more flags, label types and return codes. One of the extensions allows the protocol to overcome the original size limit of 512 octets for messages sent over UDP. The ability to send UDP packets larger than 512 bytes makes it possible for clients to advertise larger buffer sizes. The ability to advertise larger buffer sizes impacts efforts such as DNSSEC deployment and IPv6 which require larger messages. The larger buffer sizes for UDP messages enabled by EDNS support allows users to avoid the extra overhead otherwise required by falling back to the TCP protocol. Tracking client support for EDNS gives us some measure of growth in infrastructure toward supporting DNSSEC and IPv6 deployment.
In the graphs below we plot the fraction of queries with EDNS support and the fraction of clients sending such queries (both are shown in red in Figure 11a and 11b below). A significant fraction, about 40%, of clients support EDNS, although the datasets do not show significant growth from 2006 to 2007.
| EDNS support (by queries) | EDNS support (by clients) |
|---|---|
|
|
|
Figure 11a. EDNS support observed at query level on all root servers for DITL 2006 and 2007 datasets. The fraction of queries with EDNS support varies from 31% (for K root in 2007) to 46% (for F root in 2007) at various servers. |
Figure 11b. The EDNS support observed at client level on all root servers for DITL 2006 and DITL 2007. Approximately equal fractions of clients (about 45% each) sent queries with and without EDNS support. The remaining 10% sent both kinds of queries (shown in green). We explain this duality by the presence of load balancers in front of a set of DNS servers where some of the servers provide EDNS support and others not. |
| EDNS buffer size (by query) | EDNS buffer size (by client) |
|
|
|
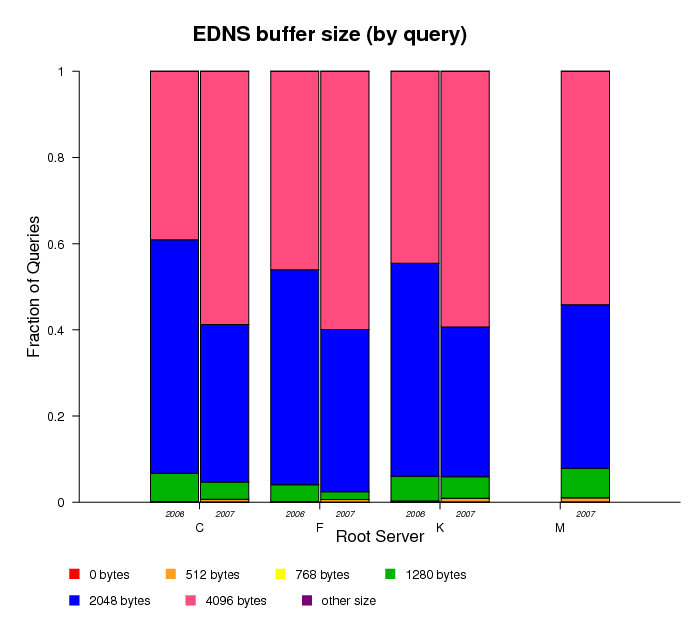
Figure 11c. The EDNS buffer size announced at query level on all root servers for DITL 2006 and 2007 datasets. From 2006 to 2007, we noticed a reduction in the number of queries with EDNS buffer sizes of 1280 and 2048 bytes, and an increase of those with a 4096-byte buffer. This largest size corresponds to the default configuration of a BIND server that activates EDNS support. Queries with a buffer size of 512 bytes observed in 2007 are probably due to BIND servers decreasing the configured buffer size to overcome firewall limits. |
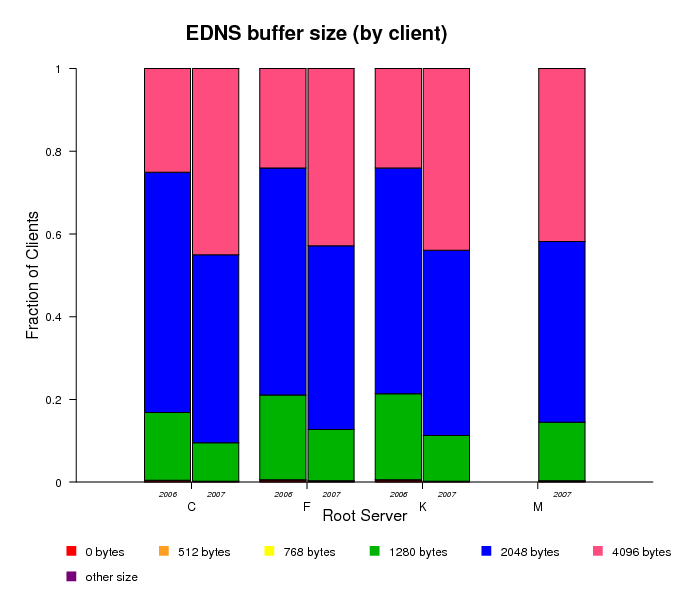
Figure 11d. The EDNS buffer size announced at client level on all root servers for DITL 2006 and DITL 2007. In this graph, a client might get counted more than once if it sends queries with different buffer sizes. Comparing this graph with Figure 11c, we notice that clients sending queries with a 1280-byte and a 2048-byte buffer size represent approximately 80% of clients in 2006 and less than 60% of clients in 2007 data. |
ORSN
The Open Root Server Network (ORSN) initiative started in February 2002 as an alternative to the ICANN-managed DNS root servers. The ORSN servers are located mainly in Europe (3 in Germany, 2 in Switzerland, one each in Austria, Slovenia, Denmark, Portugal, Greece, Netherlands) with one in the United States. These servers support IPv6 at the transport level. In 2007, two ORSN servers, B in Vienna and M in Frankfurt, participated in our data collection event. Analysis of the captured traffic follows.
General Statistics
The B-Vienna ORSN server received 3.3 queries per second and served 2.3 clients per second on average. The analogous values for the M-frankfurt ORSN server are 2.5 queries and 2.5 clients per second. This query rate matches that seen by the least busy ICANN-managed DNS root instances. The client rate for the ORSN servers is slightly higher than the lowest client rate observed at root server anycast instances (1.9 for f-dac1 node) and is comparable to client rates at f-ccs1 node (2.1) and k-moscow node (2.34).
Distribution of Queries by Query Type
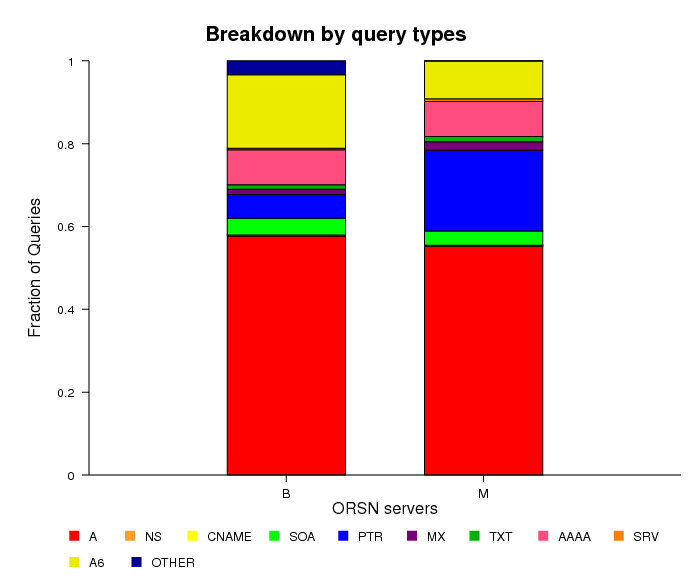
Figure 12. Distribution of queries by query type
observed at ORSN servers.
The fraction of A-type queries (around 55%) is slightly lower for the ORSN servers than for the official root servers. A6-type queries make up 18% of all queries on ORSN B server, and 9% of all queries on ORSN M server, compared with the 6% observed at the roots. The fraction of AAAA-type queries is also slightly higher in ORSN servers: 8.5% compared to 7%. Note that the ORSN B server saw 3% of "other types" of queries, probably due to malformed packets.
Distribution of Clients/Queries
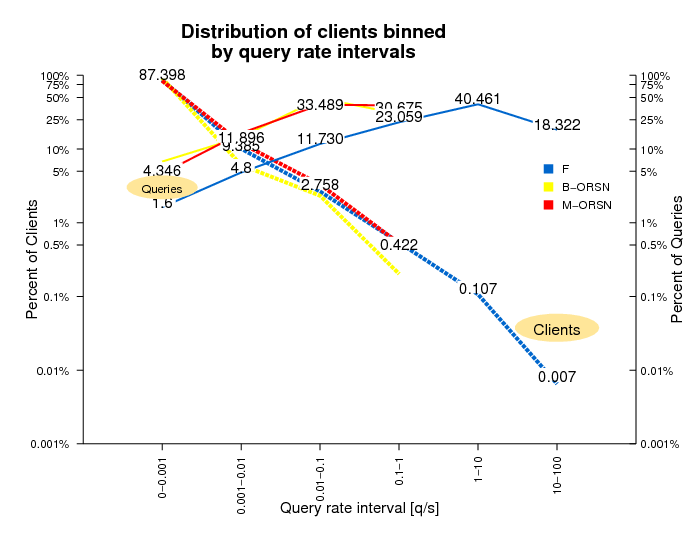
Figure 13. This figure compares the distribution of clients on ORSN and F-root
servers binned by query rate intervals.
To compare the distribution of clients and queries by query rate for the root and ORSN servers, we averaged the F-root distributions observed in 2006 and 2007. The distributions of clients by the rate of queries are similar for both ORSN servers and averaged F-root. The distribution of queries for ORSN servers is shifted to the left because of an order of magnitude lower overall load.
Traffic Validity
We used the same categories of invalid queries for the ORSN servers as we did for the DNS root servers. However, since both the number of clients and the number of queries for the ORSN servers are much lower than those values for the root servers, we did not need sampling and were able to analyze the validity of all observed queries.

Figure 14. Summary of distributions of valid and invalid queries
observed at the root and ORSN servers.
The graph confirms the observations made above: the higher the query rate, the lower the fraction of valid queries. However, the percentage of valid queries at the ORSN servers is higher than at the root servers. The average query rate for ORSN servers is on the order of a few queries per second and the valid queries constitute about 10% of the total load. In contrast, for the root servers, for clients with query rates in the range between 1 and 10 per second, the percentage of valid queries is negligibly small.
Conclusions
-
Our comparision of DITL data from 2006 and 2007 experiments
reveals some interesting insights:
- The anycast deployment of DNS root nameservers appears stable, efficient, and responsive to clients' needs. Anycast instances cover all continents bringing a better service to the worldwide population of users.
- The overall query traffic experienced by the roots continues to grow. The observed 2007 query rate and client rate was 1.5-3X above their observed values in 2006
- The proportion of invalid traffic, i.e., DNS pollution, hitting the roots is still high, over 99% of the queries should not even be sent to the root servers. We found an extremely strong correlation both years: the higher the query rate of a client, the lower the fraction of valid queries.
- Repeated, identical and "referral-not-cached" queries constituted 69% of the total load on the roots during the 2007 observations. We are not in a position to evaluate the cost of this pollution to the root operators or to the Internet, nor the cost of cleaning it up. Some sources of this pollution could be mitigated by DNS operator locally serving common zones. For the March 2008 DITL experiment we will further investigate the patterns of these invalid queries and identify other ways to reduce the DNS pollution at the roots.
- About 40% of clients observed in 2006 and 2007 support EDNS, an extension mechanism that enables DNS to support larger queries needed for IPv6 and DNSSEC deployment.
- ORSN servers are subject to similar traffic composition and anomalies seen at the official DNS roots, in proportion to the reduced workload served.
We thank ISC/OARC, RIPE, WIDE, and Cogent for collecting the datasets used in this study. P. Vixie, K. Mitchel, Joao Damas and L. Bicknell from ISC helped with data storage and answered our questions on F-roots anycast deployment. A. Kato from WIDE provided information on BGP peering for M-root instances. This work was supported by NSF grant OCI-0427144.