

Supplemental data for "Lost in Space: Improving Inference of IPv4 Address Space Utilization"

|
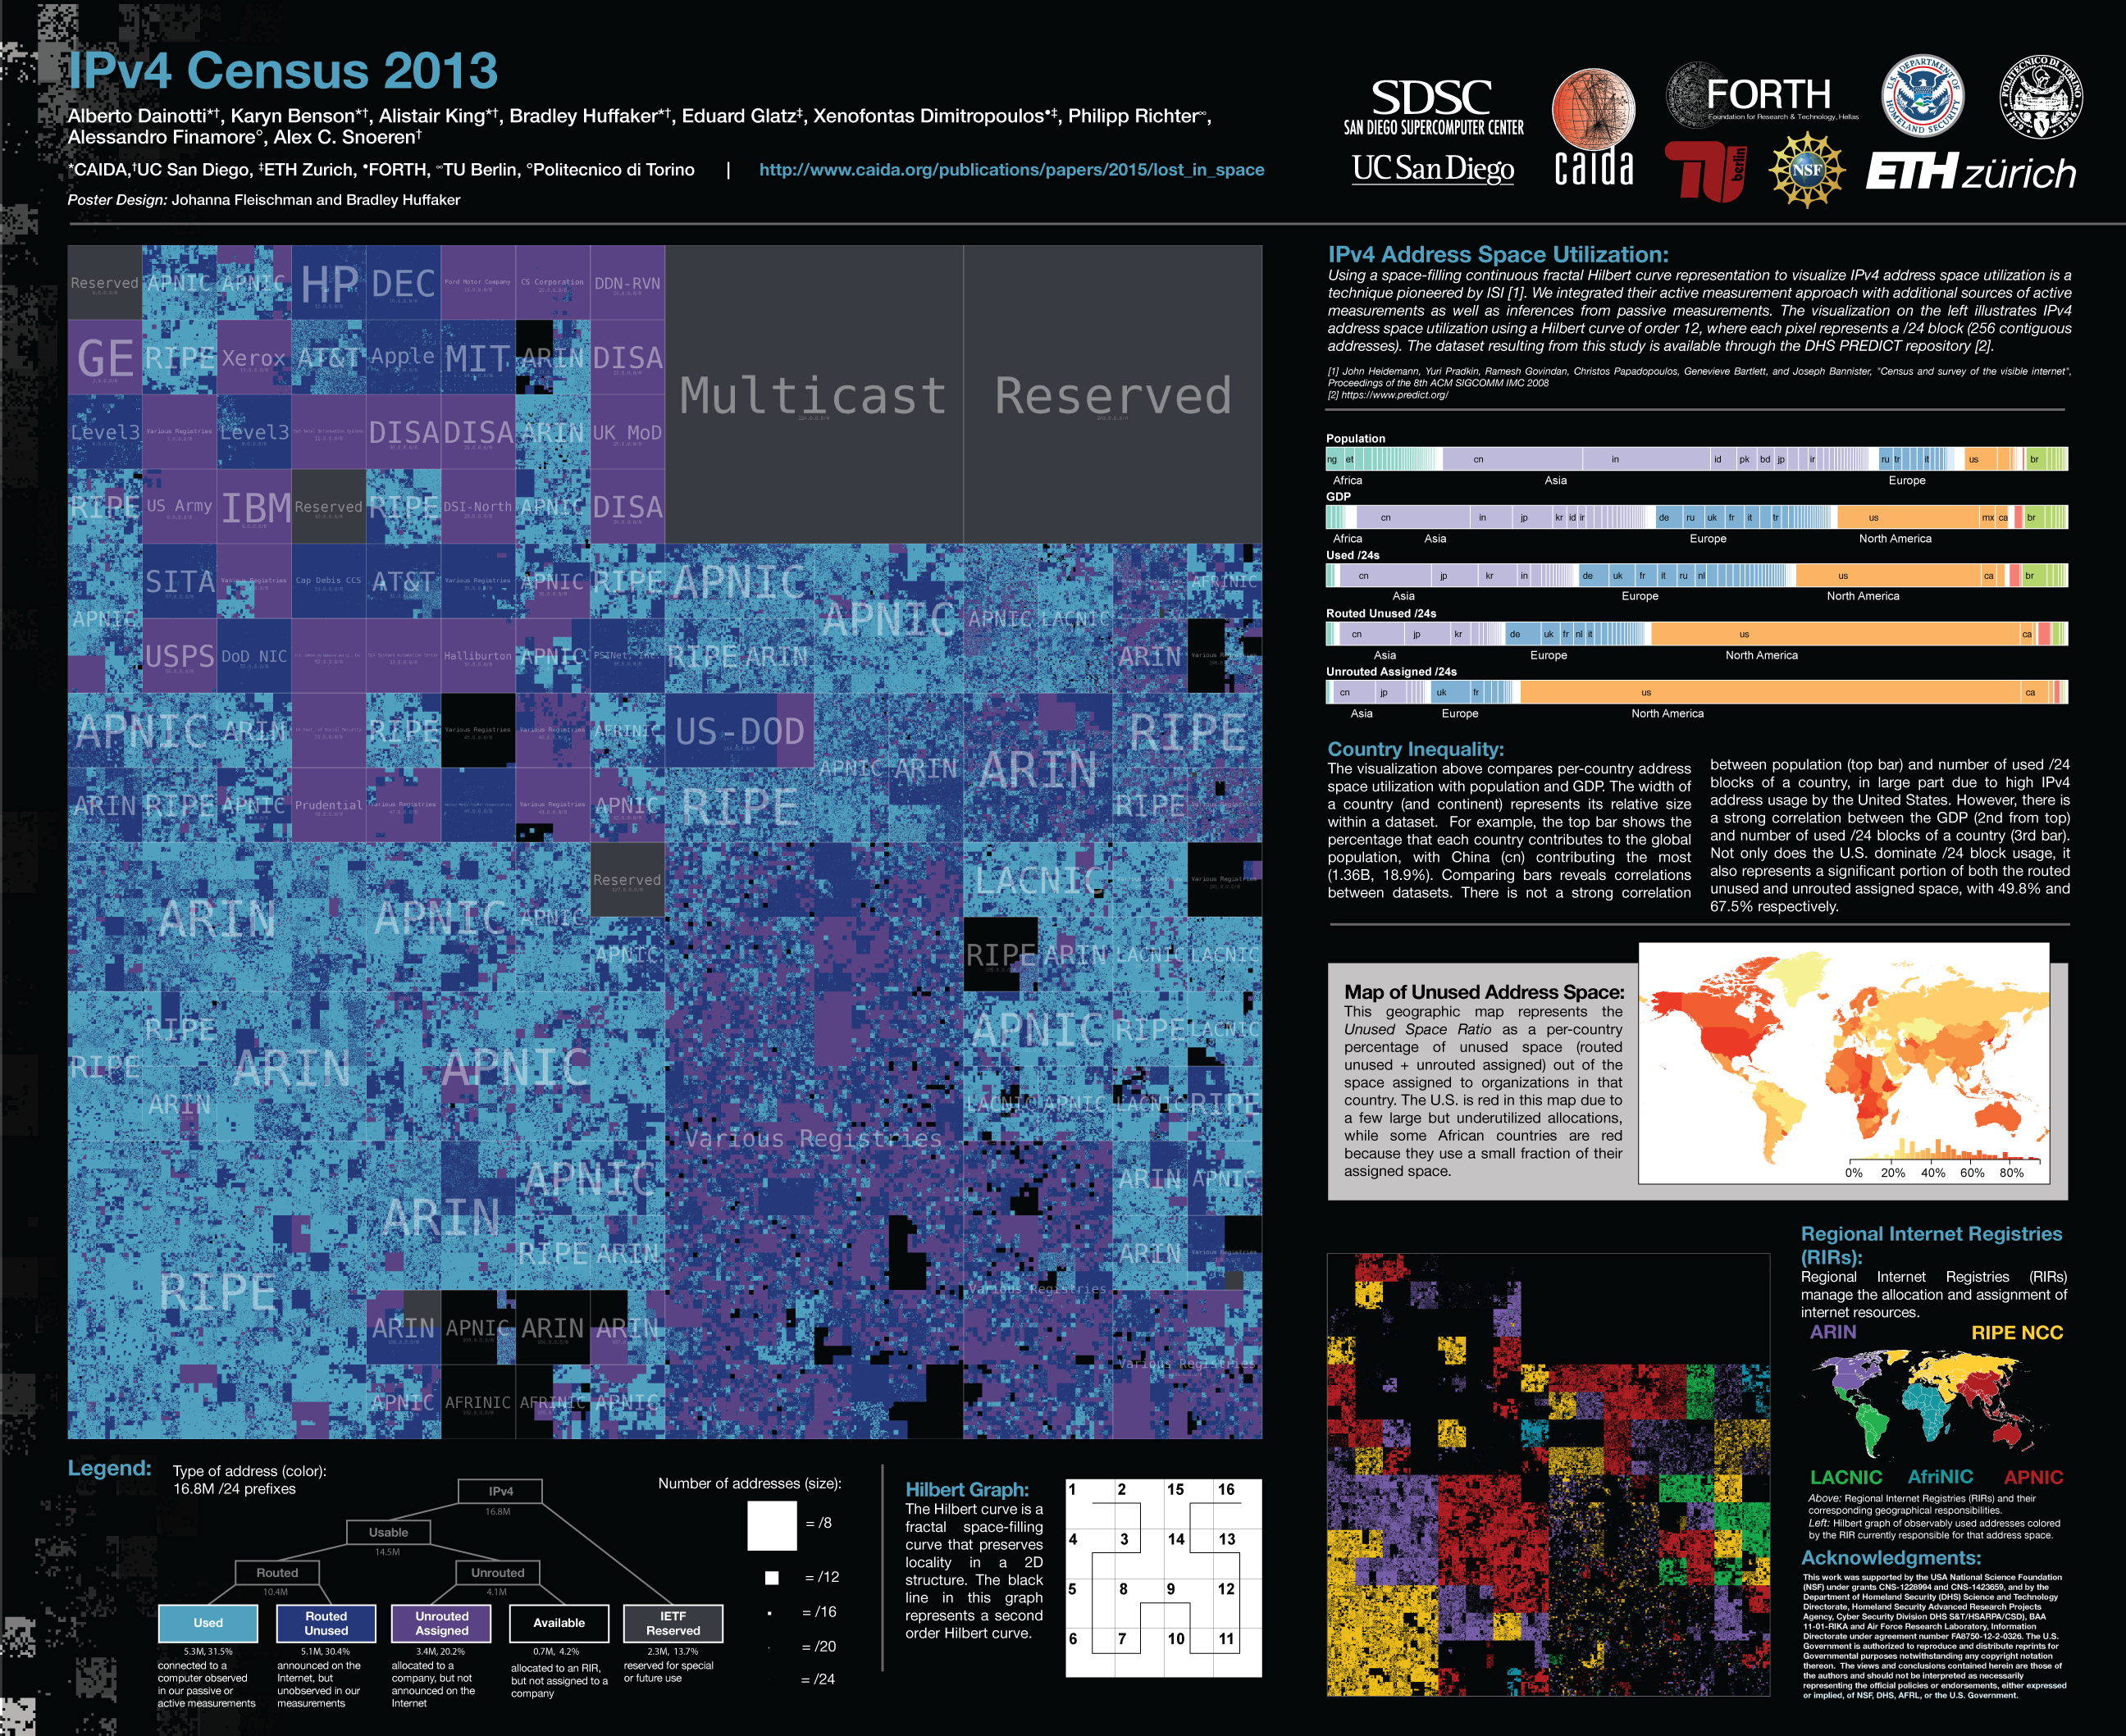
IPv4 Census 2013 Poster:
We produced an IPv4 Census Poster based on the work of of this paper. The center of the poster is a Hilbert Map visualization of the utilization of the address space according to our taxonomy. The IPv4 address space is rendered in two dimensions using a space-filling continuous fractal Hilbert curve of order 12. Each pixel in the full-resolution image represents a /24 block; cyan indicates used blocks, black unassigned blocks, and grey RFC special blocks. Routed unused blocks are blue and unrouted assigned blocks are purple. Individual components are described below. The IPv4 Census 2013 poster is also available in PDF. |

|
IPv4 Address Space Utilization:
This visualization shows the utilization of the IPv4 address space according to our inference methodology, which combines data from active and passive measurements. The IPv4 address space is rendered in two dimensions using a space-filling continuous fractal Hilbert curve of order 12. Each pixel in the full-resolution image represents a /24 block (256 contiguous addresses). |

|
Country Inequality (Interactive):
Interactive visualization that compares per-country address space utilization with population and GDP. The width of a country (and continent) represents its relative size within a dataset. E.g., the top bar shows the percentage that each country contributes to the global population, with China (cn) contributing the most (1.36B, 18.9%). The correlation between datasets can be observed by comparing bars. There is not a strong correlation between population (top bar) and number of used /24 blocks of a country; in large part due to high usage by the USA. There is, however, a strong correlation between the GDP (2nd from top) and number of used /24 blocks of a country (3rd bar). Not only does the USA dominate /24 block usage, it also represents a significant portion of both the routed unused and unrouted assigned bars, with 49.8% and 67.5% respectively. |

|
This visualization is no longer available. Interactive geographical map visualization that allows comparison between four maps derived from our census dataset.
Population and GDP data was obtained from the CIA Factbook. |
")
|
Regional Internet Registries (RIRs):
Regional Internet Registries (RIRs) manage the allocation and assignment of internet resources. These two visualizations show 1) RIRs and their corresponding geographical locations, and 2) RIRs within the Hilbert Graph. |