The contents of this legacy page are no longer maintained nor supported, and are made available only for historical purposes.
Beluga screenshots gallery
Below are screenshots of the Beluga tool, both live and history views. Due to constant code changes, the features shown may not be representative of the current state. Note that thumbnails are cropped from the full version; click on them to see the originals.
Typical behavior
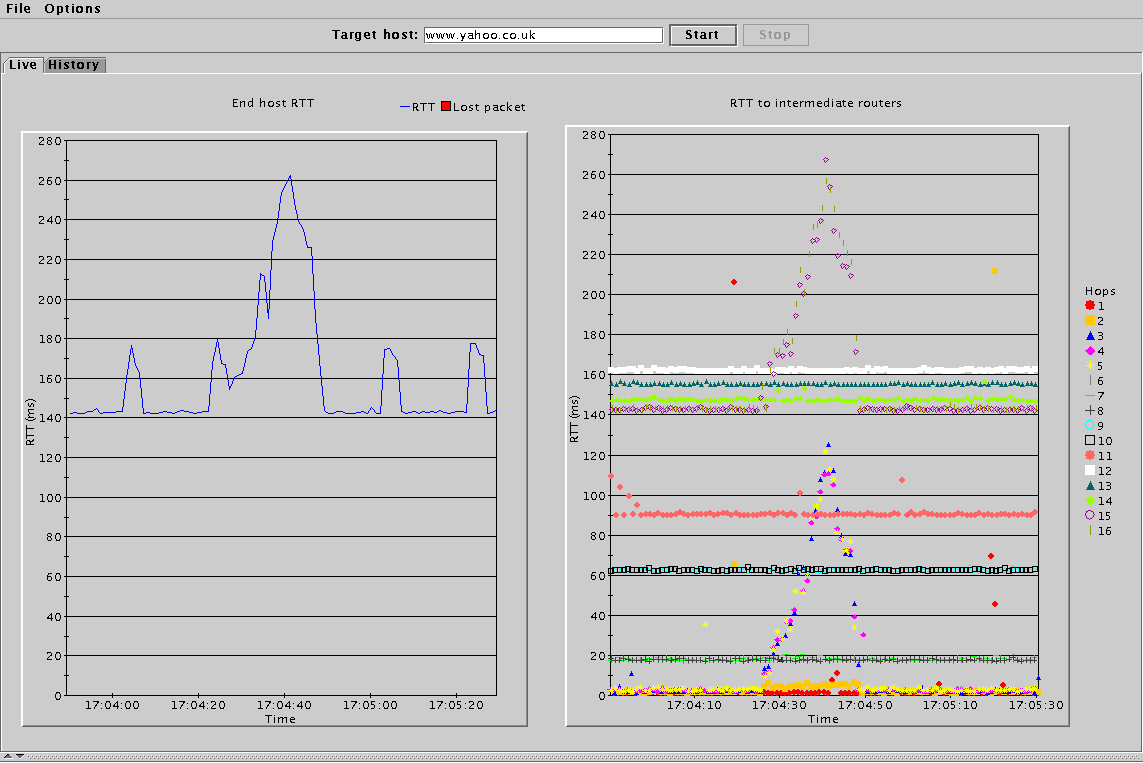
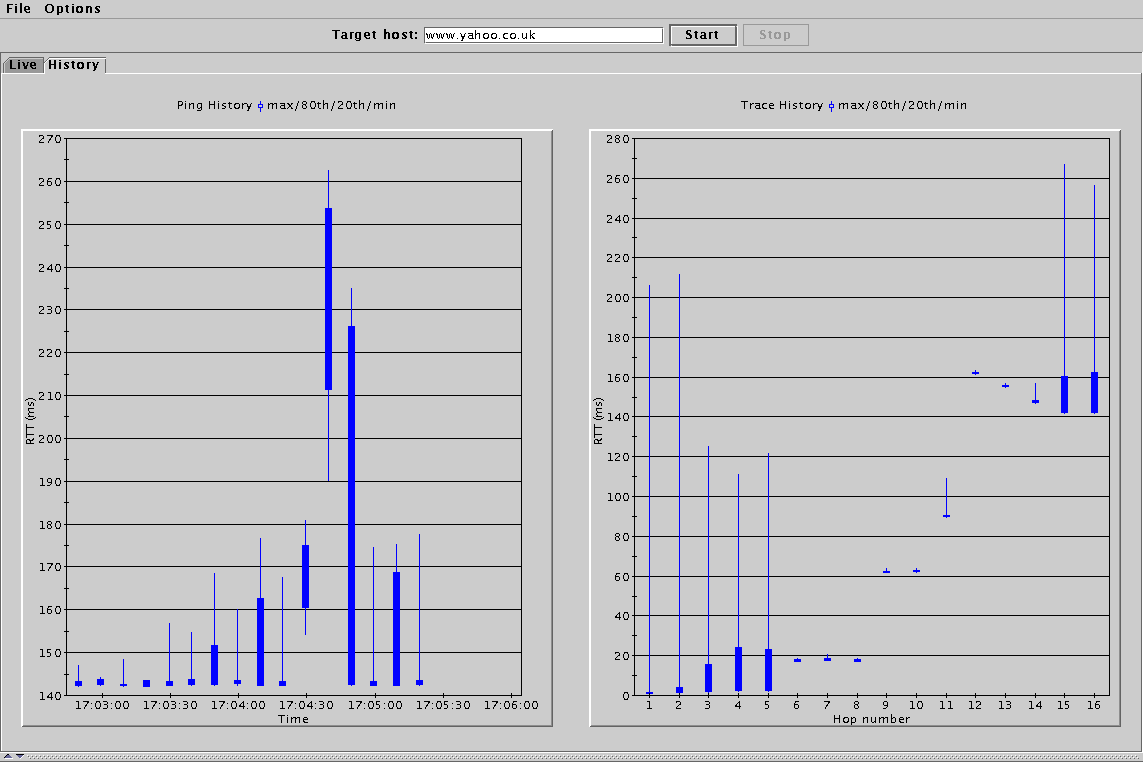
Stanford to London, August 29th, 2002
These graphs show what a stable network connection looks like. The end host RTTs may vary, but usually tend to tightly stabilize around a single value. The RTTs to individual routers show similar stability and form bands that often correspond to distance from the source host. In this example, the RTTs clearly jump (in both live and history views) at hops 9 and 10, between San Jose (sjc) and Washington DC (dca), and between Washington DC and London (lhr).
Live view (linear) |
History view (linear) |
Single router effects
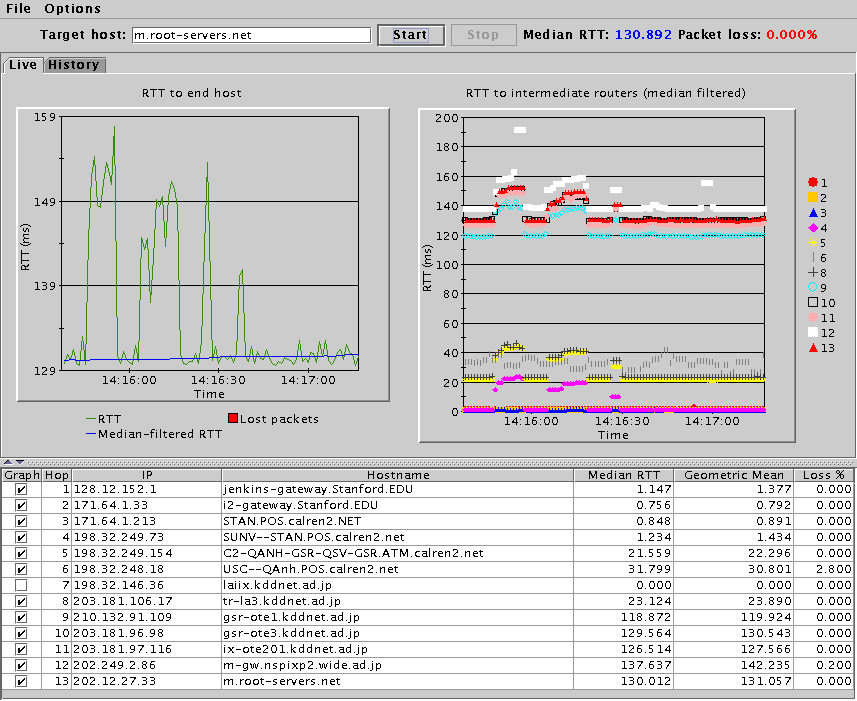
Stanford to Tokyo (m-root name server), August 16, 2002
Here we see the typical banding features (especially on the trans-Pacific link between hops 8 and 9), but with a slight difference: a few transient increases in delay that propagate to all hops, most likely due to queueing at the router at hop 4. This effect does not show up well on the history graphs or the hop table text, but can be clearly seen in the live graphs.
Live view (linear) |
History view (linear) |
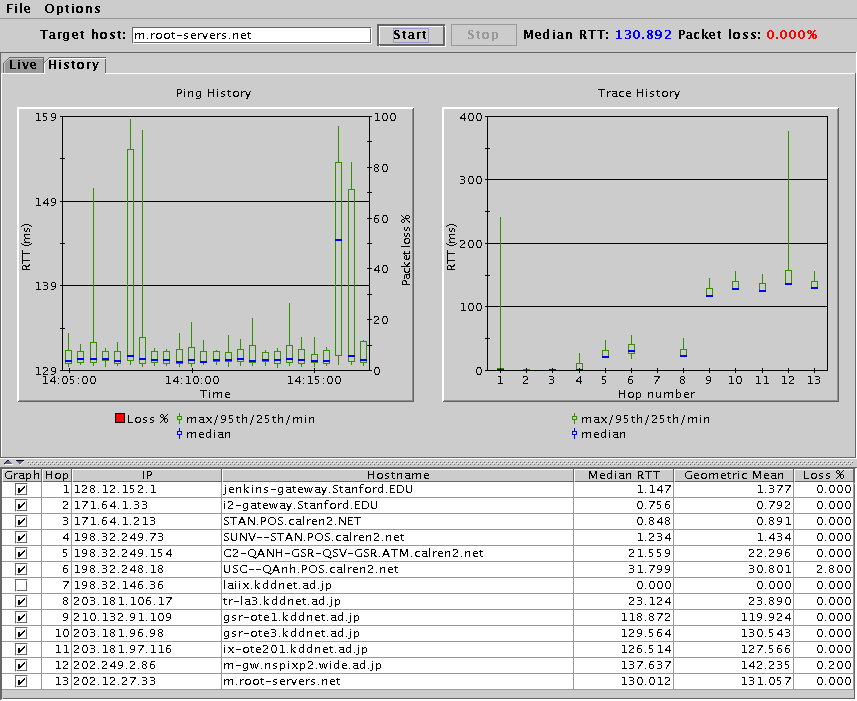
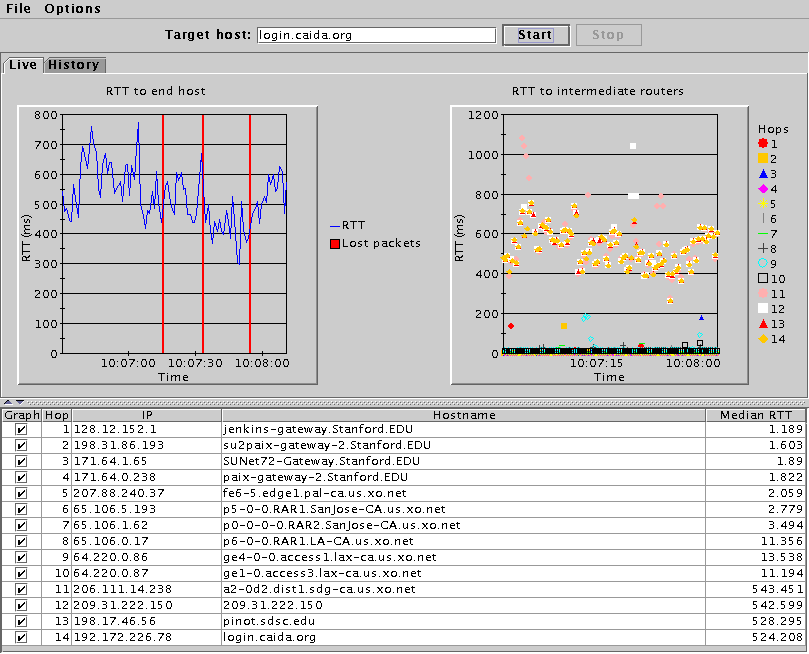
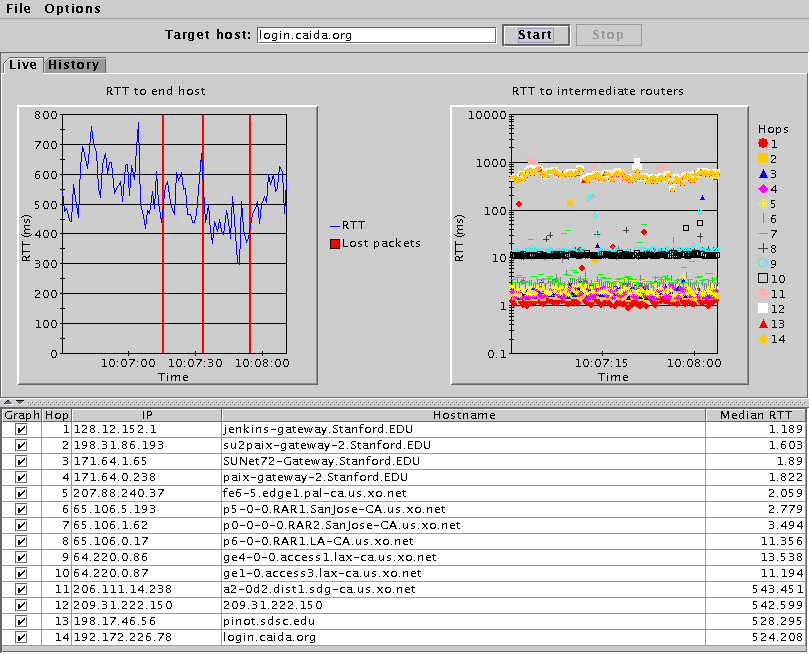
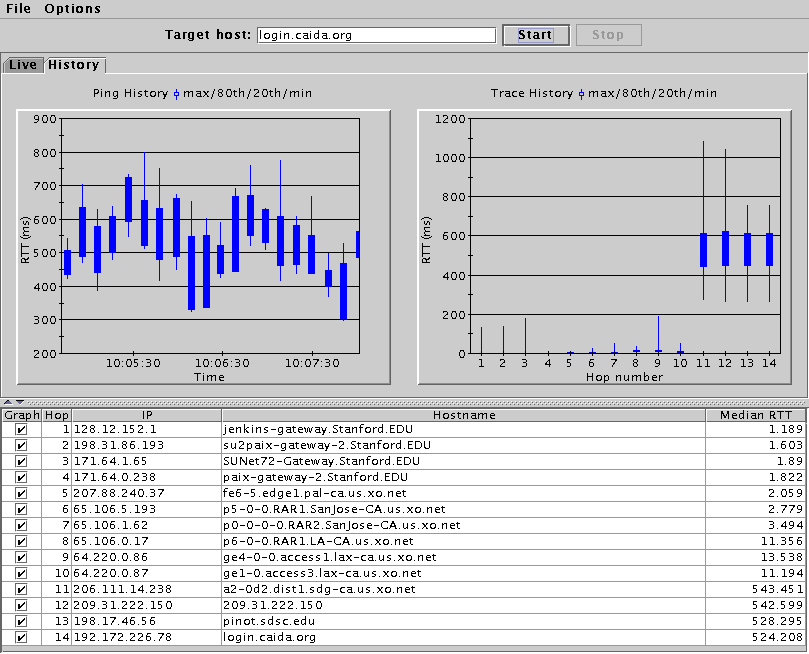
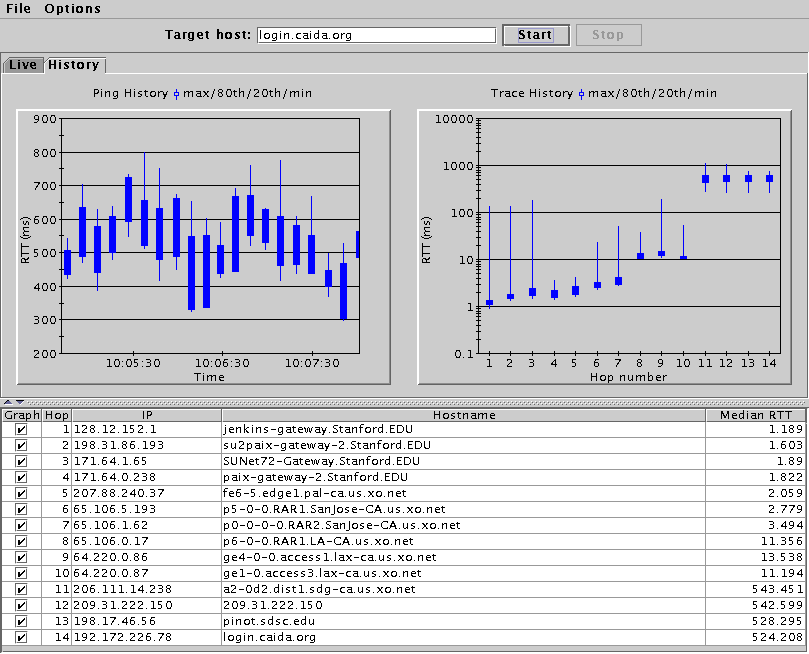
Stanford to Caida, August 7, 2002
These images show the same type of phenomenon of a single hop increasing the RTT for all further hops, however it has a fundamental difference. Because the increase in RTT between hops 10 and 11 (LA and San Diego, respectively) is longer lived than in the m-root example, both the history graphs and the hop tables reflect this increase.
Live view (linear) |
Live view (logarithmic) |
History view (linear) |
History view (logarithmic) |
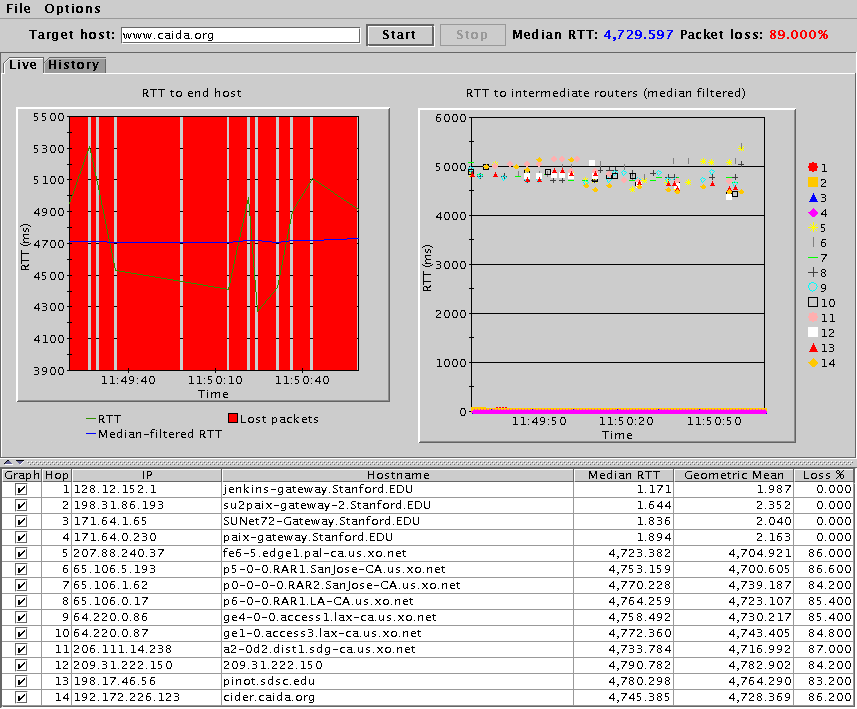
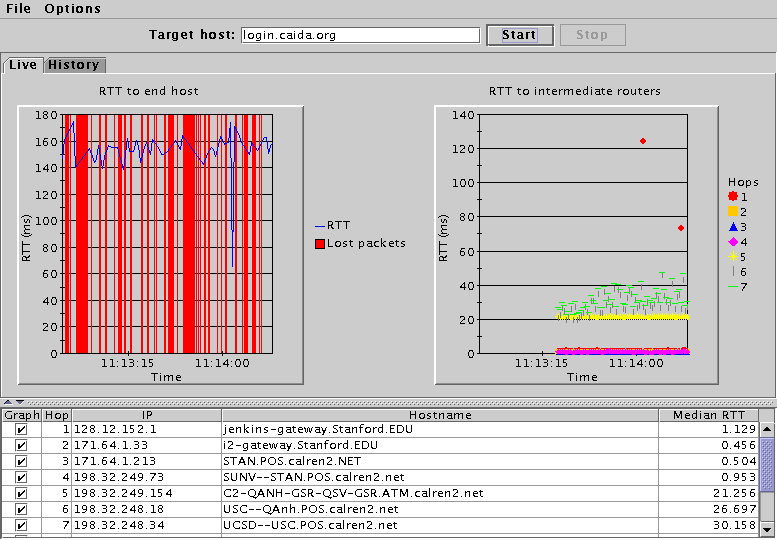
Massive loss
Stanford to Caida, August 7, 2002
One of the problems that Beluga does not yet robustly deal with is finding a path in the face of high packet loss. In attempting to deal with the above latency in the XO network, SDSC switched to CalREN2, which had lower RTTs...and much higher packet loss. As a result, the first attempt to discover a path failed, although a later attempt (second graph) met with more success.
Live view (linear) |

Live view with more hops (linear) |
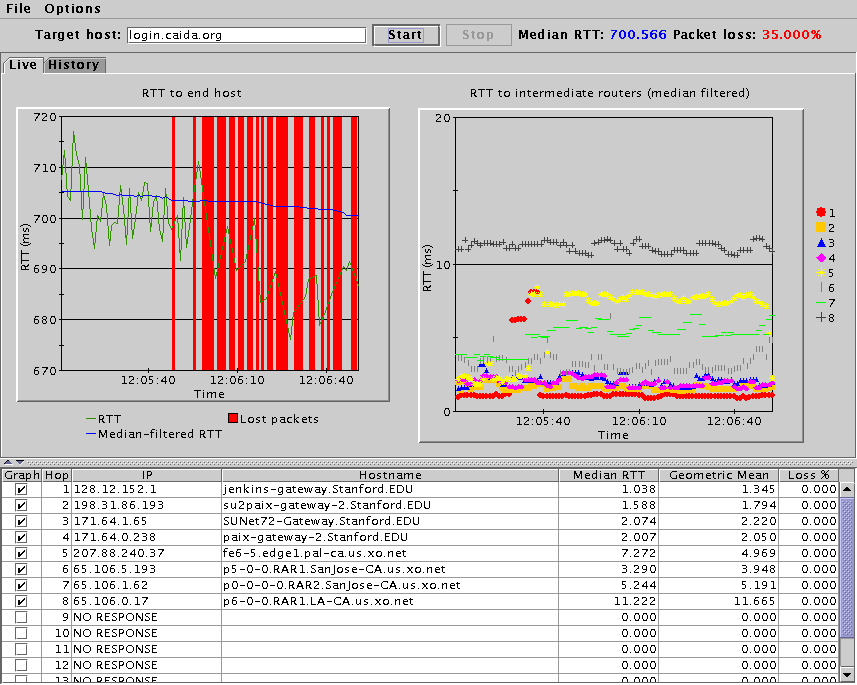
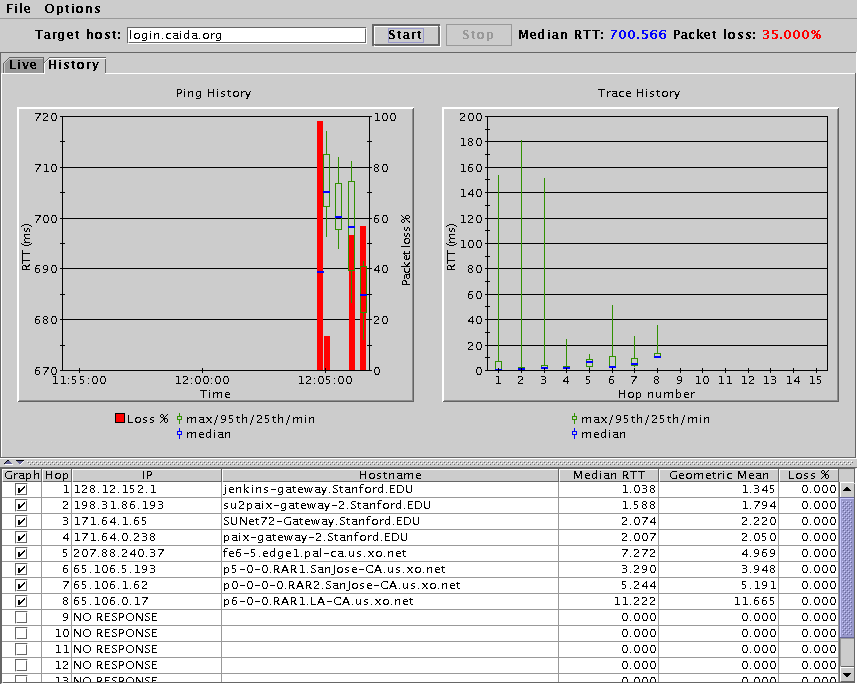
Stanford to Caida, August 26, 2002
These graphs show a combination of problems, with both high RTTs and high packet loss, which renders it difficult to see where exactly the network is having problems. In the future, we aim to make Beluga more persistent with its probing, constantly attempting to determine the instantaneous data path.
Live view (linear) |
History view (linear) |
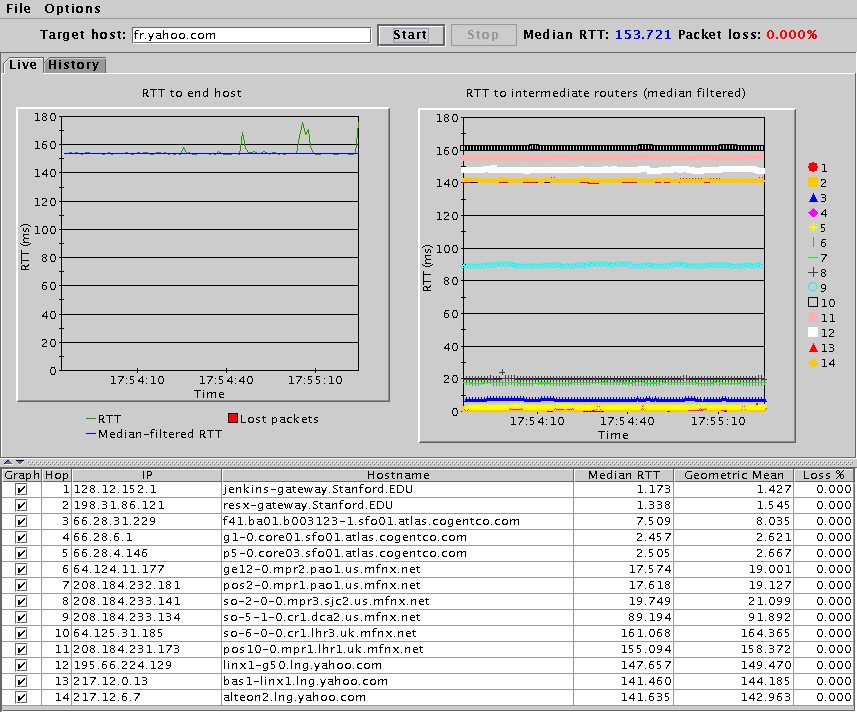
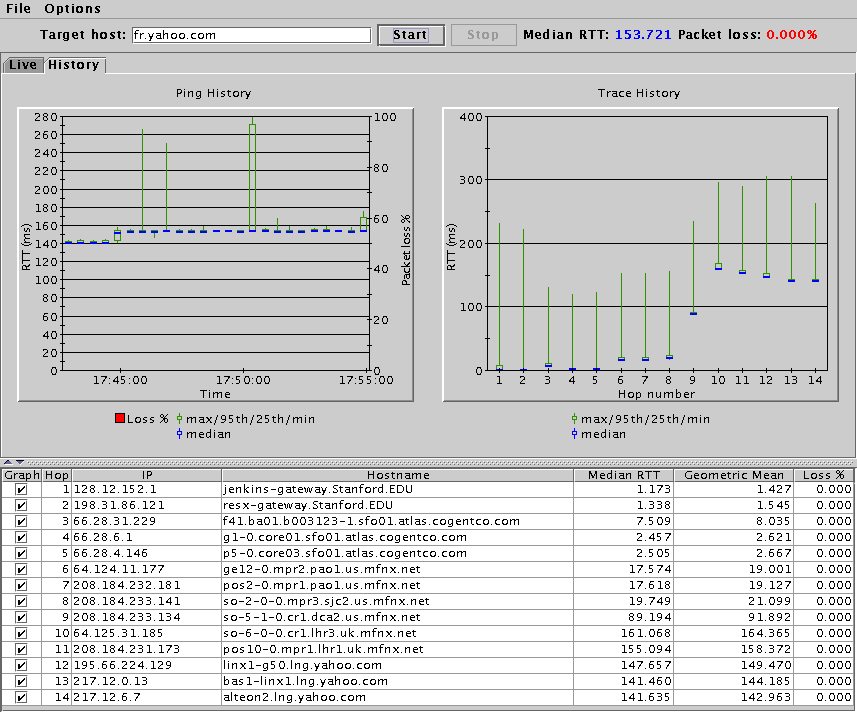
Differing reverse paths
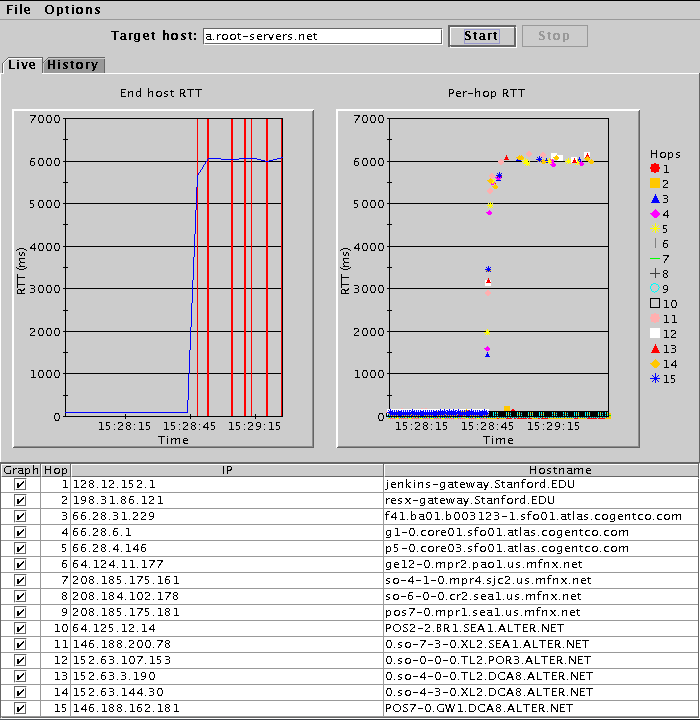
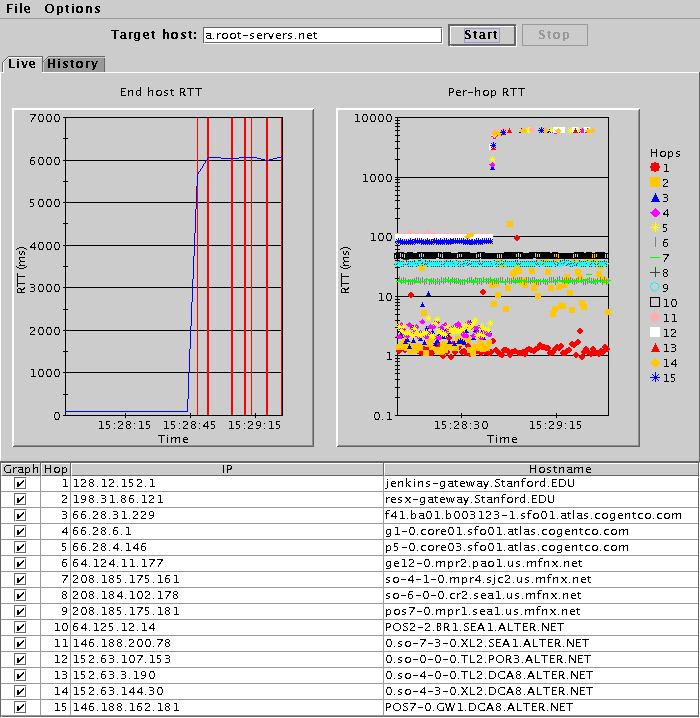
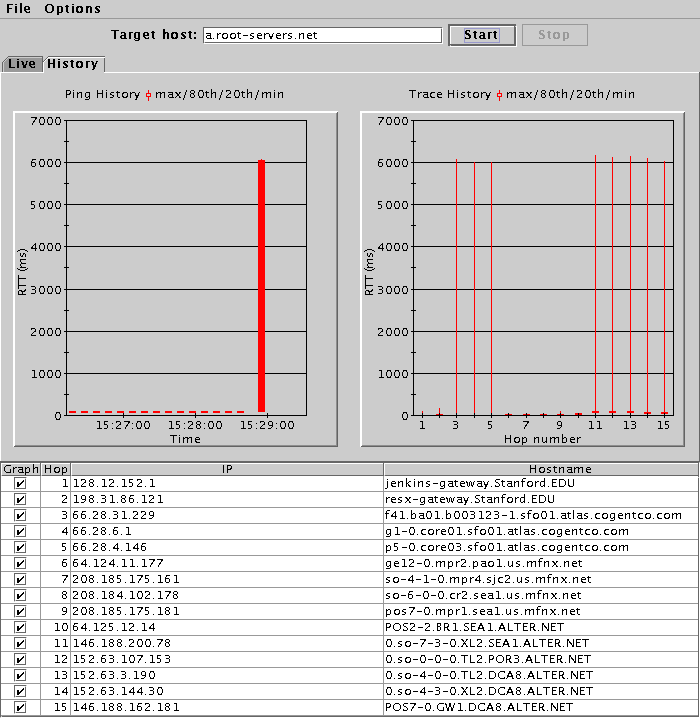
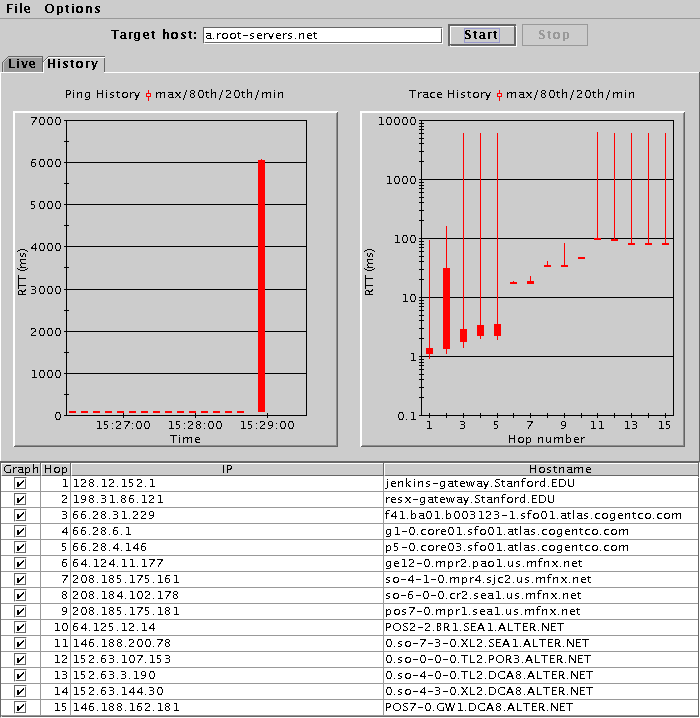
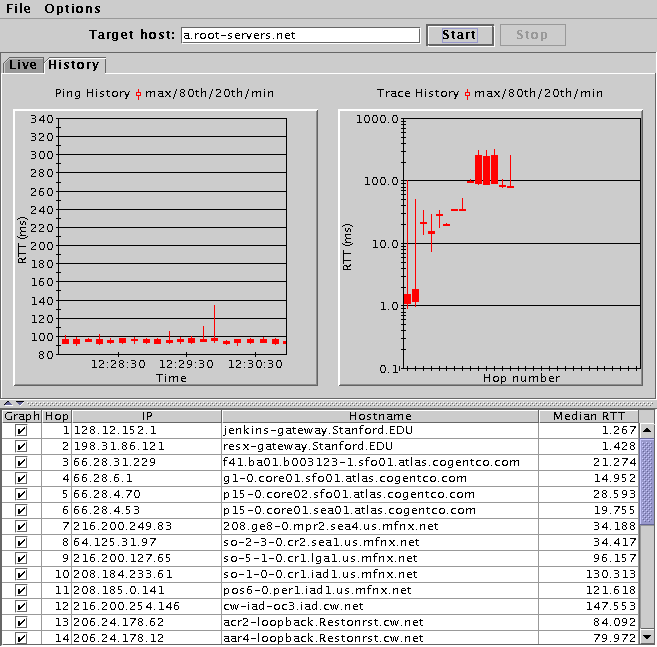
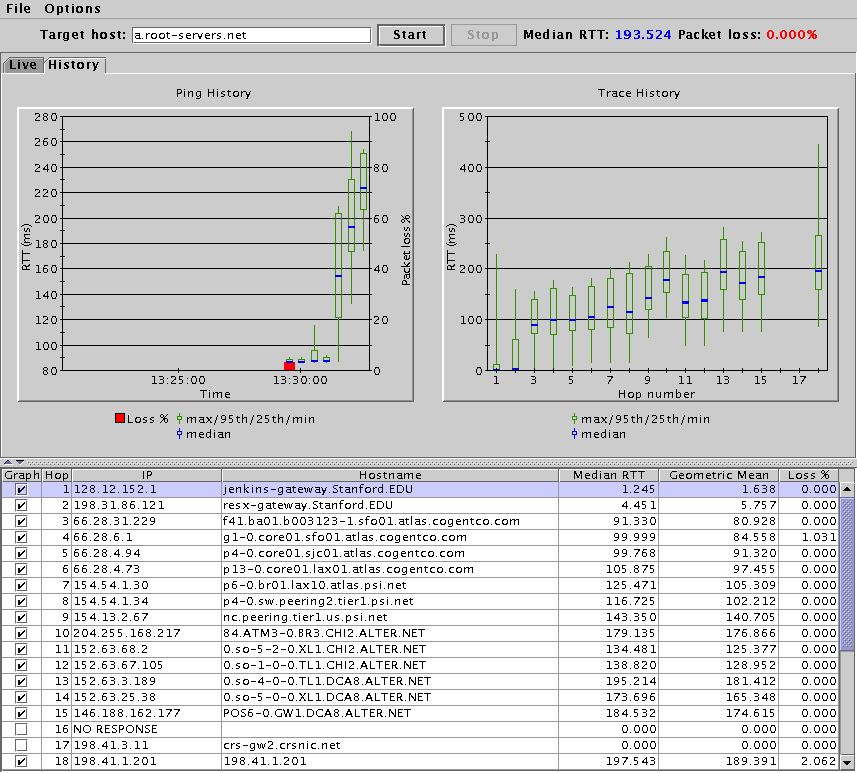
Stanford to Virginia (a-root name server), August 2, 2002
In this set, the RTT to a.root-servers.net leaps suddenly from 100ms to 6000ms. What is not immediately obvious from the linear view (but can be seen in the logarithmic view, as well as the history graphs) is that not all intermediate routers saw this increase. Of particular interest are hops 6-10, which have a small range of RTTs, but are bordered by hops 5 and 11 which both include the 6000ms RTTs. The most likely explanation for this is that the problem exists in the return path of the ping packets, and hops 6-10 use a different reverse path than 3-5 and 11-15. Notice also that these ranges correspond to different networks, and thus the RTT differences are likely due to peering differences. (Hop 10 is a border router for alter.net, and might not follow the same policy as the core routers.)
Live view (linear) |
Live view (logarithmic) |
History view (linear) |
History view (logarithmic) |
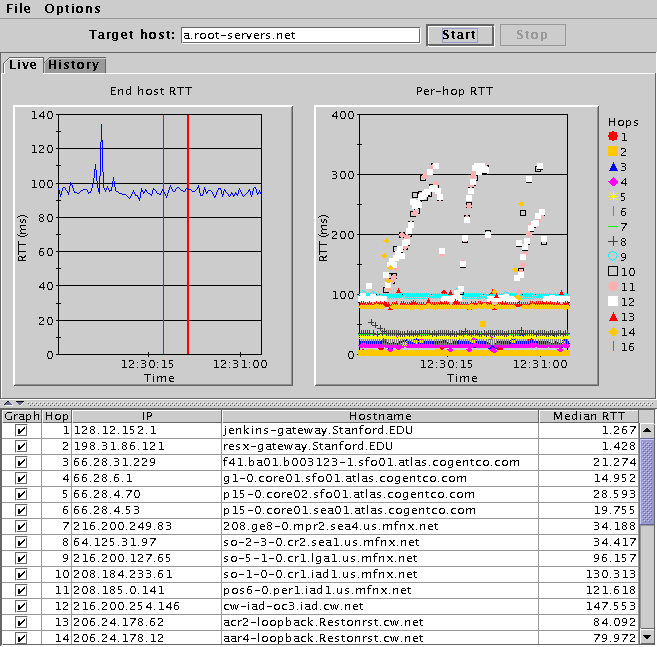
Stanford to Virginia (a-root name server), August 5, 2002
The graph below shows the resolution of a similar event as the previous graphs. Whatever was causing the increased RTT in the return paths has dropped off slowly and returned to normal operation.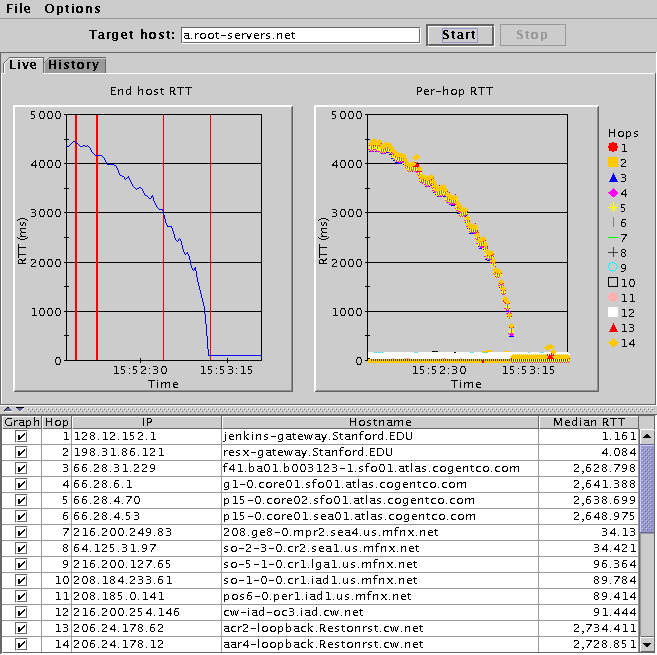
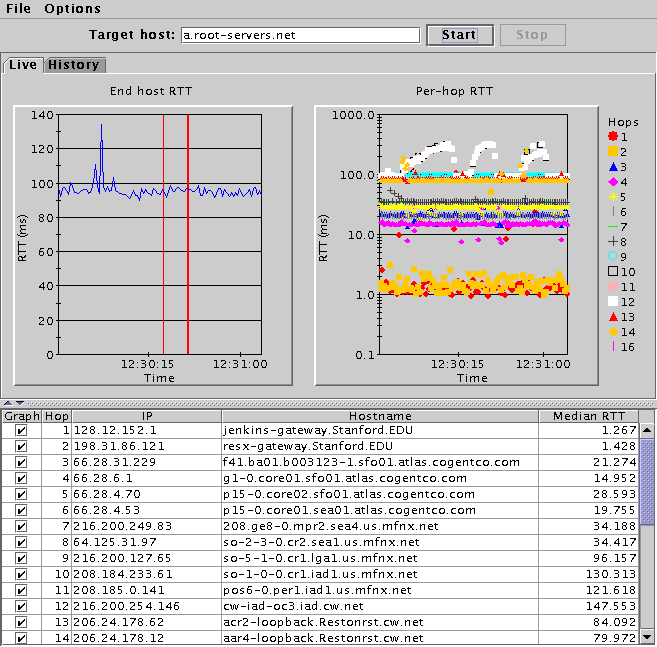
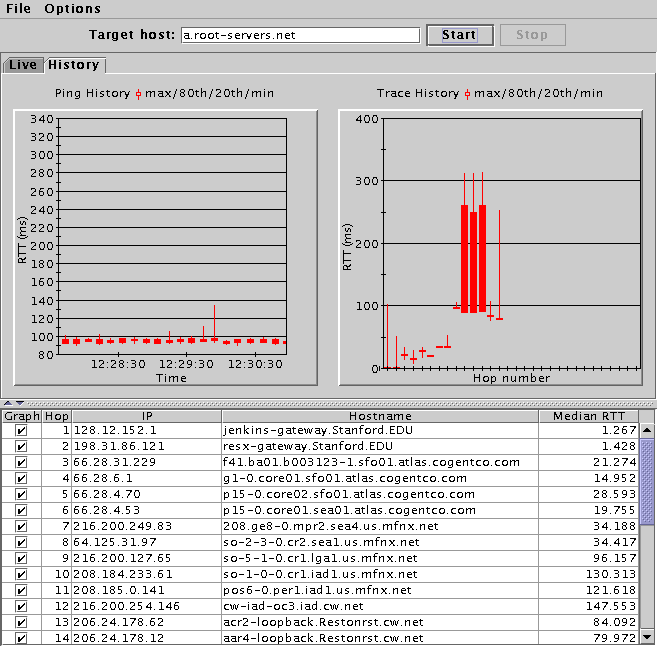
Stanford to Virginia (a-root name server), August 5, 2002
A similar analysis as that above applies to this set of images. One difference is that the increase in RTTs to hops 10-12 seems much more transient, suggesting queueing delays in the reverse path. In addition, hop 14 appears to momentarily use the same reverse path, only to switch back and have a stable RTT, suggesting some sort of load balancing. (Thanks to Sally Floyd for this insight.)
Live view (linear) |
Live view (logarithmic) |
History view (linear) |
History view (logarithmic) |
Stanford to London, August 5, 2002
Same story, different graphs. The live view clearly show that some hops remain stable while others make an obvious peak (in the live view) and have a wider RTT spread (in the history view).
Live view (linear) |
History view (linear) |
Miscellaneous weirdness
Stanford to Virginia (a-root name server), August 16, 2002
Below we show a case where the delay between the start of end host pinging and the start of router pinging shows a strange phenomenon. In the few seconds between the initiation of a traceroute and its completion, the end host RTT stabilized at approximately 90ms. However, once the traceroute completed and Beluga began pinging all intermediate routers, the end host RTT began to steadily climb. This could possibly be due to some ICMP rate-limiting on a router (like hop 3), or perhaps simply coincidence.
Live view (linear) |
History view (linear) |
Stanford to Caida, August 30, 2002
The following graph appears the same as the other loss/latency graphs, with the important distinction that it completely misrepresents the state of the network. The first XO router (hop 5) seems to discriminate against ICMP packets, dropping and delaying them, whereas it passes (and processes) UDP and TCP packets with no problem. Note that the router is not just using the slow path with ICMP packets it has to process and reply to, but with ANY ICMP packets it is forwarding. It also appears that it is the only router configured this way, as the loss and latency figures don't increase dramatically after hop 5.