

IODA: Detection and analysis of large-scale Internet infrastructure outages - Proposal
An abbreviated version of the original proposal is shown below. For the full proposal for "Detection and analysis of large-scale Internet infrastructure outages", please see the proposal in PDF.
Principal Investigators: Alberto Dainotti kc claffy kc claffy Alberto Dainotti
Funding source: CNS-1228994 Period of performance: September 1, 2012 - August 31, 2016.
1 Motivation: Transferring Monitoring Research into Practice
Despite the Internet's status as a critical infrastructure of our society, there is little scientific instrumentation dedicated to monitoring global Internet behavior. In particular, we have no rigorous framework for measurement, analysis, or quantifying the impact of network outages, filtering, or other abnormal connectivity dynamics on a global scale, nor do we have metrics for assessing the vulnerability of a network's connectivity. Significant progress has been made in monitoring and analyzing the status of the BGP control plane, but many incidents that severely impede the normal operation of the Internet cannot be captured by control plane observation [1,2]. Such incidents may include security attacks, power outages, country-level censorship, undersea cable cuts, and natural disasters such as hurricanes or earthquakes. Detecting, understanding and quantifying the impact of such events in order to appropriately and effectively respond to them requires integration of heterogeneous data types that capture different dimensions of the phenomenon. A system that integrates different types of control plane (BGP) and data plane (traceroute, traffic data) data sources also promises scientific benefits. In addition to improving our understanding of how measurements yield insights into network behavior, and strengthening our ability to model large scale complex networks, use of such a system will also illuminate infrastructure vulnerabilities that derive from architectural, topological, or economic constraints, informing ongoing NSF-funded research on future Internet architectures. We recently reported successful results (see Section 3) from a novel multi-source data-integration approach to the characterization of large-scale network outages and the quantification of their impact [1,3]. In these studies we suggested as a promising future direction the implementation of semi-automated real-time detection systems for such events. Jointly with a European collaborator on these studies (the RIPE NCC), we propose to transition this research to an applied-research phase, during which we will develop, test, and experimentally deploy an operational capability to detect, monitor, and characterize macroscopic Internet infrastructure outages. In the process of transitioning these results into an operational experimental platform to observe such phenomena on a planetary scale, we will also refine our techniques and establish a more rigorous framework for the measurement, analysis and detection of large-scale outages. Our proposed project is responsive to the U.S. government's recently published "Trustworthy cyberspace: Strategic Plan for the Federal Cybersecurity Research and Development Program" [4]: "Although our national-level initiatives focus on research activities within the United States, cyber-space - with its vast interaction space of information, markets, and services - knows no borders." [..] "Sharing and cooperation across borders by researchers, governments, and industry are necessary to respond to the rise of global malware pandemics and the common threats they pose." [..] "An explicit, coordinated process that transitions the fruits of research into practice is essential if Federal cybersecurity R&D investments are to have significant, long-lasting impact. Each research program should have a transition plan that maps the appropriate paths to take a research product into commercialization." The proposed research addresses the "Transition to Practice" perspective of the SaTC program, with specific regard to improving our visibility and situational understanding of the Internet as critical cyberinfrastructure. In addition to demonstrating a path for transforming USG-funded research to operational instrumentation capability, our three proposed tasks will result in innovative tools and services of direct benefit to the research, operations, infrastructure protection, and national policy-making community.2 Related research using Internet data sets to analyze macroscopic Internet outages
Significant research contributions on the measurement and monitoring of large-scale Internet outages have been few, with several noteworthy contributions published in the past two years. In the next section we review research that has used several commonly available data sources to study Internet reachability and outage events. While most of these research studies focus on a single data source, our project seeks to operationalize a methodology to correlate disparate data sources to extract insights not revealed by any individual type of data.2.1 Internet data sets used for macroscopic analysis
Border Gateway Protocol (BGP). In BGP-based Internet interdomain routing, Autonomous Systems (ASes) announce and withdraw reachability information for their network prefixes to the rest of the Internet. Major changes in the number of prefixes announced or withdrawn from a group of ASes (for instance, a country-based grouping) are readily detectable from publicly available BGP data. Several research groups have used BGP as the primary data source in analyzing reachability disruptions, including hurricanes [5], earthquakes [6], military conflicts [7], political censorship episodes [8,9], and power outages and cable cuts [5]. Li and Brooks proposed a BGP-based "Internet seismograph" [5] to consistently quantify and compare the impacts on normal BGP behavior of disruptive events such as large-scale power outages, undersea cable cuts and worms. Active Probing. Active probing typically using ICMP echo-request packets is a means of troubleshooting IP-layer connectivity problems, and has been used to support BGP-based analyses [8]. Analyses based solely on active probing data [10] can offer insights into connectivity if the probing crosses infrastructure affected by the disruption [11]. Schulman and Spring recently developed and tested a technique to measure reachability of residential hosts before, during, and after forecasted periods of severe weather, finding reachability failures were four times as likely during thunderstorms and twice as likely during rain [12]. More typically, researchers use traceroute-based algorithms [13] to develop fine-grained models of Internet reachability, performance, structure, and growth. To infer a forward IP path between hosts, traceroute algorithms use a series of probe packets, incrementing the TTL value with each probe to elicit ICMP time exceeded responses from consecutive routers in the path. An IP-interface graph derives from inferring IP links between interface addresses in packets that time out at adjacent hops. Macroscopic Internet topology mapping projects use traceroute-based algorithms to infer forward (but not reverse) IP paths toward millions of destinations [14,15,16]. These data sources typically probe too slowly or from too few vantage points to reconstruct a comprehensive timeline of a macrosopic service disruption, and they do not capture the reverse path, which prevents accurate diagnosis of the direction or location of the outage. An implicit assumption is that the addresses represent distinct neighboring routers, and an active area of research is aggregating IP addresses to routers to derive a router-level topology [17]. It is also possible to infer false links from traceroute data, due to, e.g., load balancing, stale addresses, and routing dynamics. An important difference between BGP and traceroute data is that BGP data only contains information about control-plane reachability, which does not imply data-plane reachability, e.g., when packet filtering is deployed. And vice-versa, without a working BGP control-plane, packets might still be forwarded, for instance via default routing, used by over 70% of ASes [18]. The Hubble system [19] was a prototype that demonstrated the potential of combining event detection based on BGP data and active measurements of router-infrastructure, to identify how many prefixes are reachable from some vantage points and not others, how often these problems occur, and how long they persist. Section 3.1 describes an example of how multiple data sets can not only facilitate detection, but reveal aspects of outages not observable from a single type of data. Passive Traffic Measurement. Traffic data can also inform analyses of macroscopic Internet events, although so little traffic data is available to researchers that it is unlikely to capture macroscopic events of interest. As large aggregation points, Internet Exchange Points (IXPs) are more likely to see macroscopic events than single links, but they typically publish only coarse-grained traffic numbers, which at most are useful to augment other methods and data sources, such as in [6]. In order to detect and analyze Internet-wide disruptions, data collection must occur in the core of many major ASes, such as in Arbor Networks's commercial traffic collection infrastructure [20,21,22,23,24,25]. Google Services. The near-omnipresence of Google, or perhaps more accurately, of its user base, makes it an interesting source of data on Internet-wide disruptions. Cowie [9] uses the Google Transparency Report [26] to show distinct drops in the use of Google services at the beginning of the conflict in Libya, although he cannot use the same approach to analyze Japan's recent earthquake [6] due to the granularity of the available data. This data also only reflects a subset of user behavior, which may only indirectly relate to the state of the network. Peer-to-Peer Traffic. Peer-to-peer (P2P) networks are another source of data to study Internet-wide disruptions. Researchers from Northwestern University (IL) and AT&T Labs used the BitTorrent network, specifically data from a plugin of the Vuze BitTorrent client, to analyze several network events [27], including the disconnection of Egypt and Libya from the Internet [28] and the 2011 Japan earthquake [29]. Assuming a certain dispersion and activity of active P2P clients, this approach is promising, although its strength depends on the popularity of the protocol or application under examination, in particular its usage during the event under study. Internet Background Radiation (IBR). Internet background radiation [30,31] is unsolicited one-way network traffic sent to random IP addresses as a result of malicious or inadvertent software behavior, e.g., worms, scanning, misconfigurations. The pervasive reach of malware and misconfiguration on the Internet causes a vast number of computers to generate background radiation, mostly unbeknownst to their users. The resulting traffic aggregate has proven a useful source of data for observing characteristics not only of the malware itself [32,33,34], but also of other macroscopic events and their impact on communications capabilities. Commercial and academic research groups have used darknets to support security-related data analysis [35,31,36]. For technical as well as political and economic reasons, such traffic is most easily observable using a large number of routed but unassigned IPv4 addresses, i.e., a darknet, where there is no need to filter out legitimate bidirectional traffic. By geolocating the source IP addresses of traffic destined to the darknet addresses, we can identify when sizeable geographic regions appear to have lost connectivity. Country-level disruptions appear prominently visible in the data analysis since geolocating IP addresses to countries is more accurate than finer-grained geolocation, e.g, to cities. In 2005, Casado et al. [37] proposed the use of IBR for "opportunistic measurement" to illuminate network characteristics unrelated to the malware itself. They showed that by analyzing specific categories of IBR they could infer several properties (e.g., access link bandwidth, NAT usage) of the infected hosts generating such traffic. The next section describes how IBR traffic can yield insight into other macroscopic events severe enough to affect Internet connectivity, but unrelated to the malware itself. In particular we show how political events such as large-scale Internet censorship by nation-states, or natural disasters such as earthquakes, can drastically affect the IBR coming from a region, and in doing so illuminate characteristics of the events and their impact on communications capabilities.3 Research results we will transition to practice
Last year, in collaboration with RIPE NCC (collaborator for this proposal), we developed methods to analyze large-scale Internet outages caused by at least two different types of events: government censorship and natural disasters. In [1] we characterized in details the dynamics of two nation-wide censorship events, using a multi-source analysis technique based on (i) BGP measurements, (ii) active forward path probing, (iii) IBR, and (iv) geolocation information. The two most innovative aspects of this approach were the novel use of IBR to study network outages, and the integration of different types of data to enrich inferences. In [3] we focused on using IBR traffic to quantitatively characterize the geographical extent of two natural disasters (earthquakes) in 2011, including introducing a metric to quantify the impact of such disasters on nearby Internet infrastructure. These four case studies of 2011 events (two censorship episodes and two earthquakes) were successful in several dimensions. We showed how these methods can: (i) serve as the basis for detecting (intentional or unintentional) country-level network outages at different levels (control-plane vs. data plane); (ii) identify the filtering technique involved (e.g. BGP withdrawals vs. packet filtering); (iii) identify the networks/ASes which have or have not been affected; (iv) quantify the impact of outages caused by natural disasters or other disruptive scenarios, in terms of geographical or topological scope of networks affected; (v) illuminate the chronology of the outage, from initial signal disappearance to service restoration. We next describe these four examples in more detail, to illustrate applications of our methods and to provide a foundation for the three tasks we propose in Section 4.3.1 Country-level outages caused by censorship
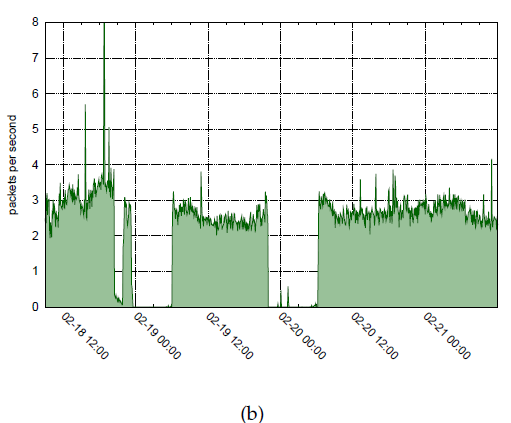
Our recent studies of two geopolitical (nation-wide censorship in Libya and Egypt) events illustrate how IBR data was used for the first time (to our knowledge) in the context of network outage analysis [1,3], and how multiple data sources revealed aspects of outages not revealed by individual data sets. We found that in addition to physical disconnection, the regimes of Libya and Egypt used software mechanisms, disrupting either the routing or harder-to-detect packet forwarding to specific sets of IP addresses [1]. BGP routing disruptions are relatively easy to detect, since they entail changes in the global routing state of the network, i.e., in the control plane. Detecting packet filtering is harder; it requires a view of the data plane either via active probing of the forward path, or monitoring traffic from the affected parts of the network. We used three types of global data available to academic researchers: (1) BGP data (table snapshots and updates) from RouteViews [38] and RIPE NCC's Routing Information Service (RIS) [39]; (2) IBR traffic to unassigned address space collected from the UCSD network telescope [40]; and (3) active forward path traceroute probing from Ark [14] monitors, another source of data-plane data. Using control plane and data plane data sets in combination allows us to ascertain which form of Internet access disruption was implemented in a given region. For example, Figure 1(a) shows BGP data observed during the first two publicly reported outages. In both cases, within a few minutes, 12 of the 13 IPv4 prefixes associated with IP address ranges delegated to Libya were withdrawn. Figure 1(b) shows a view of the same interval reflected in unidirectional (IBR) traffic observed by the UCSD telescope. Comparing Figures 1(a) and 1(b) revealed behavior that conflicted with previous reports [41]: the second outage was not entirely caused by BGP withdrawals. Traffic observed at the telescope shows the outage lasting until approximately February 20 at 6:12 UTC, well beyond when Figures 1(a) shows that BGP routes were restored. This finding suggests that a different disruption technique - a packet-blocking strategy later adopted in the third outage and then widely recognized - was already being used, perhaps being tested, during this second outage. The packet-filtering firewall may have been configured during the BGP shutdown and the routes restored once the packet blocking was effectively in place. The third outage in Libya happened several days later. All publicly observable BGP updates remained visible without interruption, but the darknet traffic dropped sharply, revealing that the longest Libyan outage was not caused by BGP disruption, but by packet filtering, also eventually reported by other sources [42].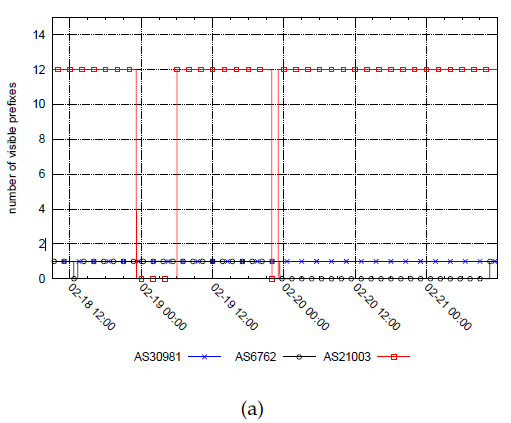
3.2 Internet disruption caused by natural disasters
The other two case studies explore the use of IBR traffic to characterize events at a finer geographic granularity than country-level. In this section we report on an analysis of the Internet reachability failures caused by two geophysical disasters (earthquakes) that struck Christchurch, New Zealand on 22 February 2011 and Tohoku, Japan on 11 March 2011 [3]. We introduced a lightweight but effective metric to analyze the impacts of such disasters in a way that facilitates comparison with other events.
Fraction of Ark traceroutes to addresses in Egypt that terminated in Egypt (either destination, if reached, or the last reachable hop was in Egypt) during late January and early February 2011.
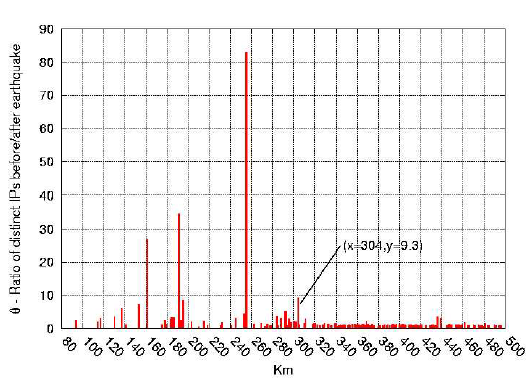
Figure 3: Impact of Tohoku's earthquake and subsequent tsunami on network connectivity: distribution of θ for networks at varying distances from 0 to 500 km, in bins of 1km each. Values of θ around 1 indicate no substantial change in the number of distinct IPs observed in IBR. Plotting the data this way allows us to roughly estimate the maximum radius ρmax of impact of the earthquake on network connectivity (labeled in figure).
The next step is to estimate the maximum radius ρmax of impact of the earthquake on Internet connectivity. Figure 3 plots θ values calculated for network prefixes (address ranges) geolocated at different distances from the epicenter of Tohoku's earthquake, from 0 to 500km in differential 1km wide bins. Values of θ around 1 indicate no substantial change in the number of unique IP addresses observed in IBR before and after the event. Figure 3 shows that there is a significant reduction in the number of IP addresses observed before and after the earthquake, i.e., θ is significantly above 1, for address ranges up to 304km from the epicenter, where θ = 9.3. We consider the distance from the epicenter where this ratio drops and remains below a threshold, as highlighted in Figure 3, to be a rough estimate of the maximum radius of impact of the earthquake on network connectivity, ρmax. Each bin plotted may contain a different number of network prefixes and IP addresses, and the θ ratio is less representative if too few IP addresses are in the numerator. To avoid over-interpreting such bins, we only count (plot data for) bins from which the telescope observed at least 1 IP per hour in the 24-hour period preceding the earthquake. Figure 3 shows that some networks look less affected by the earthquake, which could be true or could reflect errors in our geolocation mappings.
While plotting the θ distributions can help identify the largest region in which network connectivity was directly affected by the earthquake, we would also like to quantify the impact. Figure 4 plots θ for all the networks within a given range (from zero to the value on the x axis), to better reflect the overall impact of the earthquake on the region. We call θmax the largest value of θ observed - together with the distance at which it is observed, θmax represents the magnitude of the impact of the earthquake on nearby infrastructure, as observed by the network telescope.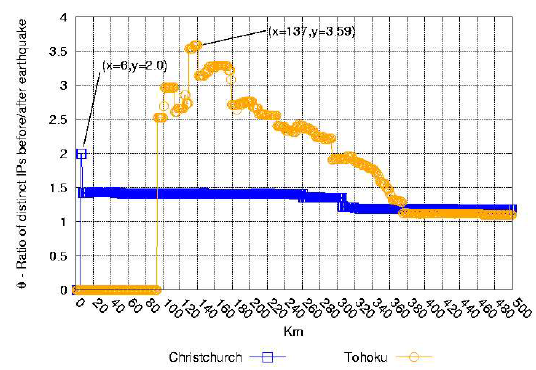
Figure 4: Measuring the impact of the earthquake on network connectivity as seen by the telescope: value of θ for all networks within a given range from the epicenter. The peak value θ max reached by θ is an indicator of the magnitude of the impact.
4 Proposed research
We propose to leverage our successful basic research results to produce a working platform and an experimental service for the detection, real-time monitoring and analysis of large-scale Internet outages worldwide. The project includes three tasks that will proceed in parallel. Task 1 consists of applied research to develop and consolidate the methodology and techniques we will use. For Task 2 we will define requirements for and design the system we will experimentally deploy. Task 3 is the development, testing, deployment and evaluation of the monitoring and analysis platform. In practice we will pursue these three tasks in parallel using an iterative design approach, since as each task progresses it will inform the others.4.1 Task 1: Identification of indicators and combination/correlation strategies
Our first task is to refine and extend the set of composite indicators studied in previous research (cf. Section 3) to support real-time detection and rapid characterization of outage events. Selection of indicators to be implemented in Task 3 requires weighing trade-offs among effectiveness, accuracy, computational load, storage, and automate tracking abilities. We will integrate at least five types of data sources, each with its own processing and analysis challenges:- IBR traffic captured by network telescopes needs to be taxonomized before it can be accurately interpreted. For example, the "backscatter" component includes bursts due to events unrelated to network outages, such as denial-of-service attacks [1]. Another component is random scanning from worms, which may persist when communication is disrupted only in one direction, whereas botnet-controlled scanning may require bidirectional communication. Distinguishing between them can thus help characterize the nature of the outage. The applied research challenge will be to identify which IBR traffic categories are most effective in the analysis and detection of network outages. In addition to the classification we developed for the study described in Section 3.1, we have made further measurable progress in this direction with our recent release of a measurement and analysis tool [47] for taxonomizing one-way traffic according into clearly-defined subsets [47,48].
- We will collect BGP updates observed by route collectors that establish BGP peering sessions with many ISPs around the world [38,39]. BGP updates only provide information about changes in routing state, but each route collector also periodically dumps a snapshot of its entire control plane table (Routing Information Base, or RIB) containing currently reachable prefixes. These periodic dumps in conjunction with the fine-grained updates allow us to precisely track prefix reachability over time, observing when networks disappear from the global Internet or when paths among ASes change. Thus far we have only manually analyzed this data for the known intervals and regions containing the outages attacks [1]; the challenge for this project is to automate this process.
- Active forward path probing from globally distributed probes will routinely measure paths and latency toward the entire IPv4 address space [49,14]. Thus far we have only made limited use of this source of data in our outage analyses, partly due to its low spatial and temporal granularity. But it provides a rich source of information about connectivity and performance not available from the other data sources, and sometimes the most precise information on the location of problems, so we will explore ways to capitalize on this probing methodology. We will augment the current fine-grained but infrequent probing of one random IP in every routed /24 in the IPv4 space (9.7M /24s every 2.5 days) [50] with coarser but more frequent probing of every routed prefix (400K prefixes every 15 minutes, so a reduction by two orders of magnitude in probed destinations as well as probing window), similar to Hubble's probing methods [2]. We will make use of on-demand active measurement functionality being developed by both CAIDA and RIPE, either triggered by alerts from other data sources, or upon authorized user-request.
- IP geolocation data is required to automate monitoring of geographic regions of finer granularity than countries. In [3] we correlated IBR traffic and geolocation data to assess network impact nearby the epicenters of earthquakes. We will explore how to extend this technique to a multi-stage detection approach, monitoring larger regions continuously, and generating alerts to trigger spatially finer-grained monitoring. Designing and experimentally deploying such a system involves several trade-offs related to, e.g., false positive rate, computational load, storage to maintain a backlog of raw (pre-aggregated) data.
- IP-to-Autonomous System data will allow us to aggregate data from all the sources to create relevant groupings of IPs and networks (ASes), in addition to geographic groupings mentioned above. We will also be able to rely on CAIDA's deployed AS Ranking tool which will support an AS-to-organization mapping functionality, and allow us to monitor impacts of outages on specific organization (that may own more than one AS number).
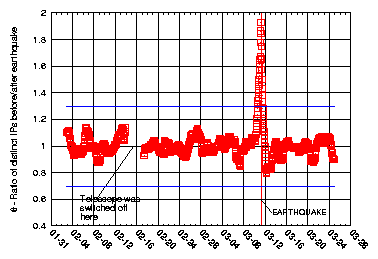
Figure 5: A metric based on the number of distinct IPs observed in IBR clearly exhibits abnormal behavior during the earthquake in Tohoku [3].
4.2 Task 2: Identification and definition of requirements
For Task 2 we will specify all the inputs and outputs and the interactions between each component of the system architecture, the data flows between them, and the requirements for their development and implementation. Figure 6 depicts the main components of the overall system architecture. The system will build on pre-existing data sources accessible through the Internet (or locally, in the case of data hosted at UCSD facilities) collected by other measurement infrastructures. The specific data sources that we plan to use initially are: UCSD telescope packet headers, Route Views/RIPE BGP tables and updates, Ark traceroute-based data and meta-data, Atlas active measurement data as available, IP geolocation data from MaxMind, and CAIDA's IP-to-Autonomous-System(AS) and AS-to-organization mappings. We will document our analysis of the requirements - in terms of storage, processing, functional capabilities, as well as timeliness - related to the interaction with the measurement infrastructures. Raw measurement data will be continuously archived on local storage for processing at regular intervals (e.g. 10 minutes, 1 hour) by software modules that will produce intermediate data for visualization, detection, and impact analysis. The UCSD telescope [40] that continuously observes a /8 network (1/256th of the IPv4 address space - about 16.7 million IP addresses) captures 2-10 GB of traffic per hour, a daunting workload that could overwhelm the storage and processing resources of the project. Fortunately we will leverage advanced capabilities being developed for a related NSF-funded CRI project [52], specifically the automated classification of IBR traffic as a way of distilling massive data volumes with minimal compromise in terms of signal lost. To increase the accuracy and scope of our analysis, we will attempt to merge information of the same type provided by different data sources. For example, a system requirement will be to merge BGP measurements from two different platforms: RouteViews [38] and RIPE NCC's Routing Information Service (RIS) [39]. With the help of our collaborator Emile Aben at RIPE, we will also explore the merging of active measurements data from CAIDA's Ark [14] and RIPE Atlas [49] platforms. Resources permitting, we may consider the possibility of defining a pluggable architecture, supporting the addition of completely new data sources, such as UC Berkeley's Fathom Firefox extension [53], or the BitTorrent measurement plugin from Northwestern University's [54]. The processing modules will first perform data sanitization, classification, geolocation, AS mapping, and data aggregation. In the second stage, other modules will extract metrics from these aggregated data and correlate them, storing output in efficient data structures (such as the round robin databases implemented by RRDtool) that will feed both data visualization and change-point detection algorithms. This two-stage process can be circular. For example, when an event is detected (or user-reported), the system may perform additional processing, e.g., specific data aggregation related to the area of interest, and recalculation of metrics quantifying the impact. The system may even perform additional reachability measurements on demand, for example if a user reports a regional disaster, or BGP data indicates a prefix is unreachable, we can trigger traceroute measurements from various Ark nodes to verify the scope of unreachability. For this functionality we will leverage technology being developed for another related NSF-funded CRI project [55]: a module to link Ark topology data to global BGP (inter-domain routing) data. A web platform will provide data visualization and a user interface through which the user will be able to locate the events on a geographical map and monitor the metrics calculated over time. Optionally, we will also implement topological representation of the portion of network infrastructure affected by the event. The web interface will allow an authorized user to query the system for a specific geographical area or AS, and upon request start on-demand measurements to a specified portion of the Internet (if compatible with current availability of the required measurement infrastructure). We will design other means of delivering alerts, e.g. email, instant messaging, cellular network.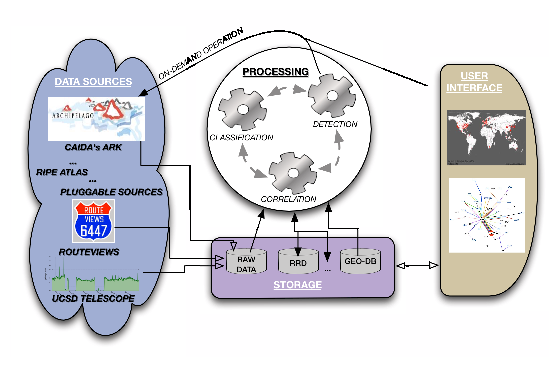
4.3 Task 3: Development, testing, deployment, and evaluation
In Task 3 we will develop, prototype, test and experimentally deploy the measurement infrastructure and automated detection and analysis system. Leveraging the results from our previous work and progressively taking as input the outcomes of the other tasks, we will go through several stages of iterative refinement in a cyclic development process. First, we will design and implement the software of the processing components by developing a common layer of functions and data structures in a software library (e.g. interface to geolocation data, fast longest-prefix-matching lookups, communication among the components, etc.), but implementing the distinct functionalities in separate modules. When exploring the design and implementation of the pluggability of other external data sources, we will implement a general interface for the interaction with them. We will build on our experience with user-friendly interactive visual interfaces to our AS Ranking and other web-based information platforms we have supported over the last decade. As required by the solicitation, all the software developed in the course of the project will be released under an open source license listed by the Open Source Initiative [56]. We will also evaluate the potential impact that our analysis and dissemination of results may have on network operators, as described in the appendix of our censorship study [1] which explained and justified the anonymization scheme we used. To test the software, we will start by simulating a replication of the events manually analyzed in our previous studies. By simulating the real-time acquisition of the original data, we will create test cases that will be used to refine the system architecture and to tune parameters. Part of these test cases will be used to build demonstration scenarios to show how to use the developed technology. As part of the testing and evaluation, we will maintain a blog in year three (or a sub-thread of the existing CAIDA blog), to report on events detected and analyzed using the deployed system. Timely reporting on the blog will enable comparison of our analyses to other published analysis as well as mainstream-media reporting.5 Team qualifications
The combination of skills required for the proposed work is unique, including first-hand knowledge of operational and engineering realities of designing and running large-scale Internet monitoring systems, curation and normalization of collected heterogeneous data sets, and the ability to critically evaluate, interpret, correlate, and validate huge volumes of data. The project will involve academic researchers from UCSD as well as data, software, and personnel support from RIPE NCC. Each partner offers a unique complementary contribution, allowing the results of this academic-industry collaborative effort to be greater than the sum of individual contributions. The major tasks of the project will be carried out by the Cooperative Association for Internet Data Analysis (CAIDA) at the University of California, San Diego. CAIDA is recognized as a world leader in Internet measurement and data analysis, and has published several landmark studies of Internet performance, workload, and topology issues and operational aspects [57]. CAIDA has more than a decade of experience in development, implementation, and evaluation of measurement platforms, as well as with data collection, curation, analysis, and dissemination. To technical, operational, and policy communities, CAIDA is among the most trusted sources of objective measurement tools and analyses. RIPE NCC is one of five Regional Internet Registries providing Internet resource allocations, registration services and coordination activities that support the operation of the global Internet. For this project, RIPE NCC will contribute BGP data collected through its RIPE RIS platform, active measurement data from their RIPE Atlas infrastructure [49], and technical expertise in BGP data analysis [58], with specific regard to network outages and connectivity disruption [59,60].6 Broader impact activities
Consistent with the SaTC program goals, the primary objective of this project is to convert successful research results into a deployed platform to detect and monitor macroscopic connectivity disruption on a global planetary scale. The developed open-source software tools will immediately benefit both the network research and operational communities, and promote a more secure and trustworthy Internet infrastructure. The results of this project will be broadly disseminated, presented to research, operational and commercial sectors, and shared with appropriate government agencies, helping to inform communications and technology policies. We will promote our findings via conferences, meetings, web pages and CAIDA's blog. We also communicate regularly with government agencies (DHS and NSA in addition to NSF) on how to leverage the utility of our monitoring and analysis projects for critical infrastructure protection in the United States. Insights into the nature and causes of network outages, including whether they are intentional or accidental, is key to providing national decision-makers with information to determine the type and extent of proper reponse. We are excited at the opportunities to provide empirical grounding to such highly politicized socioeconomic, legal and technical issues, and to bridge the gap between technology and policy to develop new or substantiate hypothesized correlations between technical and socio-political-economic events. CAIDA is known worldwide for its dedication to data sharing with the research community. We will publish data sets and analysis tools resulting from this project, including automated tools to process IBR traffic and BGP data, and annotated measurement data for specific macroscopic events. We will support researcher and government access to our raw monitoring data under our "Privacy Sensitive Data Sharing" framework [61]. CAIDA participates in DHS's PREDICT project, which aims to publicize and provide datasets for cybersecurity research. We will index data into PREDICT where appropriate.References
- [1]
- A. Dainotti, C. Squarcella, E. Aben, K. C. Claffy, M. Chiesa, M. Russo, and A. Pescapé, "Analysis of country-wide Internet outages caused by censorship," in Proceedings of the 2011 ACM SIGCOMM conference on Internet measurement, IMC '11, pp. 1-18, ACM, 2011.
- [2]
- E. Katz-Bassett, H. V. Madhyastha, J. P. John, A. Krishnamurthy, D. Wetherall, and T. Anderson, "Studying Black Holes in the Internet with Hubble," USENIX Symposium on Networked Systems Design & Implementation (NSDI), 2008.
- [3]
- A. Dainotti, R. Amman, E. Aben, and K. C. Claffy, "Extracting benefit from harm: using malware pollution to analyze the impact of political and geophysical events on the internet," SIGCOMM Comput. Commun. Rev., vol. 42, no. 1, pp. 31-39.
- [4]
- Executive Office of the President, National Science and Technology Council, "Trustworthy cyberspace: Strategic Plan for the Federal Cybersecurity Research and Development Program," December 2011. http://www.cyber.st.dhs.gov/wp-content/uploads/2011/12/Fed_Cybersecurity_RD_Strategic_Plan_2011.pdf.
- [5]
- J. Li and S. Brooks, "I-seismograph: Observing and measuring Internet earthquakes," Infocom 2011 proceedings, April 2011.
- [6]
- J. Cowie, "Japan quake." http://www.renesys.com/blog/2011/03/japan-quake.shtml, March 11 2011.
- [7]
- E. Zmijewski, "Georgia Clings to the `Net." http://www.renesys.com/blog/2008/08/georgia-clings-to-the-net.shtml, Aug 10 2008.
- [8]
- J. Cowie, "Egypt Leaves the Internet." http://www.renesys.com/blog/2011/01/egypt-leaves-the-internet.shtml, Jan 27 2011.
- [9]
- J. Cowie, "Libyan disconnect." http://www.renesys.com/blog/2011/02/libyan-disconnect-1.shtml, February 18 2011.
- [10]
- SLAC National Accelerator Laboratory, "The PingER Project." http://www-iepm.slac.stanford.edu/pinger/site.html.
- [11]
- L. Cottrell, "Internet End-to-End Performance Monitoring - Japanese Earthquake," April 2011. https://confluence.slac.stanford.edu/display/IEPM/Japanese+Earthquake+March+11th%2C+2011.
- [12]
- Aaron Schulman and Neil Spring, "Pingin' in the Rain," in Internet Measurement Conference, November 2011.
- [13]
- V. Jacobson, "traceroute." https://wiki.geant.org/display/public/EK/VanJacobsonTraceroute.
- [14]
- C. A. for Internet Data Analysis, "Archipelago Measurement Infrastructure." https://www.caida.org/projects/ark.
- [15]
- Y. Shavitt and E. Shir, "DIMES: Let the Internet Measure Itself," SIGCOMM Comput. Commun. Rev., vol. 35, pp. 71-74, October 2005.
- [16]
- Harsha V. Madhyastha and Ethan Katz-Bassett and Tom Anderson and Arvind Krishnamurthy and Arun Venkataramani, "iPlane: An Information Plane for Distributed Services." http://iplane.cs.washington.edu/.
- [17]
- K. Keys, Y. Hyun, M. Luckie, and k claffy, "Internet-Scale IPv4 Alias Resolution with MIDAR: System Architecture," May 2011. in submission, https://www.caida.org/catalog/papers/2011_midar_tr/midar-tr.pdf.
- [18]
- Randy Bush and Olaf Maennel and Matthew Roughan and Steve Uhlig, "Internet Optometry: Assessing the Broken Glasses in Internet Reachability," in ACM Internet Measurement Conference, 2009.
- [19]
- E. Katz-Bassett, H. V. Madhyastha, J. P. John, A. Krishnamurthy, D. Wetherall, and T. Anderson, "Studying Black Holes in the Internet with Hubble," in USENIX Networked Systems Design & Implementation (NSDI), 2008.
- [20]
- C. Labovitz, S. Iekel-Johnson, D. McPherson, J. Oberheide, and F. Jahanian, "Internet inter-domain traffic," SIGCOMM Comput. Commun. Rev., vol. 40, August 2010.
- [21]
- C. Labovitz, "Attack Severs Burma Internet." http://asert.arbornetworks.com/2010/11/attac-severs-myanmar-internet/, November 3 2010.
- [22]
- J. Nazario, "Georgia DDoS Attacks," August 12 2008. http://asert.arbornetworks.com/2008/08/georgia-ddos-attacks-a-quick-summary-of-observations/.
- [23]
- C. Labovitz, "Egypt Loses the Internet." http://asert.arbornetworks.com/2011/01/egypt-loses-the-internet/, February 2011.
- [24]
- C. Labovitz, "Egypt returns to the Internet." http://asert.arbornetworks.com/2011/02/egypt-returns-to-the-internet/, February 2011.
- [25]
- C. Labovitz, "Libya Firewall Begins to Crumble?." http://monkey.org/~labovit/blog//viewpage.php?page=libya_firewall_cracks.
- [26]
- Google, "Transparency report," 2011. http://www.google.com/transparencyreport/.
- [27]
- D. R. Choffnes, F. E. Bustamante, and Z. Ge, "Crowdsourcing Service-level Network Event Monitoring," in Proceedings of the ACM SIGCOMM 2010 conference on SIGCOMM, SIGCOMM '10, (New York, NY, USA), pp. 387-398, ACM, 2010.
- [28]
- Z. Bischof and J. Otto, "Egypt and Libya Internet disconnections." http://www.aqualab.cs.northwestern.edu/blog/egypt-libya-peers.html, March 10 2011.
- [29]
- Z. S. Bischof, J. S. Otto, and F. E. Bustamante, "Distributed systems and natural disasters: Bittorrent as a global witness," in Proceedings of the Special Workshop on Internet and Disasters, SWID '11, (New York, NY, USA), pp. 4:1-4:8, ACM, 2011.
- [30]
- R. Pang, V. Yegneswaran, P. Barford, V. Paxson, and L. Peterson, "Characteristics of internet background radiation," ACM SIGCOMM conference on Internet measurement, 2004.
- [31]
- E. Wustrow, M. Karir, M. Bailey, F. Jahanian, and G. Huston, "Internet background radiation revisited," in Internet Measurement Conference, (New York, NY, USA), ACM, 2010.
- [32]
- D. Moore, C. Shannon, D. J. Brown, G. M. Voelker, and S. Savage, "Inferring Internet denial-of-service activity," ACM Trans. Comput. Syst., vol. 24, pp. 115-139, May 2006.
- [33]
- D. Moore, V. Paxson, S. Savage, C. Shannon, S. Staniford, and N. Weaver, "Inside the Slammer Worm," IEEE Security and Privacy, vol. 1, pp. 33-39, July 2003.
- [34]
- A. Dainotti, A. Pescapé, and G. Ventre, "Worm traffic analysis and characterization," in IEEE ICC 2007, June 2007.
- [35]
- M. Bailey, E. Cooke, F. Jahanian, N. Provos, K. Rosaen, and D. Watson, "Data reduction for the scalable automated analysis of distributed darknet traffic," in ACM SIGCOMM conference on Internet Measurement, 2005.
- [36]
- P. Kijewski, "Automated Extraction of Threat Signatures from Network Flows," 18th Annual FIRST conference, June 2006.
- [37]
- Marin Casado and Tal Garfinkel and Weidong Cui and Vern Paxson and Stefan Savage, "Opportunistic Measurement: Spurious Network Events as a Light in the Darkness," in HotNets IV, 2005.
- [38]
- Routeviews, "University of Oregon Route Views Project." http://www.routeviews.org.
- [39]
- RIPE Network Coordination Center (NCC), "Routing Information Service (RIS)." http://www.ripe.net/data-tools/stats/ris/routing-information-service.
- [40]
- C. A. for Internet Data Analysis, "UCSD Network Telescope," 2010. https://www.caida.org/data/passive/network_telescope.
- [41]
- J. Cowie, "Libyan Disconnect." http://www.renesys.com/blog/2011/02/libyan-disconnect-1.shtml, February 2011.
- [42]
- J. Cowie, "What Libya Learned from Egypt." http://www.renesys.com/blog/2011/03/what-libya-learned-from-egypt.shtml, March 2011.
- [43]
- Y. Hyun, B. Huffaker, D. Andersen, E. Aben, C. Shannon, M. Luckie, and K. C. Claffy, "The IPv4 Routed /24 Topology Dataset," 2011. https://www.caida.org/catalog/datasets/ipv4_routed_24_topology_dataset/.
- [44]
- R. Bush, O. Maennel, M. Roughan, and S. Uhlig, "Internet optometry: assessing the broken glasses in Internet reachability," in ACM SIGCOMM conference on Internet measurement, 2009.
- [45]
- MaxMind, "GeoLite City," April 2011. http://www.maxmind.com/app/geolitecity.
- [46]
- R. W. Sinnot, "Virtues of the Haversine," Sky and Telescope, vol. 68, p. 159, 1984.
- [47]
- Nevil Brownlee, "One-way Traffic Monitoring with iatmon," in Passive and Active Measurement, 2012. to appear.
- [48]
- J. Treurniet, "A network activity classification schema and its application to scan detection," IEEE/ACM Transactions on Networking, vol. PP, no. 99, 2011.
- [49]
- R. K. RIPE Labs, "RIPE Atlas," February 2011. presented at AIMS2011, https://www.caida.org/workshops/isma/1102/slides/aims1102_rkisteleki.pdf.
- [50]
- Kimberly Claffy and Young Hyun and Ken Keys and Marina Fomenkov and Dmitri Krioukov, "Internet Mapping: from Art to Science," in IEEE DHS Cybersecurity Applications and Technologies Conference for Homeland Security (CATCH), March 2009.
- [51]
- B. Krishnamurthy, S. Sen, Y. Zhang, and Y. Chen, "Sketch-based change detection: methods, evaluation, and applications," in Proceedings of the 3rd ACM SIGCOMM conference on Internet measurement, IMC '03, (New York, NY, USA), pp. 234-247, ACM, 2003.
- [52]
- Kimberly Claffy, "CRI-Telescope: A Real-time Lens into Dark Address Space of the Internet," 2010. https://www.caida.org/funding/cri-telescope/.
- [53]
- Mohan Dhawan and Justin Samuel and Renata Teixeira and Christian Kreibich and Mark Allman and and Vern Paxson, "The fathom firefox extension: A browser-based network measurement platform," 2011. http://fathom.icsi.berkeley.edu/.
- [54]
- Zachary S. Bischof and John S. Otto and and Fabian E. Bustamante, "Distributed Systems and Natural Disasters - BitTorrent as a Global Witness," in CoNEXT Special Workshop on the Internet and Disasters (SWID), December 2011.
- [55]
- Kimberly Claffy, "CRI-ADDO-EN: Internet Laboratory for Empirical Network Science (iLENS)," 2010. https://www.caida.org/funding/ilens/.
- [56]
- "Open Source Initiative," 2012. http://www.opensource.org.
- [57]
- The Cooperative Association for Internet Data Analysis, "Papers by CAIDA Personnel and Collaborators." https://catalog.caida.org/paper/.
- [58]
- RIPE, "RIS Raw Data." http://www.ripe.net/data-tools/stats/ris/ris-raw-data.
- [59]
- "YouTube Hijacking: A RIPE NCC RIS case study." http://www.ripe.net/internet-coordination/news/industry-developments/youtube-hijacking-a-ripe-ncc-ris-case-study, March 2008.
- [60]
- E. Aben, "Unsolicited Internet Traffic from Libya." http://labs.ripe.net/Members/emileaben/unsolicited-internet-traffic-from-libya, March 2011.
- [61]
- E. Kenneally and K. Claffy, "Dialing Privacy and Utility: A Proposed Data-sharing Framework to Advance Internet Research," IEEE Security and Privacy (S&P), July 2010. https://catalog.caida.org/paper/2009_dialing_privacy_utility.
File translated from TEX by T T H, version 3.87.
On 13 Nov 2012, 15:31.