

Speed Test: Measuring Critical Infrastructure for Coronavirus-related Congestion
The proposal "Speed Test: Measuring Critical Infrastructure for Coronavirus-related Congestion" is also available in PDF.
Principal Investigators: Ka Pui Mok kc claffy
Funding source: CNS-2028506 Period of performance: April 27, 2020 - October 31, 2020.
1 Introduction and Motivation
In the crisis of the coronavirus pandemic, the Internet is facing unprecedented surges of traffic induced by the use of cloud-based tele-communicating and remote education tools for real-time video meetings and online classes. While sophisticated traffic engineering (e.g., SWAN [9], B4 [12]) enables cloud providers to dynamically reroute traffic to mitigate congestion, interconnections between ISPs and cloud providers (cloud-ISP links) rely on peering links at IXPs, private peering links, or transit providers. These interconnections have limited capacity, and are prone to congestion. Microsoft recently reported a 775% increase in Teams' online meeting users in a one month period in Italy due to social distancing, and the application of higher bandwidth constraints to cloud applications to mitigate network congestion [1]. This pandemic induced shift in network traffic and amplified the concerns regarding network congestion between these critical infrastructures, as the degraded performance and quality of experience (QoE) of cloud-based applications could negatively impact work and learning performance. However, these is no scientific study to focus on measuring the performance, reliability and resiliency of these cloud-ISP links.Measuring from cloud providers, such as Amazon EC2, Google Compute Engine (GCE), and Microsoft Azure, can better reveal the performance impact of congestion on cloud-ISP links than existing throughput measurements from the edge, due to the location of available vantage points (Figure 1). For example, M-Lab nodes mostly connect to transit ISPs (e.g., Level3 and TATA). Results from NDT only measure paths from users to their transit ISPs (dark grey line). In contrast, web-based speed tests (e.g., Xfinity speed test and Ookla speedtest) and FCC MBA boxes, which aim to measure access link capacity, often use test servers geographically close and in the same ISP as users, to achieve low latency and maximum throughput. Thus, such measurement traffic often stays within the same ISP (light green line). Traffic induced from these two types of measurements do not traverse the cloud-ISP links (red lines).
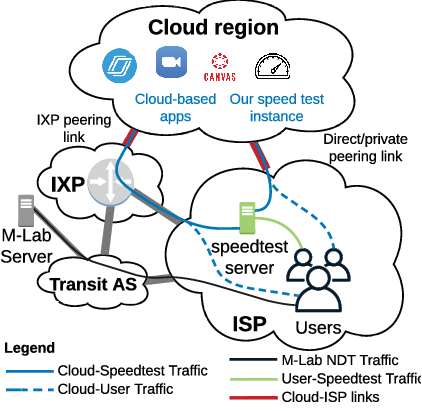
Figure 1: Simplified topology between cloud providers and ISPs. Tests initiated by end-users do not traverse cloud-ISP links. Results are not representative of the performance of cloud-based apps.
Nevertheless, diverse geographical and topological distribution of test servers create opportunities to measure cloud-ISP links. Instead of initiating tests from end-users, we propose to perform tests from the cloud to speed test servers. When we select appropriate test servers, the measurement traffic traverses the same cloud-ISP links as cloud application traffic. Furthermore, speed test servers are dedicated to conducting measurements. We do not need to send unsolicited probes to random hosts, and mitigate the risk of inducing additional load on other services. Test servers in the same platform adopt the same set of measurement APIs, enabling us to deploy large-scale experiments quickly.
Our first task will be to design and develop longitudinal experiments to measure and monitor network performance between cloud providers and ISPs. We will leverage speed test servers deployed by multiple test platforms to measure network throughput from cloud providers. This main challenge we will tackle in this task is to select the minimum set of speed test servers (from over one thousand in U.S.) that comprehensively covers interconnections between residential broadband ISPs and cloud providers. We have developed a set of tools (webtestkit) based on headless browser libraries to automate the execution of speed tests and collect measurement results. With the set of selected servers, we can immediately deploy measurements to capture data during COVID-19 pandemic.
Our second task focuses on establishing scientifically sound analysis the data we will collect. Measurement parameters adopted by speed test platforms vary, lead to discrepancies in results. We will employ cross-layer analysis to characterize the behavior of speed tests (at the application layer) and correlate with events captured at the network layer. This task will include testbed experiments to simulate different network and system conditions, which will enable us to train machine learning models to identify sources of inaccuracy and calibrate measurement results.
Why we believe NSF should fund this work to respond to COVID-19 crisis. Our implementation of automated speed test software is ready to deploy. We seek to start measurements immediately to capture the impact of COVID-19 on society's use of critical communications infrastructure. As the pandemic-induced loads on the Internet ease and network traffic patterns revert to normal, we will conduct post-event analysis to study evidence of performance changes during and after the crisis. We will ask ISPs to validate our inferences of interdomain link congestion. We are also working with the CEO of Kentik traffic monitoring systems who is hosting a series of industry panels on network scaling during this period, e.g., [13]. We believe that the data we will collect can comprehensively cover a number of critical Internet infrastructures that have been impacted by this crisis (See Table 1).
| Core ISP | Yes. Transit providers that connect access ISPs to cloud providers. |
| Access ISP | Yes. U.S. residential broadband providers. |
| IXP | Yes. IXPs where ISPs and cloud providers form peering. |
| What's measured | Network latency, packet loss, download/upload throughput |
| Historic Data | CAIDA's congestion measurement (MANIC [5]), ISP validation |
| Methodology | traceroute, speed tests (See § 3) |
| Granularity | time: 15-min; space: IP link (network), city (geographical) (See § 3) |
2 Related work and Background
Topology and performance of cloud. In 2010, CloudCmp [14] compared the performance and cost of public cloud providers and used iperf to measure network throughput within the same and between cloud platforms. Chiu et al. [4] employed public cloud platforms as vantage points to investigate Internet path lengths. By leveraging cloud providers' global footprints and high capacity backbone between data centers, users can transport data using inter-data center paths rather than the public Internet [8], for better performance. Recent work [25] evaluated the performance of different strategies in connecting multiple cloud providers. However, none of these works evaluated the performance of the interconnects between cloud providers and ISPs.Inferring interdomain congestion CAIDA has been performing measurement from Archipelago platform using Time Series Latency Probing (TSLP) [16] to infer congestion on interdomain links. In 2018, we analyzed two years of data to study the phenomenon of interdomain congestion in U.S. ISPs [5]. To cross-validate against performance of specific web application, we investigated the use of interconnections between ISPs and YouTube in [19]. Sundaresan et al. [24] discussed the challenges of using data collected by a crowdsourcing-based speed test (M-Lab NDT) to study congestion on the Internet.
Speed test measurement. In 2012, Goga and Teixeira [7] compared the accuracy of flooding-based methods and several probe-optimized tools (Spruce [22], Pathchirp [20], IGI/PTR [10], and Pathload [11]) for measuring residential broadband performance from home gateways. Although some methods were more lightweight than parallel TCP flows, the measurements often required control of both end-points, which is infeasible to deploy quickly. Sundaresan et al. [23] conducted experiments to determine the number of parallel TCP flows required to accurately perform throughput measurements using the BISMark platform. However, both studies were conducted in relatively low-speed environments (approximately 20 Mbps). Li et al. [15] evaluated three commonly used browser-based delay measurement methods, and found that a socket-based approach incurred smaller overhead than an HTTP-based approach. Feamster and Livingood [6] and Bauer et al. [2] identified potential issues in various speed test platforms for measuring Gigabit broadband networks, such as the use of single TCP flows in M-Lab's NDT, and the selection of off-net measurement servers. In this research, we will tackle some of the problems by considering network paths traversed by measurement traffic and capture metadata from multiple layers to identify possible sources of inaccuracy.
3 Task 1: Measuring congestion between cloud providers and ISPs
Our first task will be on designing and deploying scientifically sound experiments to measure the performance of cloud-ISP links. We will orchestrate multiple speed test platforms and three major cloud providers (Amazon AWS, Google GCE, Microsoft Azure) to perform large-scale Internet measurement. The data we will collect can shed light on the performance of cloud-based teleconferencing and remote educating applications during this period of intense testing of the Internet resilience.Research questions. Our first set of research questions revolves around the need to understand and characterize the performance of cloud-ISP links in the U.S. As network traffic has migrated from business networks to home networks, do the cloud infrastructures provision sufficient bandwidth to residential broadband ISPs? How does interconnection performance differ by region in the U.S.? How does inter-region performance of different cloud providers? What is the level and duration of congestion during peak hours?
Measurement approach. Our approach is to adapt our existing measurement techniques and tools to 1) discover all cloud-ISP links in traceroute data using bdrmap [17], 2) identify the cloud-ISP links used by target ISPs by comparing IP address in traceroute measurement results from cloud to test servers, as described in [19], and 3) strategically select speed test servers to perform throughput measurement with our automated web speed test scripts (webtestkit). PI Mok and his team have rich experience in deploying bdrmap on Linux-based machines and identifying interdomain links from traceroute. We will carefully design the third step by taking the following three factors into account.
1. Test server selection. As of today, there are 1,147, 150, and 64 U.S. test servers deployed by Ookla, Comcast, and M-Lab, respectively. The measurement overhead will be huge to perform speed tests to all these servers, especially running experiments longitudinally from multiple cloud platforms and regions. Therefore, we will measure a representative subset of these tests servers. We will first run bdrmap measurement on each cloud instance to obtain a list of cloud-ISP links observed by each instance. Each link is represented by two IP addresses, namely near-side and far-side of the boundary between the cloud provider and the ISP, respectively. We will pre-process the list of test servers by aggregating those co-located in the same city connected to the same ISP. We then initiate traceroute to measure the forward paths from our cloud instances to the servers. By comparing the IP hops with the far-side IPs, we will be able to identify cloud-ISP links used for reaching the test servers. Because different ISPs, particularly small regional ISPs, rely on connectivity to their upstream providers, we can cluster test servers according to far-side IPs of cloud-ISP links. Although we can use any test server in a given cluster to measure a cloud-ISP link, we will prefer the one closest to the physical location of the cloud datacenter hosting our instances and with the shortest AS path to the cloud instance. This approach can lower the network latency between cloud instances and servers, and also reduce measurement noise from interdomain links in downstream ISPs.
2. IP and server geolocation. We have developed tools to extract geographic locations of speed test servers, annotated by the speed test platforms, i.e., they tend to provide responsive vantage points with known geolocations. We will also validate the information with IP geolocation databases, such as Netacuity and MaxMind. (We have an academic research agreement with Netacuity to use their service.) However, these databases are less accurate for router infrastructure IP addresses. To compensate for this risk of inaccuracy in geolocating IP hops between the cloud and the test servers, we will use geographic hints embedded in their hostnames. More specifically, we will employ CAIDA’s DDec [3] and the recent Hoiho tool [18] developed by our collaborator Matthew Luckie to inform hostname-based IP geolocation.
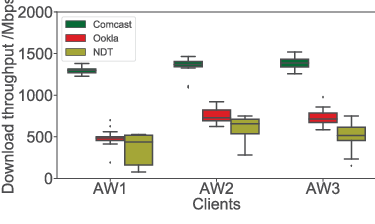
Figure 2: Three speed tests reported different throughput. We will investigate whether the cause of degraded network performance, e.g., traffic congestion induced by COVID-19.
3. Measurement granularity.
We will conduct measurements at least once per hour. We will increase the frequency of measurement up to 4X/hour during business hours to capture telecommuting-related demand for cloud services. For space granularity, our measurements will cover all U.S. regions served by the cloud platforms. We analyzed the location of test servers. Speed test servers cover many metropolitan cities served by major ISPs. In terms of coverage of networks, apart from major ISPs (e.g, AT&T, Cox, Comcast, and Spectrum), we found servers deployed by transit providers (e.g., Cogent, Level3, and TATA) and regional ISPs (e.g., Vast Broadband and Midco).Preliminary tests on Amazon AWS. We used our webtestkit to run a pilot study from three Amazon AWS regions in Ohio, Oregon, and Virginia. We ran each speed test 20 times. Figure 2 showed that Comcast tests reported high and consistent speed, but the Ookla speed test and NDT showed lower throughput with higher variance in the results. This disparity in measurement informs our proposed plan to manually select test servers (which we did not do here) to minimize noise from unstable server selection in speed test platforms.
4 Task 2: Analyze the behavior of speed tests and congestion related to COVID-19
Research questions. The research questions are driven by the long-standing wide discrepancies among results from different web-based speed test implementations. How do we interpret, calibrate, and validate measurement results to derive unbiased inferences of network performance? With scientifically validated results, how can we identify the impact of COVID-19 motivated changes to network usage on network performance?Approach and challenges. High quality measurement data is important for data analysis to answer research questions related to the impact of COVID-19. Therefore, characterizing the behavior of the measurement tools is essential. Reported speed from the tests is not sufficient to analyze confounding factors that induced by the implementation and also environmental factors. We will conduct the following two analyses in this task.
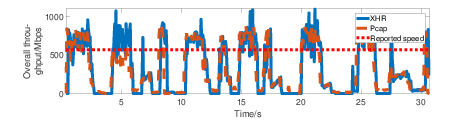
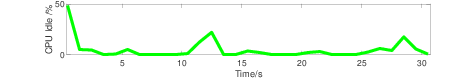
Figure 3: Overall throughput and CPU idle percentage of fast.com test performed on a legacy machine. ON-OFF pattern due to high data rate exhausting the CPU, caused inaccurate throughput measurement.
1. Cross-layer analysis on speed test measurements. Our webtestkit uses tcpdump to capture packets and browser performance logs to obtain HTTP transaction data during tests. We also employ SoMeta [21] to record system status (e.g., CPU and memory usage) in the background. We will first characterize different implementations of tests using a controlled environment connected to our campus network. HTTP transaction data sheds light on the number of concurrent TCP flows, the number and sizes of HTTP requests used in different tests, and request-response times. We can correlate application information with timing of packets and TCP information to obtain a fine-grain view of individual flows. Furthermore, the system-level metadata will reveal insights into the computation power and memory size of the cloud instances. Figure 3 shows some preliminary results from our testbed to show how insufficient CPU can severely impair on test results. We will train machine learning models to identify this pattern and screen out inaccurate tests.
2. Correlating with the crisis of COVID-19 We will launch the proposed measurements promptly to capture the data during the interval covered by stay-at-home orders and remote education activities. We will conduct timeseries analysis, including autocorrelation and level-shift detection algorithms that we used in [5], to analyze patterns and changes in performance, including changes as U.S. work/school patterns evolve back to normal.
As a baseline, we will leverage the interdomain link congestion data we have been collecting with CAIDA's Ark platform since 2016. The data contains congestion inferences based on latency of traceroute probes and partial coverage of interdomain links between cloud and ISPs. In previous work [5], we found that inferred evidence of congestion positively correlated with network throughput measurements. We will leverage this data as a baseline for overlapping interdomain links measured from residential edge nodes (in the upstream direction) and the cloud (in the opposite direction). We will also seek validate from ISPs for our inferences of interdomain link congestion.
5 Data dissemination
We will leverage the InfluxDB and Grafana dashboard infrastructure that we built for CAIDA's previous NSF project to publish a public dashboard to visualize timeseries network performance data. To support reproducible research, we will also implement a set of web APIs to enable researchers to easily access the raw data with data analytics tools, such as Jupyter notebooks.References
- [1]
- M. Azure. Update #2 on microsoft cloud services continuity. https://azure.microsoft.com/en-us/blog/update-2-on-microsoft-cloud-services-continuity/.
- [2]
- S. Bauer, W. Lehr, and M. Mou. Improving the measurement and analysis of gigabit broadband networks. Technical report, Massachusetts Institute of Technology, 2016.
- [3]
- CAIDA. DNS decoded (DDec). http://ddec.caida.org.
- [4]
- Y.-C. Chiu, B. Schlinker, A. B. Radhakrishnan, E. Katz-Bassett, and R. Govindan. Are we one hop away from a better Internet? In Proc. ACM IMC, 2015.
- [5]
- A. Dhamdhere, D. Clark, A. Gamero-Garrido, M. Luckie, R. Mok, G. Akiwate, K. Gogia, V. Bajpai, A. Snoeren, and k. claffy. Inferring Persistent Interdomain Congestion. In ACM SIGCOMM, Aug 2018.
- [6]
- N. Feamster and J. Livingood. Internet speed measurement: Current challenges and future recommendations. arXiv:1905.02334, 2019.
- [7]
- O. Goga and R. Teixeira. Speed measurements of residential Internet access. In Proc. PAM, 2012.
- [8]
- O. Haq, M. Raja, and F. R. Dogar. Measuring and improving the reliability of wide-area cloud paths. In Proc. WWW, 2017.
- [9]
- C.-Y. Hong, S. Kandula, R. Mahajan, M. Zhang, V. Gill, M. Nanduri, and R. Wattenhofer. Achieving high utilization with software-driven WAN. In Proc. ACM SIGCOMM, 2013.
- [10]
- N. Hu and P. Steenkiste. Evaluation and characterization of available bandwidth probing techniques. IEEE J.Sel. A. Commun., 21(6):879-894, Sept. 2006.
- [11]
- M. Jain and C. Dovrolis. End-to-end available bandwidth: Measurement methodology, dynamics, and relation with tcp throughput. IEEE/ACM Trans. Netw., 11(4):537-549, Aug. 2003.
- [12]
- S. Jain, A. Kumar, S. Mandal, J. Ong, L. Poutievski, A. Singh, S. Venkata, J. Wanderer, J. Zhou, M. Zhu, J. Zolla, U. Hölzle, S. Stuart, and A. Vahdat. B4: Experience with a Globally-Deployed Software Defined WAN. In Proc. ACM SIGCOMM, 2013.
- [13]
- kentik. How leading companies support remote work and digital experience. https://www.kentik.com/go/virtual-remote-work-panel/.
- [14]
- A. Li, X. Yang, S. Kandula, and M. Zhang. CloudCmp: Comparing public cloud providers. In Proc. ACM IMC, 2010.
- [15]
- W. Li, R. Mok, R. Chang, and W. Fok. Appraising the delay accuracy in browser-based network measurement. In Proc. ACM/USENIX IMC, 2013.
- [16]
- M. Luckie, A. Dhamdhere, D. Clark, B. Huffaker, and k. claffy. Challenges in Inferring Internet Interdomain Congestion. In Proceedings of the ACM SIGCOMM Internet Measurement Conference (IMC), Nov 2014.
- [17]
- M. Luckie, A. Dhamdhere, B. Huffaker, D. Clark, and k. claffy. bdrmap: Inference of Borders Between IP Networks. In Proceedings of the ACM SIGCOMM Internet Measurement Conference (IMC), Nov 2016.
- [18]
- M. Luckie, B. Huffaker, and kc claffy. Learning regexes for router names in hostnames. In Proc. ACM IMC, 2019.
- [19]
- R. Mok, V. Bajpai, A. Dhamdhere, and kc Claffy. Revealing the Load Balancing Behavior of YouTube Traffic on Interdomain Links. In Proceedings of the Passive and Active Measurement Conference (PAM), 2018.
- [20]
- V. J. Ribeiro, R. H. Riedi, R. G. Baraniuk, J. Navratil, and L. Cottrell. pathchirp: Efficient available bandwidth estimation for network paths, 2003.
- [21]
- J. Sommers, R. Durairajan, and P. Barford. Automatic metadata generation for active measurement. In Proc. ACM IMC, 2017.
- [22]
- J. Strauss, D. Katabi, and F. Kaashoek. A measurement study of available bandwidth estimation tools. In Proc. ACM IMC, 2013.
- [23]
- S. Sundaresan, W. de Donato, N. Feamster, R. Teixeira, S. Crawford, and A. Pescapé. Broadband Internet performance: a view from the gateway. In Proc. ACM SIGCOMM, 2011.
- [24]
- S. Sundaresan, D. Lee, X. Deng, Y. Feng, and A. Dhamdhere. Challenges in inferring internet congestion using throughput measurements. In Proc. ACM IMC, 2017.
- [25]
- B. Yeganeh, R. Durairajan, R. Rejaie, and W. Willinger. A first comparative characterization of multi-cloud connectivity in today's Internet. In Proc. PAM, 2020.
File translated from TEX by TTH, version 4.12.